

Abstract
Human mtDNA genetic variants have traditionally been considered markers for ancient population migrations. However, during the past three decades, these variants have been associated with altered susceptibility to various phenotypes, thus supporting their importance for human health. Nevertheless, mtDNA disease association has frequently been supported only in certain populations, due either to population stratification or differential epistatic compensations among populations. To partially overcome these obstacles, we performed meta-analysis of the multiple mtDNA association studies conducted until 2016, encompassing 53,975 patients and 63,323 controls. Our findings support the association of mtDNA haplogroups and recurrent variants with specific phenotypes such as Parkinson’s disease, type 2 diabetes, longevity, and breast cancer. Strikingly, our assessment of mtDNA variants’ involvement with multiple phenotypes revealed significant impact for Caucasian haplogroups H, J, and K. Therefore, ancient mtDNA variants could be divided into those that affect specific phenotypes, versus others with a general impact on phenotype combinations. We suggest that the mtDNA could serve as a model for phenotype specificity versus allele heterogeneity.
The mitochondria are the main source of energy production via the oxidative phosphorylation system (OXPHOS) and play a major role in cell life and death1, the differentiation of most energy-consuming tissues, and even the emergence of new species2. The mitochondrion is the only organelle in animal cells that harbors its own genome (mtDNA), which is likely an ancient remnant of its alpha-proteobacterial ancestor3,4. Mitochondrial DNA is present in multiple copies per cell that vary in number between individuals and tissues1. Human mtDNA is 16,569 bp in length, and consists mainly (93% in humans) of genes that encode for 13 protein subunits of the OXPHOS complexes (I, III–V), two ribosomal RNAs (12SrRNA and 16SrRNA), and 22 tRNAs. The gene content of vertebrate mtDNA has remained stable throughout evolution, although gene order may vary5. Known gene regulatory elements are found mainly within the non-coding portion of the mtDNA (∼7% in humans), although recent findings imply that some mtDNA gene coding sequences have dual roles; they both code for genes and are bound by transcription factors and may thus have potential regulatory functions6.
The small number of genes encoded by the mtDNA is not sufficient to drive mitochondrial activities. Indeed, most genes (N = ~1500) required for mitochondrial function (such as apoptosis, nucleotide biosynthesis, fatty acid metabolism, iron metabolism, and so on) and for regulation of mtDNA transcription and replication are encoded by the nuclear genome (nDNA)7,8. These genes are translated in the cytoplasm, and in turn are imported into the mitochondrion7,9. Due to the bi-genomic origin of mitochondrial components, mutations in both mtDNA- and nDNA-encoded genes may lead to inherited metabolic disorders and increased susceptibility to complex diseases10. Thus, maintaining the efficient interaction between the factors encoded by the two genomes (mito-nuclear interactions) contribute to human health11. and in some cases may promote healthy, successful longevity12.
The association of mtDNA genetic variants with altered disease susceptibility has been reported in a wide range of clinical phenotype, most prominently Alzheimer’s disease (AD)13, Parkinson’s disease (PD)14, Type 2 diabetes mellitus (T2DM)15, Age-related macular degeneration (AMD)16, schizophrenia17, breast cancer, prostate cancer, pancreatic cancer18, multiple sclerosis (MS)19, myocardial infarction (MI)20, radiographic progression of knee osteoarthritis21, sperm motility22 and coronary artery disease (CAD)23, but also with non-clinical phenotypes such as longevity24 and the enhanced capabilities of elite athletes25 (Table 1) (and see also, references in Supporting Information Tables S2). Thus, mtDNA variants appear to be associated with a wide variety of phenotypes, in consistence with a major pleiotropic impact of mitochondrial variation on human health. Nevertheless, there are inconsistencies in the reported association of mtDNA genetic backgrounds (haplogroups) with phenotypes such as longevity26, AD27, T2DM28, breast cancer29, and prostate cancer30. This phenomenon interferes with our ability to understand the functional impact of mtDNA variants that stems from either epistatic interactions or population stratification. Such inconsistencies could be resolved, at least in part, by conducting large-scale meta-analysis.
Table 1. Number of analyzed studies and sample sizes.
| Phenotype | Number of studies | Sample size |
|
|---|---|---|---|
| Patients | Controls | ||
| AD | 14 | 4180 | 3717 |
| PD | 13 | 9243 | 17999 |
| T2DM | 15 | 11031 | 9804 |
| Longevity | 15 | 3502 | 5123 |
| Breast Cancer | 14 | 11788 | 13192 |
| Prostate Cancer | 6 | 1393 | 1397 |
| Sperm Motility | 4 | 3292 | 180 |
| Schizophrenia | 2 | 295 | 986 |
| AMD | 4 | 778 | 3626 |
| MS | 4 | 3896 | 1255 |
| MI | 3 | 2367 | 1678 |
| CAD | 2 | 969 | 3008 |
| PC | 2 | 1241 | 1358 |
| Total | 96 | 53975 | 63323 |
Here, we aim to partially overcome these inconsistencies via meta-analysis of a large collection of publicly available data from association studies. We employed stringent quality control to assess the role of common human mtDNA variants in the genetic basis of a variety of phenotypes. The results emphasize allelic heterogeneity in the human mitochondrial genome – whereas some haplogroups associate with specific phenotypes, others have a pleiotropic impact.
Results
Association of mtDNA haplogroups with neurodegenerative diseases
As the first step of our meta-analysis, we employed stringent quality-control criteria as we sifted through published studies (Fig. 1). Thus, we were able to focus our subsequent analysis on a specific subset of reported mtDNA-phenotype associations. Notably, most studies focused on populations with Caucasian ancestry.
Figure 1. Work flow of our meta-analysis.

After correcting for heterogeneity among the studies (see Methods), we found that only Caucasian individuals with haplogroup H had a significantly increased risk of developing AD (pooled OR = 1.283, p = 0.016, 95% CI (1.047–1.574)) (Fig. 2, Table 2, and Supplementary Figure S1). While considering PD, we found that individuals with mtDNA haplogroup K had a significantly reduced risk of developing PD (pooled OR = 0.839, p = 0.004, 95% CI (0.744–0.945)), as did individuals with either mtDNA haplogroup T (pooled OR = 0.857, p = 0.014, 95% CI (0.757–0.969)), or haplogroup J (pooled OR = 0.876, p = 0.011, 95% CI (0.79–0.971)) (Table 2 and Fig. 3). Notably, grouping haplogroups J and T due to phylogenetic considerations increased the strength of the reduced risk for PD, but did not change the effect size (pooled OR = 0.87, p = 0.003, 95% CI (0.793–0.954)) (Table 2 and Fig. 3). A significantly increased risk of developing PD was identified for individuals who belong to haplogroup cluster HV (pooled OR = 1.091, p = 0.038, 95% CI (1.005–1.184)) (Table 2 and Fig. 3). These results are precisely in line with previous meta-analysis performed for PD, and thus validate our approach31.
Figure 2. Forest plot of the association of mtDNA haplogroups with AD in Caucasians.
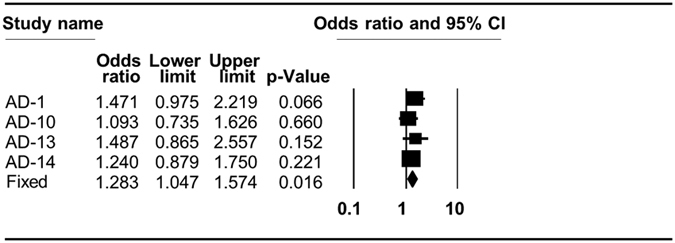
AD–Alzheimer’s disease. The overall (fixed) significant P-values for the calculated odds ratios are framed. Shown are the results of haplogroup H analysis (see also Table 2).
Table 2. Meta-analysis of mtDNA haplogroup association with diverse phenotypes.
| Phenotype | Haplogroup | OR | p-value |
|---|---|---|---|
| AD | H | 1.283 | 0.016 |
| T | 1.002 | 0.989 | |
| J | 0.987 | 0.92 | |
| K | 0.956 | 0.734 | |
| U | 1.018 | 0.85 | |
| V | 0.989 | 0.952 | |
| W | 0.992 | 0.975 | |
| X | 1.39 | 0.165 | |
| PD | K | 0.839 | 0.004 |
| T | 0.857 | 0.014 | |
| J | 0.876 | 0.011 | |
| HV | 1.091 | 0.038 | |
| JT | 0.87 | 0.003 | |
| T2DM | H | 0.966 | 0.558 |
| U | 1.074 | 0.377 | |
| T | 0.949 | 0.61 | |
| J | 1.078 | 0.742 | |
| X | 1.077 | 0.744 | |
| T2DM - Asian | 16189C | 1.345 | 0.000 |
| A | 1.263 | 0.044 | |
| D5 | 1.208 | 0.086 | |
| F | 1.164 | 0.049 | |
| G | 0.949 | 0.585 | |
| Longevity | H | 0.843 | 0.141 |
| I | 1.493 | 0.264 | |
| J | 1.717 | 0.025 | |
| K | 1.119 | 0.64 | |
| T | 0.882 | 0.575 | |
| U | 0.781 | 0.281 | |
| W | 0.071 | 0.000 | |
| X | 1.315 | 0.477 | |
| Longevity Asian | D | 1.252 | 0.165 |
| Breast Cancer | 10398G | 0.075 | 0.000 |
Figure 3. Forest plots for the association of mtDNA haplogroups with PD in Caucasians.

PD–Parkinson’s disease. The overall (fixed) significant P-values for the calculated odds ratios are framed. (A) Haplogroup K analysis. (B) Haplogroup T analysis. (C) Haplogroup J analysis. (D) Haplogroup cluster JT analysis. (E) Haplogroup cluster HV analysis.
Mitochondrial DNA haplogroups are associated with successful longevity
Our analysis confirmed the significant association of haplogroup J individuals with successful longevity (pooled OR = 1.717, p = 0.025, 95% CI (1.07–2.757)), as the frequency of haplogroup J was notably higher in centenarians as compared to younger individuals in various Caucasian populations. In contrast, haplogroup W individuals had significantly reduced odds of aging successfully (OR = 0.071, p = 0.000, 95% CI (0.038–0.133)) (Table 2, Fig. 4 and Supplementary Figure S2). Our analysis of Asian studies did not confirm any significant association between longevity and mtDNA haplogroups (Table 2 and Supplementary Fig. S2).
Figure 4. Forest plots for the association of mtDNA haplogroups with longevity in Caucasians.
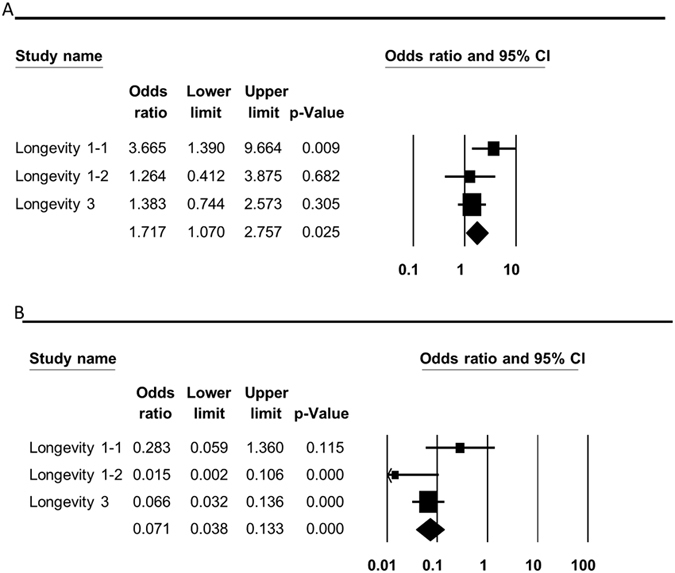
The overall (fixed) significant P-values for the calculated odds ratios are framed. (A) Haplogroup J analysis. (B) Haplogroup W analysis.
A worldwide recurrent common mtDNA variant, as well as mtDNA haplogroups in Asians, alter susceptibility to developing T2DM and breast cancer
Our analysis of studies performed in Caucasians as a whole did not support any association between T2DM and any mtDNA haplogroup (Table 2 and Supplementary Figure S3). However, when we analyzed the data from studies that looked for correlation of mtDNA haplogroups with T2DM in Asian populations, we identified an increased risk of developing T2DM in haplogroups A (pooled OR = 1.263, p = 0.044, 95% CI (1.007–1.585)) and F (pooled OR = 1.164, p = 0.049, 95% CI (1.001–1.353)) (Table 2 and Fig. 5). In addition, we confirm that the common recurrent variant 16,189C is associated with an increased risk of T2DM (pooled OR = 1.345, p = 0.000, 95% CI (1.190–1.522)) (Table 2 and Fig. 5)32. For haplogroup D5 and G, no association with T2DM could be supported (Supplementary Figure S4). In addition, our meta-analysis reported significant reduction in breast cancer risk for individuals who carry the 10,398G variant (pooled OR = 0.075, p = 0.000, 95% CI (0.067–0.085)) (Table 2 and Fig. 6).
Figure 5. Forest plots for the association of mtDNA haplogroups with T2DM in Asians.
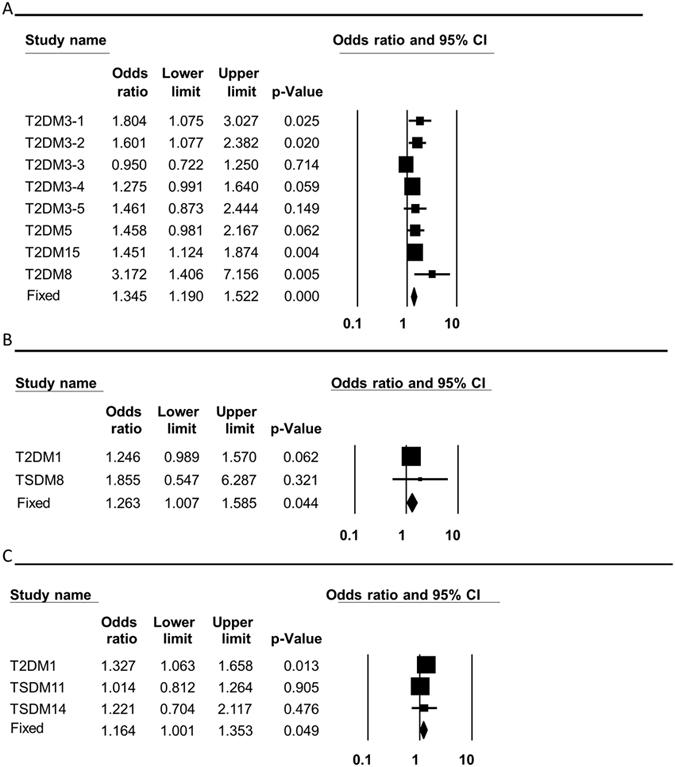
T2DM–type 2 diabetes mellitus. The overall (fixed) significant P-values for the calculated odds ratios are framed. (A) Variant 16,189C analysis. (B) Haplogroup A analysis. (C) Haplogroup F analysis.
Figure 6. Forest plots of the association of mtDNA haplogroups with breast cancer in Caucasians.
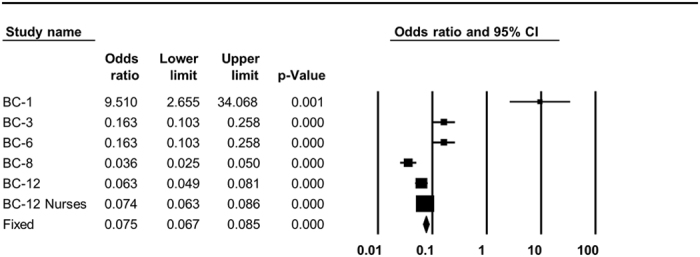
The overall (fixed) significant P-values for the calculated odds ratios are framed. Shown is the analysis of 10,398G variant.
Certain mtDNA haplogroups are associated with multiple phenotypes, suggesting pleiotropism
The risk of developing most common complex human diseases is influenced by multiple genetic and environmental factors, which are frequently shared between different phenotypes. It is thus very possible that a given SNP will be associated with more than a single phenotype. A close inspection of our results revealed that certain haplogroups had a significant impact on a repertoire of phenotypes, consistent with pleiotropism. While testing for the global impact of mtDNA genetic background on diverse phenotypes, we found significant global phenotypic impact of haplogroup H (pooled OR = 0.934, p = 0.048, 95% CI (0.872–0.999)), haplogroup K (pooled OR = 0.895, p = 0.016, 95% CI (0.817–0.98)), and haplogroup J (pooled OR = 0.908, p = 0.016, 95% CI (0.84–0.982)) (Table 3 and Fig. 7). No such global association was identified for the other haplogroups (Table 3 and Supplementary Figure S5). This result strongly suggests that the mutations that define these three Caucasian mtDNA haplogroups have a wide functional impact, in stark contrast to mutations that define other haplogroups (such as haplogroup W), whose functional implications are apparently phenotype-specific.
Table 3. MtDNA haplogroup association with grouped phenotypes.
| Haplogroup | OR | p-Value |
|---|---|---|
| H | 0.934 | 0.048 |
| K | 0.895 | 0.003 |
| J | 0.908 | 0.016 |
| I | 0.924 | 0.551 |
| T | 0.922 | 0.07 |
| U | 1.050 | 0.331 |
| V | 1.034 | 0.749 |
| W | 1.027 | 0.836 |
| X | 1.141 | 0.327 |
The significantly associated haplogroups are bolded.
Figure 7. MtDNA haplogroup association with grouped phenotypes.
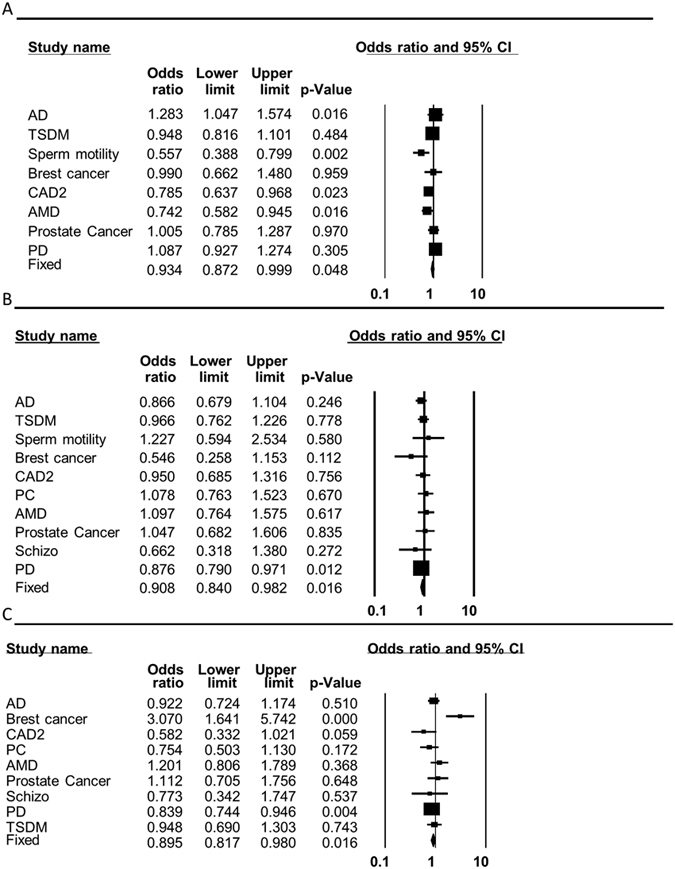
Forest plots for the analysis of the different phenotypes are shown. The overall (fixed) significant P-values for the calculated odds ratios are framed. (A) Haplogroup H analysis. (B) Haplogroup J analysis. (C) Haplogroup K analysis.
Discussion
During the past several decades, many common genetic variants have been associated with altered susceptibility to develop complex diseases, yet occasionally diverse phenotypes share association with the same variant, suggesting pleiotropism33,34,35,36. Pleiotropism underlines the diffuse boundaries between phenotypes in general and diseases in particular37,38,39. This is especially true for complex disorders that share phenotypic characteristics, and hence may share some of the same molecular mechanisms40. Genetic variation in the human mitochondrial genome constitutes an extreme case of pleiotropism, and underlines its involvement in a diverse repertoire of phenotypes. Specifically, our meta-analysis demonstrated the strength of association of mtDNA haplogroups with complex disorders including PD, T2DM, AD, and breast cancer, in addition to successful longevity. Furthermore, our analysis demonstrated that unlike other haplogroups, the phenotypic impact of haplogroups H, J, and K remained significant even while grouping the disease phenotypes tested (Fig. 8). This finding is consistent with a pleiotropic effect of these three haplogroups. Alternatively, the latter result may only reflect the strong functionality of the mutations defining haplogroups H, J and K, which remained significant even after analyzing an aggregate of the phenotypes tested. Taken together, ancient mtDNA variants have clear impact on human health. Our results underline the important role of this maternally inherited genome in the underlying mechanisms of multiple complex diseases.
Figure 8. The phenotypic impact of mtDNA haplogroups–phenotype specificity versus pleiotropism.
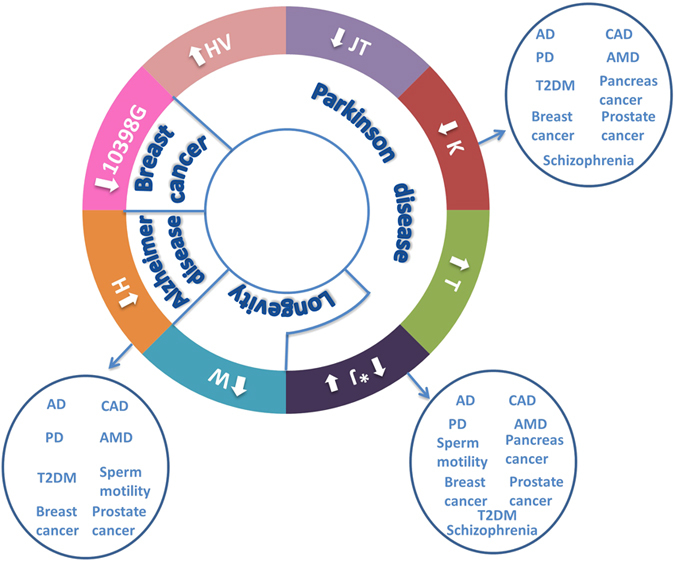
Arrows within the circles: Outward arrows–increased risk; inward arrows–reduced risk; *haplogroup J confers reduced risk to PD and supports successful longevity. Arrows outside the circle: altered susceptibility to an aggregate of phenotypes. The latter is observed in haplogroups H, J and K.
The underlying mechanism of the pleiotropic impact of variants is frequently ignored, mainly due to its apparent complexity and the resulting difficulty of investigating its molecular basis. This difficulty could be addressed, in part, by focusing on certain biochemical pathways. Mitochondrial-DNA-encoded factors constitute a good example of such pathways, as they are either protein members of the OXPHOS or RNA components of the mitochondrial translation system. Moreover, in contrast to the nuclear genome, mtDNA-encoded genes harbor many more variants due to the one order of magnitude higher mutation rate. Many of these variants have experimentally proven functional impact41,42,43,44,45, and support association with multiple phenotypes. Therefore, further assessment of the functional impact of mtDNA variants may serve as the first step towards understanding the molecular basis of pleiotropism.
Our meta-analysis not only strengthened the association of mtDNA variants with certain phenotypes, but also underlined their pleiotropic impact (Fig. 8). Specifically, whereas our phenotype-specific analysis underlined the association of mtDNA haplogroup K with PD, pooled odds ratio calculation (for all the phenotypic data) revealed that haplogroup K had an overall strong phenotypic impact, thus reflecting pleiotropism. Similar results were revealed for haplogroups J and H. Furthermore, close inspection of our data revealed that while haplogroup J is associated with protection against PD and support for successful aging, haplogroup H increases the susceptibility to certain age-related disorders (Table 2 and Fig. 8). These findings suggest a putative contrasting phenotypic impact of the mutations that define haplogroups J and H. We believe that future investigation of pleiotropism versus phenotype specificity of mtDNA variants (such as that of haplogroup W) may shed new light on the molecular impact of mtDNA mutations.
While they are encouraging, we stress that, like other meta-analyses, our findings may be affected by publication bias, mainly the traditional lack of publically available negative results. We were fortunate to be able to include such negative results in our analysis, especially regarding longevity26,46, AD27,47 (and see also, refs 1,10,13 and 14 in the Supporting Information) and prostate cancer30. A second source of publication bias may stem from over-representation of studies on association to PD, AD, and T2DM. We attempted to correct for this bias by calculating pooled odds ratios. A third possible problem may stem from mtDNA mis-annotation during haplogroup assignment in the studies included in our meta-analysis. Since we employed strict quality control criteria for data inclusion, which was based in part on haplogroup assignment methods, mis-annotation is expected to affect only a small proportion of the studies included in our analysis. Thus, we believe that such bias had only negligible impact on the current study. The only bias that we could not address was the overrepresentation of papers that focus on Caucasians, the relatively small representation of Asians, and the virtual absence of Africans. As the African population is very diverse, especially in terms of mitochondrial genomic sequences, more mitochondrial-based disease association studies from this continent will provide better insight on the contribution of mitochondrial genetic variation to disease.
Previous analysis in our lab demonstrated the functionality and possibly adaptive impact of recurrent ancient mtDNA variants during human evolution48. Some of these ancient recurrent variants (such as T3394C) not only had an adaptive potential in ancient times, but also altered susceptibility to human diseases today. Our current analysis further validated previous reports15,49 regarding the association of the highly recurrent variant T16,189C with susceptibility to T2DM in both Caucasians and Asians (Table 2 and Fig. 5). Since the T16,189C mutation likely appeared multiple times during human phylogeny, its adaptive role cannot be easily estimated.
Meta-analysis of mtDNA variants is blind to a major unique feature of mtDNA genetic variability–the distribution of mtDNA haplogroups may vary among closely related ethnic groups50. For example, association of mtDNA variants with complications of T2DM was identified only in certain Jewish populations51, and longevity was associated with haplogroup J only in certain Italian populations24. Therefore, while our meta-analysis overlooked population-specific effects of genetic variants, which in our case are considered false-negative results, it provided the ability to fortify the overall functionality of several common mtDNA variants. Our ability to support previous studies stems from the availability of a large data set. Hence, the apparent absence of significant association of mtDNA variants with more phenotypes does not necessarily indicate a lack of association, but rather underlines the need for additional data.
One of our main findings is that certain mtDNA variants associate with specific phenotypes, yet other mtDNA variants have a more general phenotypic impact. This reflects allelic heterogeneity in the mtDNA. Allelic heterogeneity has been demonstrated in several nuclear DNA loci, and could be divided into two subtypes: (A) One gene, one mutation, many phenotypes: For example, the C376T mutation within the LGR4 (Leucine-rich repeat-containing G-protein coupled receptor 4 gene) is strongly associated with low bone mineral density (BMD), osteoporotic fractures, as well as with an increased risk to develop squamous skin cell carcinoma and biliary tract cancer52. (B) One gene, many mutations, many phenotypes: For example, different mutations in the RET gene have been implicated in the etiology of Hirshprung disease as well as with Type 2 Multiple Endocrine Neoplasia (MEN)53. Similarly, loss of function mutations within the FGFR1 (fibroblast growth factor receptor 1) locus underlie the autosomal dominant form of Kallman syndrome, while gain of function mutations at the same site lead to a subtype of craniosynostosis (Pfeiffer syndrome)54,55. Indeed, our meta-analysis strongly supported both subtypes of mtDNA allelic heterogeneity. For example, the different variants defining haplogroups T and HV independently alter the susceptibility to Parkinson’s disease (Figs 3 and 8). Secondly, haplogroup J whose association was supported by our meta-analysis for a variety of phenotypes (Figs 7 and 8) is defined by variants of which some have experimentally-proven impact on mtDNA functional regulation45. Hence, our work, underline the mtDNA as an attractive model for allelic heterogeneity.
In summary, our analysis not only validated the association of mtDNA haplogroups with altered susceptibility to a variety of diseases and involvement with certain phenotypes, but also clearly underlined the pleiotropic impact of common mtDNA variants. Thus, it revealed that mtDNA variability stands out as a major player in allelic heterogeneity in humans.
Materials and Methods
Data sources and literature search
PubMed and Google Scholar search engines were used to identify publications (publically available until February 30, 2016) that describe association of mtDNA variants with phenotypes in humans. Supplementary Table S1 lists the details of our search strategies. No language restrictions were applied. All articles were reviewed to identify those that studied association between any phenotype and both mtDNA genetic backgrounds (haplogroup) and certain common variants. Our workflow is described in Fig. 1 and the full list of papers used divided according to the phenotypes are listed in Supplementary Tables S2–S11.
Quality control criteria
To avoid bias, studies that addressed these relationships while focusing on a certain haplogroup from the start while grouping other genetic backgrounds as ‘others’ were excluded from further analysis. We also excluded articles whose analysis relied on the same datasets. Studies with sample sizes below N = 50 were excluded. We classified the phenotype-haplogroup association analysis according to major global population assignment (i.e., Caucasian, African, and Asian). Occasionally, depending on sample size available, we used more focused populations (such as Iranians). Since only a small subset of the studies analyzed samples while considering gender, to avoid sample size issues we included data regardless of gender division and considered samples while combining the two sexes. To avoid sample size issues we considered the phenotypes ‘Longevity’ and ‘Extreme Longevity’ as a single combined group. To reduce mis-annotation bias we used association studies in which haplogroup assignment was based on the combination of coding region SNPs and control region sequences. Notably, our above-mentioned quality control criteria led to exclusion of many association studies using mitochondrial phenotypes such as the enhanced capabilities of elite athletes and sperm motility.
Data Extraction
Data was extracted while taking into account several study characteristics, including sample size, study design, sampling population, geographic location, participant characteristics (age and sex), statistical adjustment used, correlation of phenotype, and haplogroup. The data was sorted according to phenotypes per specific haplogroup (see examples in Supplementary Table S12). After classification of the sample data from the articles according to mtDNA haplogroups, we merged the data from studies separately according to phenotypes (Supplementary Table S13).
Meta-analysis statistics
Meta-analysis was conducted using Comprehensive Meta-Analysis software, Version 3 (www.meta-analysis.com). In total, 96 published studies that included 53,975 patient and 63,323 controls were screened and divided according to phenotypes (Table 1). From each paper, sample information (i.e., sample sizes, cases vs. controls, and so on) was extracted per phenotype-haplogroup association study (Table 2 and Table 4). Calculation of odds ratios (OR) was carried out to establish the phenotype association with mtDNA haplogroups. Heterogeneity analysis was performed to assess differences or similarities between the included studies. Prior to estimating the combined effect that emerged from a group of studies, we checked for similarity between the identified effects in each of the individual studies, so that the combined estimate would reflect a meaningful description of the overall collection of studies per phenotype. To employ the heterogeneity statistic, the weighted sum of squares of the residuals was used as a generalization of Cochran’s Q from meta-analysis to meta-regression. Following this calculation, a test of the null hypothesis (i.e., no residual heterogeneity) was performed by comparing Cochran’s Q to a chi square distribution56,57. Heterogenic data was excluded from further analysis. OR was calculated and estimated for a significant pool of haplogroup-phenotype associations. OR was significant when p < 0.05.
Table 4. Available sample size per phenotype-mtDNA haplogroup association study.
| Phenotype | Haplogroup | Patients per haplogroup (all patients) | Controls | Number of studies |
|---|---|---|---|---|
| AD | H | 88 (185) | 705 (2083) | 6 |
| T | 124 (1427) | 151 (1650) | 6 | |
| J | 126 (1427) | 166 (1650) | 6 | |
| K | 134 (1752) | 152 (1844) | 5 | |
| U | 287 (2363) | 295 (2426) | 7 | |
| V | 64 (1675) | 56 (1457) | 4 | |
| W | 38 (1935) | 32 (1700) | 5 | |
| X | 47 (1935) | 30 (700) | 5 | |
| T2DM | H | 1031 (2484) | 996 (2536) | 4 |
| U | 434 (2484) | 349 (2536) | 4 | |
| T | 210 (2484) | 223 (2536) | 4 | |
| J | 198 (2115) | 177 (1850) | 3 | |
| X | 45 (2115) | 37 (1850) | 3 | |
| T2DM (Asians) | 16189C | 1115 (3187) | 346 (2126) | 8 |
| A | 207 (2952) | 220 (3451) | 3 | |
| DS | 161 (3115) | 181 (3645) | 3 | |
| F | 386 (3115) | 412 (3645) | 3 | |
| G | 226 (2952) | 268 (3451) | 3 | |
| Longevity | H | 26 (502) | 373 (813) | 4 |
| I | 16 (437) | 17 (675) | 3 | |
| J | 44 (502) | 53 (813) | 4 | |
| K | 32 (437) | 45 (675) | 3 | |
| T | 35 (502) | 61 (813) | 3 | |
| U | 99 (502) | 150 (813) | 3 | |
| V | 14 (502) | 29 (813) | 4 | |
| W | 11 (437) | 15 (675) | 3 | |
| X | 13 (437) | 15 (675) | 3 | |
| Longevity Asian | D | 102(525) | 184 (781) | 3 |
| Breast Cancer | 10398G | 656 (359) | 791 (3751) | 6 |
Additional Information
How to cite this article: Marom, S. et al. MtDNA meta-analysis reveals both phenotype specificity and allele heterogeneity: a model for differential association. Sci. Rep. 7, 43449; doi: 10.1038/srep43449 (2017).
Publisher's note: Springer Nature remains neutral with regard to jurisdictional claims in published maps and institutional affiliations.
Supplementary Material
Acknowledgments
This work was supported by grants from the Israeli Science Foundation (610/12), the Binational Science Foundation (2013060) and US Army Life Sciences division grant LS (67993LS) awarded to DM. We thank Prof. Ofer Ovadia (BGU) and Prof. Eric Schon (Columbia University, USA) for engaging in critical discussions with us during the writing process.
Footnotes
The authors declare no competing financial interests.
Author Contributions S.M. performed all the analyses, designed the figures and tables; D.M. and S.M. wrote the paper; M.F. supervision of statistical analysis; D.M. conceived the study.
References
- Akiyama T. & Okada M. Spatial and developmental changes in the respiratory activity of mitochondria in early Drosophila embryos. Development 115, 1175–1182 (1992). [DOI] [PubMed] [Google Scholar]
- Gershoni M., Templeton A. R. & Mishmar D. Mitochondrial bioenergetics as a major motive force of speciation. Bioessays 31, 642–650 (2009). [DOI] [PubMed] [Google Scholar]
- Lane N. & Martin W. The energetics of genome complexity. Nature 467, 929–934 (2010). [DOI] [PubMed] [Google Scholar]
- Gray M. W. Mitochondrial evolution. Cold Spring Harb Perspect Biol 4, a011403, doi: 10.1101/cshperspect.a011403 (2012). [DOI] [PMC free article] [PubMed] [Google Scholar]
- Wallace D. C. & Chalkia D. Mitochondrial DNA genetics and the heteroplasmy conundrum in evolution and disease. Cold Spring Harb Perspect Biol 5, a021220, doi: 10.1101/cshperspect.a021220 (2013). [DOI] [PMC free article] [PubMed] [Google Scholar]
- Blumberg A. et al. Transcription factors bind negatively selected sites within human mtDNA genes. Genome Biol Evol 6, 2634–2646, doi: 10.1093/gbe/evu210 (2014). [DOI] [PMC free article] [PubMed] [Google Scholar]
- Shutt T. E. & Shadel G. S. A compendium of human mitochondrial gene expression machinery with links to disease. Environ Mol Mutagen 51, 360–379 (2010). [DOI] [PMC free article] [PubMed] [Google Scholar]
- Calvo S. E. & Mootha V. K. The mitochondrial proteome and human disease. Annu Rev Genomics Hum Genet 11, 25–44 (2010). [DOI] [PMC free article] [PubMed] [Google Scholar]
- Becker T., Bottinger L. & Pfanner N. Mitochondrial protein import: from transport pathways to an integrated network. Trends Biochem Sci 37, 85–91, doi: 10.1016/j.tibs.2011.11.004 (2012). [DOI] [PubMed] [Google Scholar]
- Wallace D. C. A Mitochondrial Paradigm of Metabolic and Degenerative Diseases, Aging, and Cancer: A Dawn for Evolutionary Medicine. Annu Rev Genet 39, 359–407 (2005). [DOI] [PMC free article] [PubMed] [Google Scholar]
- Gershoni M. et al. Disrupting mitochondrial-nuclear coevolution affects OXPHOS complex I integrity and impacts human health. Genome Biol Evol 6, 2665–2680, doi: 10.1093/gbe/evu208 (2014). [DOI] [PMC free article] [PubMed] [Google Scholar]
- Levin L. & Mishmar D. A Genetic View of the Mitochondrial Role in Ageing: Killing Us Softly. Adv Exp Med Biol 847, 89–106, doi: 10.1007/978-1-4939-2404-2_4 (2015). [DOI] [PubMed] [Google Scholar]
- Bi R. et al. Mitochondrial DNA haplogroup B5 confers genetic susceptibility to Alzheimer’s disease in Han Chinese. Neurobiol Aging 36, 1604 e1607–1616, doi: 10.1016/j.neurobiolaging.2014.10.009 (2015). [DOI] [PubMed] [Google Scholar]
- van der Walt J. M. et al. Mitochondrial polymorphisms significantly reduce the risk of Parkinson disease. Am J Hum Genet 72, 804–811. (2003). [DOI] [PMC free article] [PubMed] [Google Scholar]
- Poulton J. et al. Type 2 diabetes is associated with a common mitochondrial variant: evidence from a population-based case-control study. Hum Mol Genet 11, 1581–1583, doi: 10.1093/hmg/11.13.1581 (2002). [DOI] [PubMed] [Google Scholar]
- Mueller E. E. et al. Mitochondrial haplogroups and control region polymorphisms are not associated with prostate cancer in Middle European Caucasians. PLoS One 4, e6370 (2009). [DOI] [PMC free article] [PubMed] [Google Scholar]
- Levin L. & Mishmar D. A genetic view of the mitochondrial role in ageing: killing us softly. Adv Exp Med Biol 847, 89–106, doi: 10.1007/978-1-4939-2404-2_4 (2015). [DOI] [PubMed] [Google Scholar]
- Mi J. et al. The Relationship Between Altered Mitochondrial DNA Copy Number And Cancer Risk: A Meta-Analysis. Sci Rep-Uk 5, doi: ARTN10039 10.1038/srep10039 (2015). [DOI] [PMC free article] [PubMed] [Google Scholar]
- Tranah G. J. et al. Mitochondrial DNA sequence variation in multiple sclerosis. Neurology 85, 325–330, doi: 10.1212/WNL.0000000000001744 (2015). [DOI] [PMC free article] [PubMed] [Google Scholar]
- Nishigaki Y. et al. Mitochondrial haplogroup N9b is protective against myocardial infarction in Japanese males. Hum Genet 120, 827–836 (2007). [DOI] [PubMed] [Google Scholar]
- Fernandez-Moreno M. et al. A replication study and meta-analysis of mitochondrial DNA variants in the radiographic progression of knee osteoarthritis. Rheumatology (Oxford), doi: 10.1093/rheumatology/kew394 (2016). [DOI] [PMC free article] [PubMed] [Google Scholar]
- Montiel-Sosa F. et al. Differences of sperm motility in mitochondrial DNA haplogroup U sublineages. Gene 368, 21–27 (2006). [DOI] [PubMed] [Google Scholar]
- Kofler B. et al. Mitochondrial DNA haplogroup T is associated with coronary artery disease and diabetic retinopathy: a case control study. BMC Med Genet 10, 35 (2009). [DOI] [PMC free article] [PubMed] [Google Scholar]
- De Benedictis G. et al. Mitochondrial DNA inherited variants are associated with successful aging and longevity in humans. Faseb J 13, 1532–1536. (1999). [DOI] [PubMed] [Google Scholar]
- Maruszak A. et al. Mitochondrial DNA variation is associated with elite athletic status in the Polish population. Scand J Med Sci Spor 24, 311–318, doi: 10.1111/sms.12012 (2014). [DOI] [PubMed] [Google Scholar]
- Pinos T. et al. Are mitochondrial haplogroups associated with extreme longevity? A study on a Spanish cohort. Age (Dordr) 34, 227–233, doi: 10.1007/s11357-011-9209-5 (2012). [DOI] [PMC free article] [PubMed] [Google Scholar]
- Chinnery P. F. et al. Point mutations of the mtDNA control region in normal and neurodegenerative human brains. Am J Hum Genet 68, 529–532, doi: 10.1086/318204 (2001). [DOI] [PMC free article] [PubMed] [Google Scholar]
- Chinnery P. F. et al. Mitochondrial DNA haplogroups and type 2 diabetes: a study of 897 cases and 1010 controls. J Med Genet 44, e80, doi: 10.1136/jmg.2007.048876 (2007). [DOI] [PMC free article] [PubMed] [Google Scholar]
- Mosquera-Miguel A. et al. Is mitochondrial DNA variation associated with sporadic breast cancer risk? Cancer Res 68, 623–625; author reply 624, doi: 10.1158/0008-5472.CAN-07-2385 (2008). [DOI] [PubMed] [Google Scholar]
- Kim W. et al. Mitochondrial DNA haplogroup analysis reveals no association between the common genetic lineages and prostate cancer in the Korean population. PLoS One 3, e2211, doi: 10.1371/journal.pone.0002211 (2008). [DOI] [PMC free article] [PubMed] [Google Scholar]
- Hudson G. et al. Two-stage association study and meta-analysis of mitochondrial DNA variants in Parkinson disease. Neurology 80, 2042–2048, doi: 10.1212/WNL.0b013e318294b434 (2013). [DOI] [PMC free article] [PubMed] [Google Scholar]
- Park K. S. et al. A mitochondrial DNA variant at position 16189 is associated with type 2 diabetes mellitus in Asians. Diabetologia 51, 602–608, doi: 10.1007/s00125-008-0933-z (2008). [DOI] [PubMed] [Google Scholar]
- Bai R. K., Leal S. M., Covarrubias D., Liu A. & Wong L. J. Mitochondrial genetic background modifies breast cancer risk. Cancer Res 67, 4687–4694 (2007). [DOI] [PubMed] [Google Scholar]
- Niemi A. K. et al. A combination of three common inherited mitochondrial DNA polymorphisms promotes longevity in Finnish and Japanese subjects. Eur J Hum Genet 13, 166–170, doi: 10.1038/sj.ejhg.5201308 (2005). [DOI] [PubMed] [Google Scholar]
- Liao W. Q. et al. Novel mutations of mitochondrial DNA associated with type 2 diabetes in Chinese Han population. Tohoku J Exp Med 215, 377–384 (2008). [DOI] [PubMed] [Google Scholar]
- Huerta C. et al. Mitochondrial DNA polymorphisms and risk of Parkinson’s disease in Spanish population. J Neurol Sci 236, 49–54 (2005). [DOI] [PubMed] [Google Scholar]
- McKusick V. A. The growth and development of human genetics as a clinical discipline. American journal of human genetics 27, 261–273 (1975). [PMC free article] [PubMed] [Google Scholar]
- McKusick V. A. On lumpers and splitters, or the nosology of genetic disease. Perspectives in biology and medicine 12, 298–312 (1969). [DOI] [PubMed] [Google Scholar]
- Loscalzo J., Kohane I. & Barabasi A. L. Human disease classification in the postgenomic era: a complex systems approach to human pathobiology. Mol Syst Biol 3, 124, doi: 10.1038/msb4100163 (2007). [DOI] [PMC free article] [PubMed] [Google Scholar]
- Barabasi A. L., Gulbahce N. & Loscalzo J. Network medicine: a network-based approach to human disease. Nat Rev Genet 12, 56–68, doi: 10.1038/nrg2918 (2011). [DOI] [PMC free article] [PubMed] [Google Scholar]
- Martinez-Zamora A. et al. Defective Expression of the Mitochondrial-tRNA Modifying Enzyme GTPBP3 Triggers AMPK-Mediated Adaptive Responses Involving Complex I Assembly Factors, Uncoupling Protein 2, and the Mitochondrial Pyruvate Carrier. PLoS One 10, doi: ARTNe0144273 10.1371/journal.pone.0144273 (2015). [DOI] [PMC free article] [PubMed] [Google Scholar]
- Latorre-Pellicer A. et al. Mitochondrial and nuclear DNA matching shapes metabolism and healthy ageing. Nature 535, 561–565, doi: 10.1038/nature18618 (2016). [DOI] [PubMed] [Google Scholar]
- Ji F. et al. Mitochondrial DNA variant associated with Leber hereditary optic neuropathy and high-altitude Tibetans. Proc Natl Acad Sci USA 109, 7391–7396 (2012). [DOI] [PMC free article] [PubMed] [Google Scholar]
- Kazuno A. A. et al. Identification of Mitochondrial DNA Polymorphisms That Alter Mitochondrial Matrix pH and Intracellular Calcium Dynamics. PLoS Genet 2, e128 (2006). [DOI] [PMC free article] [PubMed] [Google Scholar]
- Suissa S. et al. Ancient mtDNA genetic variants modulate mtDNA transcription and replication. PLoS Genet 5, e1000474 (2009). [DOI] [PMC free article] [PubMed] [Google Scholar]
- Dato S. et al. Association of the mitochondrial DNA haplogroup J with longevity is population specific. Eur J Hum Genet 12, 1080–1082 (2004). [DOI] [PubMed] [Google Scholar]
- Coppede F. et al. A Ser326Cys polymorphism in the DNA repair gene hOGG1 is not associated with sporadic Alzheimer’s disease. Neurosci Lett 414, 282–285, doi: 10.1016/j.neulet.2006.12.035 (2007). [DOI] [PubMed] [Google Scholar]
- Levin L., Zhidkov I., Gurman Y., Hawlena H. & Mishmar D. Functional Recurrent Mutations in the Human Mitochondrial Phylogeny: Dual Roles in Evolution and Disease. Genome Biology and Evolution 5, 876–890, doi: 10.1093/gbe/evt058 (2013). [DOI] [PMC free article] [PubMed] [Google Scholar]
- Park K. S. et al. A mitochondrial DNA variant at position 16189 is associated with type 2 diabetes mellitus in Asians. Diabetologia 51, 602–608, doi: 10.1007/s00125-008-0933-z (2008). [DOI] [PubMed] [Google Scholar]
- Feder J., Ovadia O., Glaser B. & Mishmar D. Ashkenazi Jewish mtDNA haplogroup distribution varies among distinct subpopulations: lessons of population substructure in a closed group. Eur J Hum Genet 15, 498–500 (2007). [DOI] [PubMed] [Google Scholar]
- Feder J. et al. Differences in mtDNA haplogroup distribution among 3 Jewish populations alter susceptibility to T2DM complications. BMC Genomics 9, 198, doi: 10.1186/1471-2164-9-198 (2008). [DOI] [PMC free article] [PubMed] [Google Scholar]
- Styrkarsdottir U. et al. Nonsense mutation in the LGR4 gene is associated with several human diseases and other traits. Nature 497, 517–520, doi: 10.1038/nature12124 (2013). [DOI] [PubMed] [Google Scholar]
- Cosma M. P., Cardone M., Carlomagno F. & Colantuoni V. Mutations in the extracellular domain cause RET loss of function by a dominant negative mechanism. Molecular and cellular biology 18, 3321–3329 (1998). [DOI] [PMC free article] [PubMed] [Google Scholar]
- Dode C. et al. Loss-of-function mutations in FGFR1 cause autosomal dominant Kallmann syndrome. Nature genetics 33, 463–465, doi: 10.1038/ng1122 (2003). [DOI] [PubMed] [Google Scholar]
- Muenke M. & Schell U. Fibroblast-growth-factor receptor mutations in human skeletal disorders. Trends in genetics: TIG 11, 308–313 (1995). [DOI] [PubMed] [Google Scholar]
- Higgins J. P. T. & Thompson S. G. Controlling the risk of spurious findings from meta-regression. Stat Med 23, 1663–1682, doi: 10.1002/sim.1752 (2004). [DOI] [PubMed] [Google Scholar]
- Oaks T. Practical Meta-Analysis (2001).
Associated Data
This section collects any data citations, data availability statements, or supplementary materials included in this article.