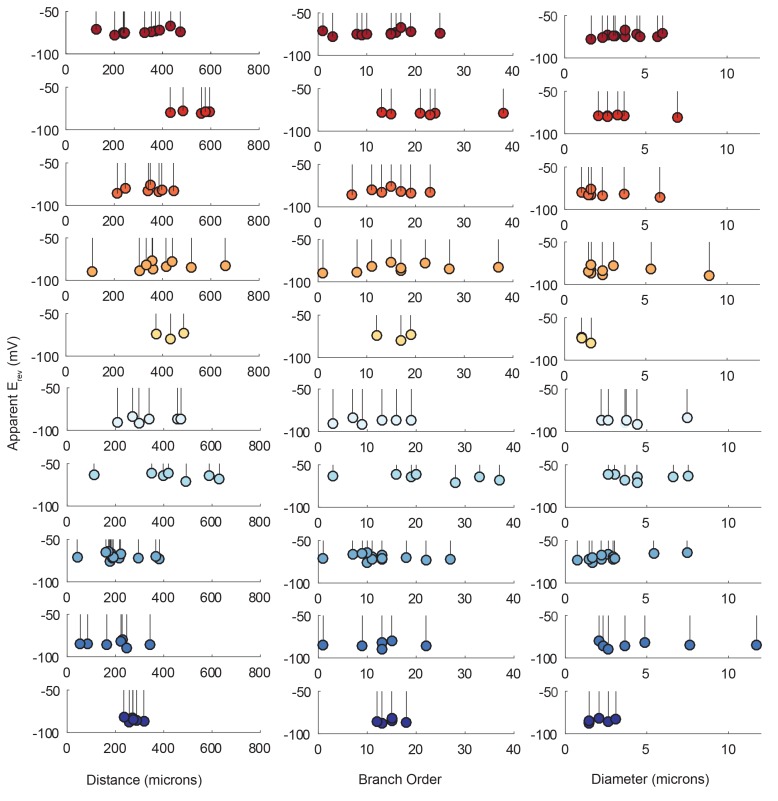
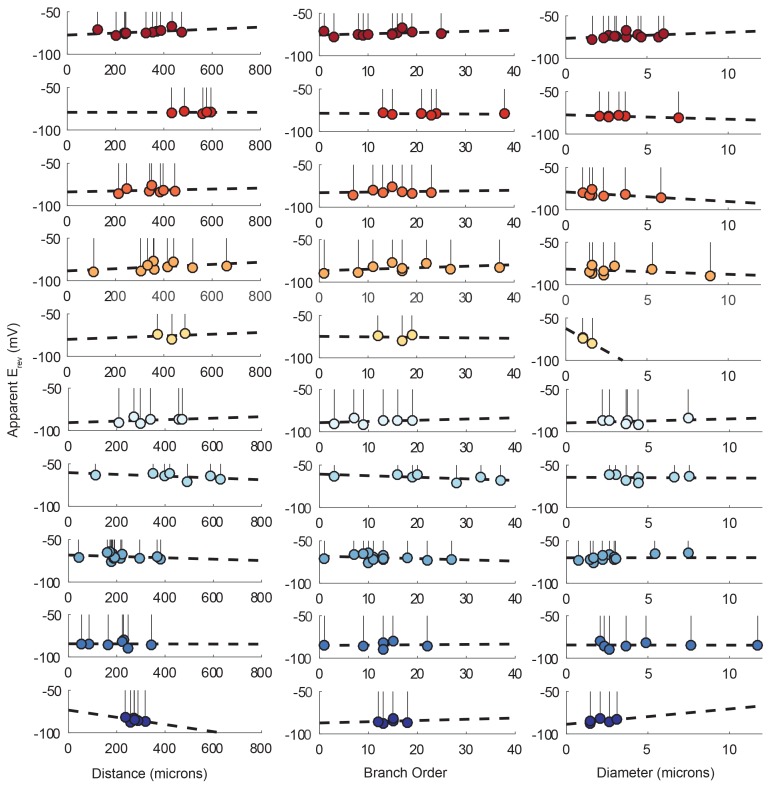
Figure 9. Reversal potentials as a function of various cable properties.
Each lolliplot shows the glutamate response apparent reversal potentials (Erevs) for photo-uncaging sites as function of their distance from the soma, branch order, and neurite diameter. Each color and lolliplot is indicative of the set of reversal potentials across sites within a single neuron (N = 10). Focal glutamate responses were evoked at varying membrane potentials (between −120 and −40 mV) with two-electrode current clamp at the soma. Apparent Erevs for each photo-uncaging site were determined as in Figure 6. Distance and branch order measurements were generated from skeletal reconstructions. Diameter measurements were generated by manual measurement of neuronal dye-fill confocal stacks.


