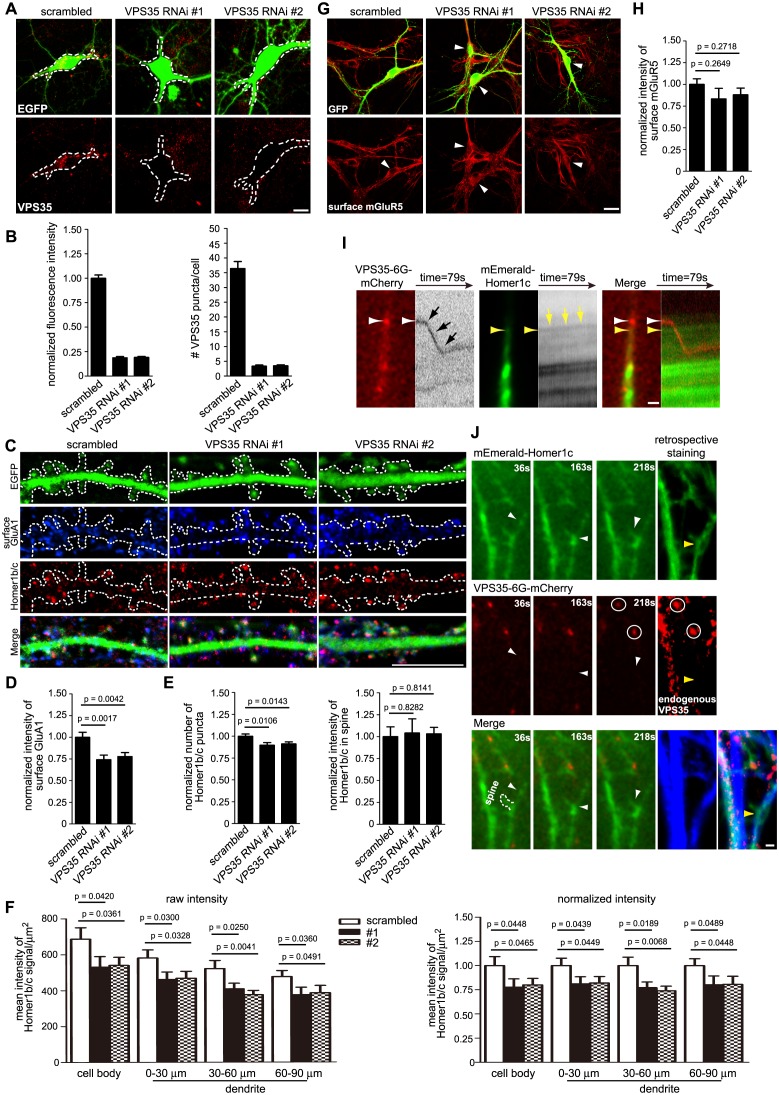
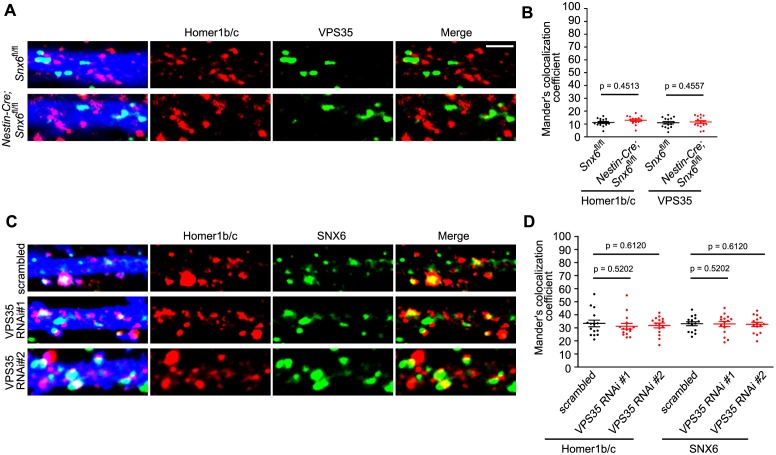
Figure 10. The retromer core complex is not required for SNX6-regulated dendritic distribution of Homer1b/c.
(A) Hippocampal neurons were transfected with lentiviral vector expressing siRNA along with GFP at DIV12, fixed on DIV18 and immunostained with antibodies to VPS35. (B) Quantification of VPS35 signal intensity and puncta number in neurons in (A) (mean ± SEM, n = 10, N = 3). (C) Neurons transfected with siRNA constructs were immunostained with antibodies to surface GluA1 and Homer1b/c. (D–E) Quantification of surface GluA1 (D) (mean ± SEM, scrambled: 33 neurons; VPS35 RNAi #1: 30 neurons; VPS35 RNAi #2: 30 neurons, N = 3.) or Homer1b/c distribution in spines (E) (mean ± SEM, scrambled: 35 neurons; VPS35 RNAi #1: 32 neurons; VPS35 RNAi #2: 30 neurons. N = 3 ). (F) Quantification of Homer1b/c distribution in the cell body and dendrites of hippocampal neurons expressing scrambled or VPS35-targeting siRNA (mean ± SEM, n = 15, N = 3). The results show a decrease in signal intensity of Homer1b/c throughout the cell when VPS35 was depleted. (G) Same as (C), except that neurons were immunostained with antibodies to surface mGluR5. (H) Quantification of surface mGluR5 in (G) (mean ± SEM, scrambled: 35 neurons; VPS35 RNAi #1: 44 neurons; VPS35 RNAi #2: 52 neurons. N = 3 ). (I–J) TIR-FM of hippocampal neurons transfected with Homer1c and VPS35-expressing constructs. Shown in (I) is a VPS35-positive vesicle (white arrow) moving away from the cell body and bypassing a static Homer1c-positive structure (yellow arrow) with their respective kymographs to the right. Shown in (J) are still images of representative time points: a Homer1c-positive structure reached the base of spine and part of which entered the spine after a brief lag. White arrowheads indicate the mobile Homer1c structure. A retrospective staining of MAP2 and VPS35 after live imaging (right panels) illuminates the dendrite identity and the absence of endogenous VPS35 at the base of the spine. Yellow arrowhead indicates the position of the Homer1c-positive structure right before fixation. White circles indicate VPS35 puncta appearing in both retrospective staining and live imaging. Bars: 5 μm in (A) and (C), 20 μm in (G) and 1 μm in (I) and (J).
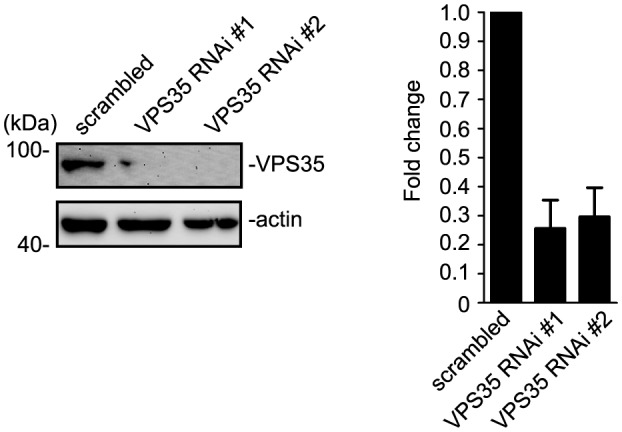
Figure 10—figure supplement 1. VPS35 is efficiently knocked down in HEK293 cells.


