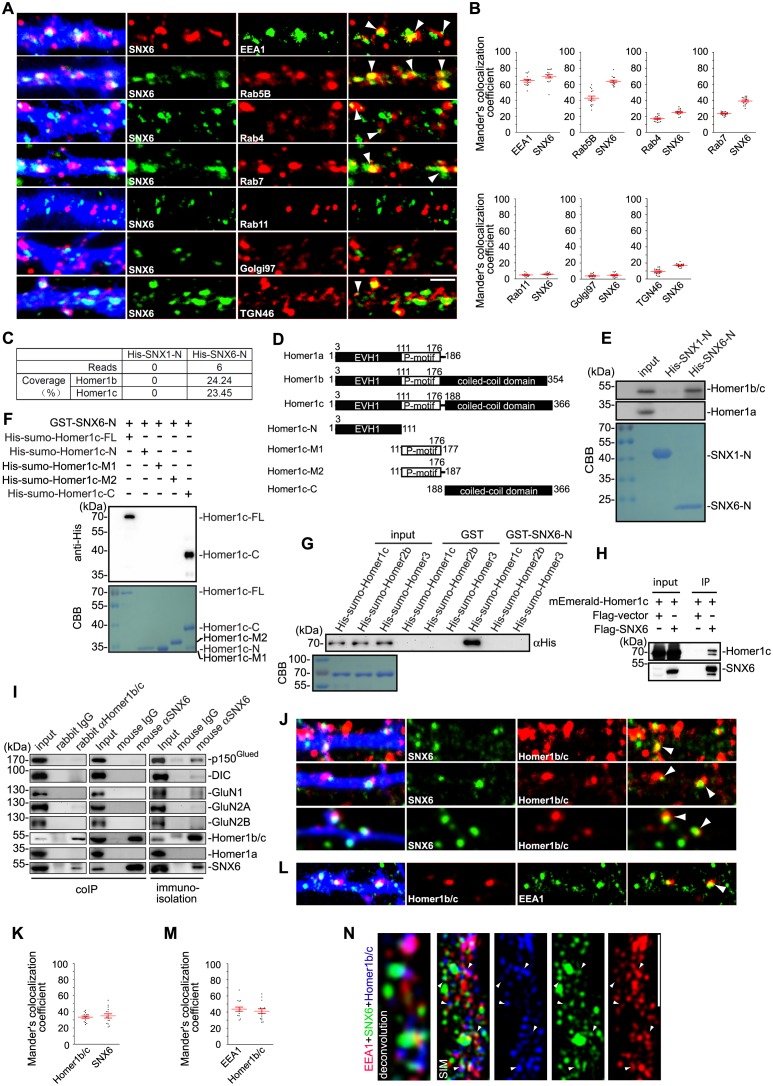
Figure 4. SNX6 interacts with Homer1b/c and colocalizes with Homer1b/c on endosomes.
(A) Hippocampal neurons were transfected with pLL3.7.1 on DIV14 to express DsRed as volume marker, fixed on DIV17 and immunostained with antibodies to SNX6 and vesicular markers. DsRed is pseudocolored for presentation. White arrowheads indicate overlapped signals. (B) Quantification of colocalization in (A) from 45 dendritic segments of 15 neurons (mean ± SEM, N = 3. Total length of dendrites: 1568 μm for EEA1; 1447 μm for Rab5; 1637 μm for Rab4; 1489 μm for Rab7; 1319 μm for Rab11; 1207 μm for Golgi97 and 1462 μm for TGN46). (C) Mouse brain lysates were incubated with His-SNX1-N or His-SNX6-N immobilized on Ni-NTA agarose. Bound proteins were subjected to SDS-PAGE and mass spectrometry analysis. The table shows the number of Homer1b/c unique peptides identified by mass spec analysis and their sequence coverage. (D) Schematic representation of the domain structure of Homer1 isoforms and Homer1c fragments used in this study. (E) Upper panels: immunoblotting of bound proteins in (C). Lower panel: coomassie brilliant blue (CBB) stained SDS-PAGE gel shows purified recombinant proteins. (F) Mapping of SNX6-Homer1b/c interaction sites by in vitro binding assay. (G) In vitro binding assay of SNX6 and Homer family members. (H) Lysates from HEK293 cells overexpressing Flag-SNX6 and mEmerald-Homer1c were subjected to co-IP with Flag M2 beads, followed by immunoblotting with antibodies to Flag and Homer1b/c. (I) Total lysates and membrane fractions from mouse brain lysates were subjected to IP and immunoisolation with antibodies to Homer1b/c or SNX6, and antibodies to SNX6 coupled to Dynabeads Protein G, respectively. Shown are immunoblots probed with antibodies to SNX6, p150Glued, DIC, GluN1, GluN2A, GluN2B, Homer1b/c and Homer1a. (J) DIV18 neurons were immunostained with antibodies to Homer1b/c and SNX6. (K) Quantification of colocalization in (J) from 45 dendritic segments of 15 neurons (mean ± SEM, N = 3 independent experiments. Total length 1677 μm). (L) DIV18 neurons were immunostained with antibodies to Homer1b/c and EEA1. (M) Quantification of colocalization in (L) from 45 dendritic segments of 15 neurons (mean ± SEM, N = 3. Total length 1459 μm). (N) DIV18 neurons were immunostained with antibodies to EEA1, Homer1b/c, and SNX6. Superresolution images were captured by structured illumination microscopy (SIM). White arrowheads indicate overlaps of signals from different channels. Bars: 2 μm.


