Abstract
The effect of small oxide additions on the polymorphism of Bi2O3 was studied by means of high-temperature x-ray diffractometry. Solidus and occasional liquidus temperatures were approximated, so that tentative partial phase diagrams for 33 oxide additions were constructed. Only the monoclinic and the cubic forms of Bi2O3 were found to be stable. Other phases, frequently reported by previous investigators, such as tetragonal and body-centered cubic (b.c.c.), were shown to form metastably from cooled liquid or cubic. An impure b.c.c. phase of distinct but variable composition appeared in systems of ZnO, PbO, B2O3, Al2O3, Ga2O3, Fe2O3, SiO2, GeO2, TiO2, and P2O5. The impure b.c.c. phase in the systems with SiO2, GeO2, and TiO2 melted congruently about 100 °C above the m.p. of Bi2O3. The impure b.c.c. phase was formed metastably in systems with Rb2O, NiO, MnO, CdO, V2O5, and Nb2O5; the conditions of formation were dependent on composition, preparation, and heating schedules. The impure b.c.c. phases, both stable and metastable, had smaller unit cell dimensions than that of pure Bi2O3.
1. Introduction
Part I of this paper was an attempt to clarify the stable and metastable relationships of pure Bi2O3. It can be seen in table 1 of that part, however, that I several investigators [1,2,3]1 have reported phases of Bi2O3 which contained, or were contaminated by, other oxides. Sillén [1] obtained a body centered cubic (b.c.c.) form by fusing Bi2O3 in porcelain, or with A12O3 or Fe2O3, for 5 min at 900 °C. He suggested the unit cell formula Me2Bi24O40. Fusion of Bi2O3 in a porcelain crucible for 20 min yielded cubic Bi2O3. Schumb and Rittner [2] also obtained the impure b.c.c. phase by fusing Bi2O3 at 875 °C in porcelain or with SiO2. By quenching the fused mixture in water, they produced an impure cubic (C) phase. Gattow and Schröder [3] reported impurity forms of b.c.c., C, and tetragonal-symmetry, designated respectively, as γ*, δ*, β*.
Table 1.
Unit cell demensions of rhombohedral phases formed in Bi2O3 systems
| Oxide addition | Starting composition | Final heat treatment | Additional phases present | Ionic radius of cation (Ahrens) | Unit cell dimensions
|
||||
|---|---|---|---|---|---|---|---|---|---|
| Hexagonal | Rhombohedral | ||||||||
|
|
|
|
|
|
|
|
|
|
|
| °C/hr | a | c | c/a | a | α | ||||
| A | A | A | |||||||
| CaOa | 6Bi2O3:CaO | 700°/107 | None | 0.99 | 3.941 | 27.95 | 7.09 | 9.590 | 23°44′ |
| SrOa,b | 19Bi2O3:2SrO | 699°/144 | Mon Bi2O3 (moderate) | 1.12 | 3.952 | 28.09 | 7.11 | 9.637 | 23°40′ |
| BaOa | 6Bi2O3:BaO | 700°/107 | b.c.c. Bi2O3 (small) | 1.34 | 3.972 | 28.54 | 7.185 | 9.786 | 23°26′ |
| Sm2O3 | 12Bi2O3:Sm2O3 | 700°/107 | tr? | 1.00 | 3.950 | 27.93 | 7.07 | 9.585 | 23°46′ |
| La2O3 | 12Bi2O3: La2O3 | 700°/107 | b.c.c. Bi2O3 (moderate) | 1.14 | 3.975 | 28.10 | 7.07 | 9.644 | 23°48′ |
The previous work can be questioned on two grounds: Firstly, in most cases the exact compositions were not controlled and were not known; secondly, in no instances were the phases studied at temperature and, consequently, might not represent stable equilibrium phases. Quenched liquids, for example, could hardly be expected to give equilibrium phases for any temperature. Furthermore, as the stable phases of Bi2O3 have been shown to be monoclinic and cubic-bismuth oxide, any other phase, e.g., impure tetragonal (Tet) or b.c.c. must represent either a metastable form of Bi2O3 or a discrete phase, whose composition limits does not include Bi2O3.
The major objective of this portion of the study, therefore, was to obtain information on the impure forms of bismuth oxide, in particular, on the b.c.c. phase. To eliminate objections applicable to previous work, mixtures were formulated from pure materials and of known compositions and were studied in a high-temperature x-ray diffractometer furnace.
2. Materials and Methods
2.1. Materials
For the admixture study, reagent grade chemicals (ACS) or those of higher purity were used. Starting materials for formulating oxide mixtures with Bi2O3 were as follows: Li2CO3, Rb2CO3, NiO, ZnO, CdO, MgO, CaCO3, SrCO3, BaCO3, PbO, B2O3, Al2O3, Ga2O3, Fe2O3, MnCO3, Sb2O3, Lu2O3, Sm2O3, La2O3, SiO2, GeO2, TiO2, TeO2, SnO2, ZrO2, CeO2, P2O5, V2O5, Sb2O5, Ta2Os, Nb2O5, Cr2O3, WO3, and MoO3. These materials were chosen from crystal chemistry considerations, such as charge, ionic radius, coordination number, and polarizability of the cations.
2.2. Preparation of Mixtures
Binary mixtures were formulated from Bi2O3 and a second substance, to give an atomic ratio in most cases of 12Bi to 1Me, where Me represents the second cation. The intent was to determine which oxides formed Sillén’s [1] impure b.c.c. phase at the above ratio. Thus for monovalent, trivalent, and pentavalent cations, oxide compositions would correspond to 12Bi2O3:Me2O, 12Bi2O3:Me2O3, and 12Bi2O3:Me2O5. For divalent, tetravalent, and hexavalent cations, oxide compositions would correspond to 6Bi2O3:MeO, 6Bi2O3:MeO2, and 6Bi2O3: MeO3. Additional compositions were prepared in many of the systems, as designated on the individual phase diagrams.
Preliminary treatment of the mixtures consisted of three cycles of grinding together calculated amounts of the starting materials, pressing the material in a mold, and then heating the disk at a temperature below the solidus, as described in previous publications [4,5].
2.3. Apparatus
The high-temperature, x-ray diffractometer furnace noted in Part I was used also for the admixture study. The modification of the sample holder [6] which permitted the use of a thin layer of powered specimen was of especial importance for this part of the study. X-ray diffraction patterns of crystalline phases could be obtained in the presence of liquid, which did not flow off the platinum holder. Thus, it was possible to approximate solidus temperatures (±10°) and under favorable conditions even the liquidus temperatures.
3. Results and Discussion
3.1. Phase Diagrams
a. General Remarks
The data obtained by use of the high-temperature x-ray furnace can be presented in the form of phase diagrams, as shown in figures 1 through 6. Arrangement of the figures is according to the Periodic Table. Within each figure, diagrams are arranged, in general, according to a combination of the Periodic Table subgroups and ionic radii of the atoms. As no table of data is given, figure captions include selected notes. In most instances, the rate of disappearance of old phases and of the appearance of new ones on the indicated boundary curves was not rapid but took place over a temperature interval. Phases which have been interpreted as nonequilibrium ones are not shown in the diagrams.
Figure 1. Bi2O3 rich regions of Bi2O3–R2O systems, as determined from high-temperature x-ray diffraction data.
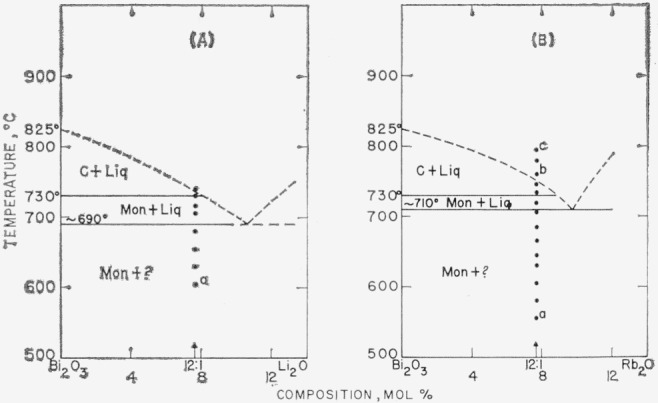
Phases: Mon—monoclinic, C—cubic, ?—unknown, Liq—liquid
(A) Bi2O3–Li2O
a—Trace of unknown phase observed.
(B) Bi2O3–Rb2O
a—No second phase seen,
b—Rb2O apparently volatilizes from liquid,
c—Liquid cools to b.c.c. phase: a=10.22A.
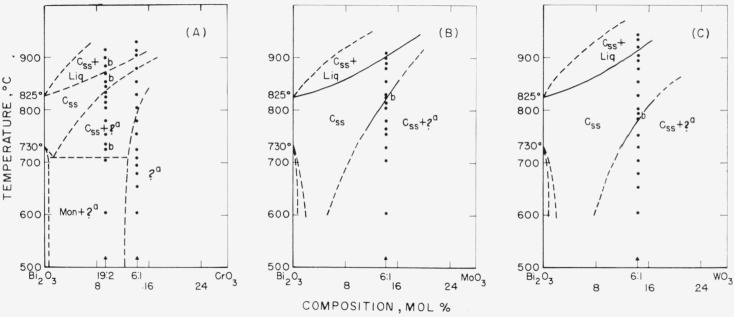
Figure 6. Bi2O3 rich regions of Bi2O3—RO3 systems, as determined from hiqh-temperature x-ray diffraction data.
Phases: Mon—monoclinic, C—cubic, ss—solid solution, ?—unknown, Liq— liquid
(A) Bi2O3—CrO3
Compositions formulated from Cr2O3. Diagram shown on CrO3 basis because on calcining, specimens changed in color from green to red, and ? phase is similar to that formed with the hexavalent ions.
a—Unknown composition, apparently pseudotetragonal (similar to the phase in the Bi2O3—MoO3 and Bi2O3—WO3 systems).
b—Phases found at these temps, do not agree entirely with postulated phase boundaries, because system may be pseudobinary.
(B) Bi2O3—MoO3
a—Unknown composition, apparently pseudotetragonal (similar to the phase in the Bi2O3—CrO3 and Bi2O3—WO3 systems).
b—Reversibility demonstrated with high-temp, x ray.
(C) Bi2O3—WO3
a—Unknown composition, apparently pseudotetragonal (similar to the phase in the Bi2O3—CrO3 and Bi2O3—MoO3 systems).
b—Reversibility demonstrated with high-temp, x ray.
It is emphasized that these phase diagrams represent the best interpretation of the data within the limitations of the experimental method. The major limitation is due to volatility of the samples or of the constituents. The high surface-to-volume ratio inherent with a thin film method, increases the effect of volatilization on composition. Thus, verification of equilibrium by long soaking periods, especially at high temperatures, was precluded.
b. General Conclusions
From inspection of all of the diagrams, several general conclusions become evident:
The only stable phases of pure bismuth oxide are Mon and C. The b.c.c. or Tet phases of pure Bi2O3 do not appear. The conclusion is consistent with the stability relationships for Bi2O3 as deduced in Part I.
Monoclinic Bi2O3 shows little or no solid solution.
The C phase of Bi2O3, however, may show extensive solid solution: and in such cases, the Mon to C transition temperature is lowered.
Except for the CdO and PbO systems (fig. 2 G& H), the effect of solid solution in the C phase is to raise solidus and liquidus temperatures.
A b.c.c. phase distinct from that of pure Bi2O3 appears in a number of systems. This b.c.c. phase may vary in composition for different systems (see figs. 2F, 3B & C, 4A, 5A), may melt congruently (fig. 4A, B & C), or melt incongruently (figs. 2H, 3A & B), and when stable is separated from Bi2O3 by a two-phase region.
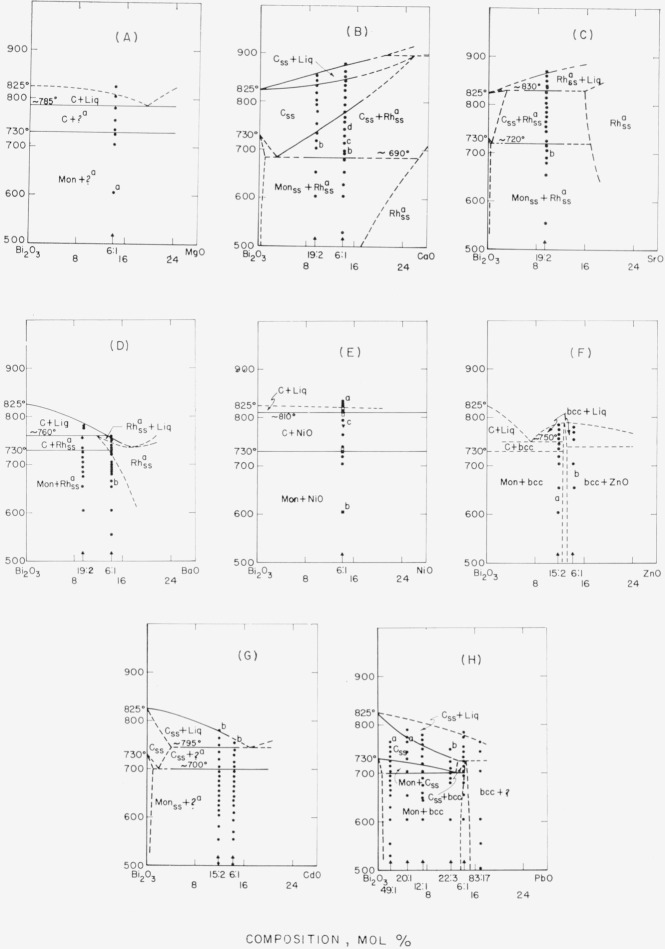
Figure 2. Bi2O3 rich regions of Bi2O3–RO systems, as determined from high-temperature x-ray diffraction data.
Phases: Mon—monoclinic, C—cubic, b.c.c.—body-centered cubic, ?—unknown, Rh—rhombohedral, ss—solid solution, Liq—liquid
(A) Bi2O3–MgO
a—Second phase, possibly MgO.
(B) Bi2O3–CaO
a—Described by Aurivillius (1943) [7].
b—Cubic Bi2O3 ss starting to form,
c—Cubic Bi2O3 ss increasing; Mon Bi2O3 decreasing,
d—Mon Bi2O3 gone.
The 6:1 composition slow-cooled from 700 °C (after 107 hr soaking period) shows single phase Rhss. See table 1 for unit cell dimensions.
(C) Bi2O3–SrO
a—Described by Sillén and Aurivillius (1939) [8].
b—Rhss increasing; Mon decreasing. See table 1 for unit cell dimensions.
(D) Bi2O3–BaO
a—Described by Aurivillius (1943) [7].
b—Rhss increasing; Mon decreasing. See table 1 for unit cell dimensions.
(E) Bi2O3—NiO
a—Liq cools to b.c.c.
●—First heat
□—b.c.c. reheated
■—Superposition of ● and □.
▼ -Reheated sample cooled from liq to 780 °C
b—b.c.c. decomposing to Mon.
c—Cubic phase when cooled to room temperature shows b.c.c.
(F) Bi2O3—ZnO
a—No Mon detected.
b—ZnO detected only in specimen soaked 107 hr at 700 °C and then slow-cooled.
The two compositions studied indicate that the b.c.c. phase is stable and melts congruently.
Beyond this the diagram is conjectural.
G) Bi2O3—CdO
a—Possibly one of Sillén’s reported CdO—Bi2O3 phases [9].
b—Liq cools to b.c.c.
(H) Bi2O3—PbO
a—Css cools to b.c.c.
b—Css+ Liq cools to b.c.c.
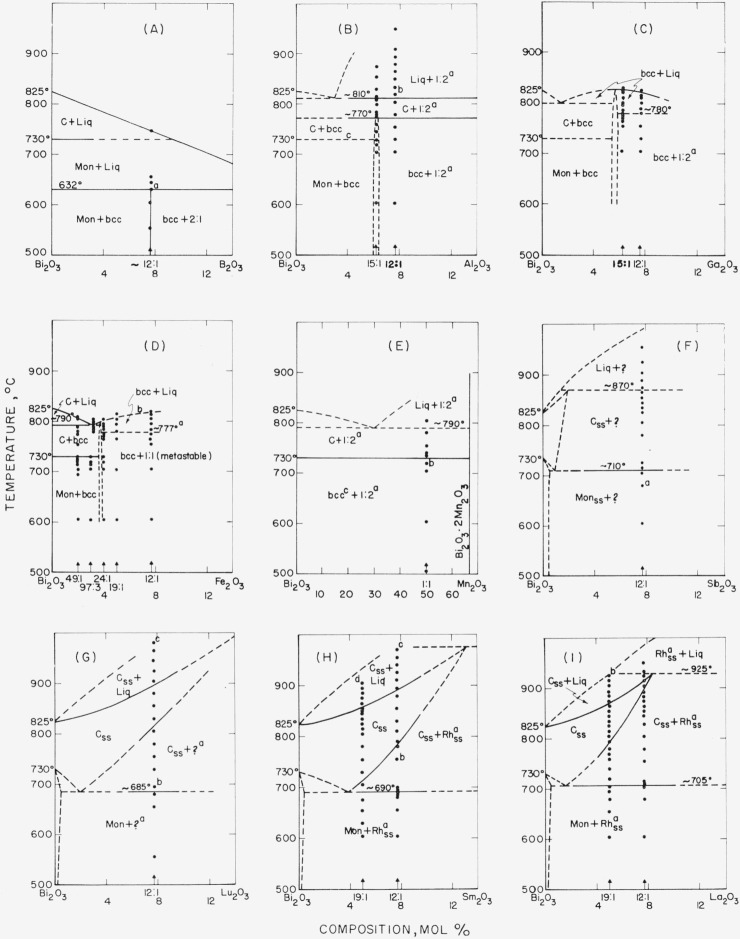
Figure 3. Bi2O3 rich regions of Bi2O3–R2O3 systems, as determined from high-temperature x-ray diffraction data.
Phases: Mon—inonoclinic, C—cubic, b.c.c.—body-centered cubic, ?—unknown, Rh—rhombohedral, ss—solid solution, Liq—liquid.
(A) Bi2O3—B2O3
Diagram taken from Levin et al. [4].
a—Unreacted 2Bi2O3·B2O3(2:1) and Mon Bi2O3 at lower temperatures form single phase b.c.c.
B) Bi2O3—Al2O3
a—Isostructural with 1:2 compounds in systems of Bi2O3 with Fe2O3, Ga2O3, and Mn2O3, according to unpublished work of R. S. Roth.
b—Very strong peak at d value about 2.9A; probably orientation of Bi2O3·2Al2O3.
c—Effect of Al2O3 on Mon to C transition temperature not determined.
(C) Bi2O3—Ga2O3
a—Isostructural with 1:2 compounds in systems of Bi2O3 with Fe2O3, Al2O3, Mn2O3, according to unpublished work of R. S. Roth.
The two compositions studied indicate that the b.c.c. phase is stable and melts congruently. Beyond this the diagram is conjectural.
(D) Bi2O3—Fe2O3 (Does not obey phase rule.)
a—May represent metastable eutectic between b.c.c. and metastable BiFeO3.
b—Liquidus curve does not show maximum temperature at melting of b.c.c. phase.
The BiFeO3 phase is believed to be metastable because the compound composition can never be made single phase, according to the unpublished work of R. S. Roth.
(E) Bi2O3—Mn2O3 (Note different composition scale.) MnCO3 used as starting material, and mixture ground in alcohol, which tends to give b.c.c.[17].
a—Isostructural with 1:2 compounds in systems of Bi2O3 with Fe2O3, Al2O3, Ga2O3, according to unpublished work of R. S. Roth,
b—Samples at this temperature and below show b.c.c., believed to be metastable, as it disappears at Mon to G inversion (730 °C).
c—Mon Bi2O3 probably stable phase (see b).
(F) Bi2O3—Sb2O3
a—Above about 650 °C oxidation state of the antimony is unknown. Starting with Sb2O5, same phases occur, but solidus appears to be lower (~855 °C).
(G) Bi2O3—Lu2O3
a—Second phase observed, with major d value at 2.95A.
b—As Mon transorms to C, unreacted Lu2O3 transforms to ? phase.
c—Liq+Css cools to metastable tetragonalss.
(H) Bi2O3—Sm2O3
a—Essentially isostructural with Rhss phase in CaO—, SrO—, and BaO — Bi2O3 systems. See table 1 for unit cell dimensions.
b—When cooled to 450 °C shows Rhss+ tetragonal (Tet)ss (metastable).
c—Liq+Css cools to Tetss+Css (both metastable).
d—Liq+Css cools to Tetss (metastable). Single phase Tetss (19:1) reheated to 625 °C transforms first to Css+Rhss, then the Css transforms to the equilibrium Mon phase.
(I) Bi2O3—La2O3
a—Essentially isostructural with Rhss phase in CaO—, SrO —, and BaO — Bi2O3 systems. See table 1 for unit cell dimensions.
b—Cools to Css (metastable)
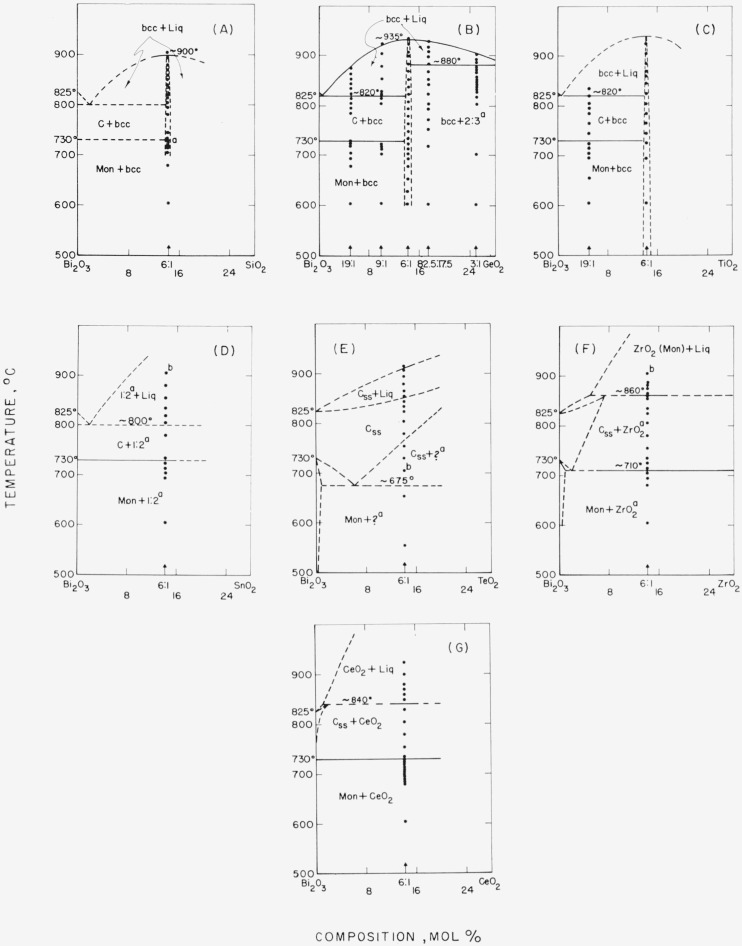
Figure 4. Bi2O3 rich regions of Bi2O3 —RO2 systems, as determined from high-temperature x-ray diffraction data.
Phases: Mon—monoclinic, C—cubic, b.c.c.—body-centered cubic, ?—unknown, ss—solid solution, Liq—liquid
(A) Bi2O3-SiO2
a—Unreacted Mon transforms to C, on heating.
Composition studied shows that the b.c.c. phase (6:1) melts congruently. Beyond this the diagram is conjectural.
(B) Bi2O3–GeO2
a—Unpublished work of C. R. Robbins, NBS.
Compositions studied show that the b.c.c. phase melts congruently, near to but not necessarily at the 6:1 composition.
(C) Bi2O3—TiO2
Compositions studied show that the b.c.c. phase melts congruently, near to but not necessarily at the 6:1 composition.
(D)Bi2O3—SnO2
a—Compound described by R. S. Roth [14].
b—1:2 + Liq cools to 1:2 + Mon + b.c.c. (trace).
(E) Bi2O3–TeO2
Oxidation state of tellurium at high temperature is unknown.
a—Unknown composition, apparently of cubic symmetry.
b—Unit cell dimensions at 700 °C: Css, a=5.63A; ?, a=5.57A
(F) Bi2O3—ZrO2a—ZrO2 does not show in x-ray pattern below solidus.
b—Liq + ZrO2 (Mon) cools to Tet Bi2O3ss.
No b.c.c. found in this system although reported by Aurivillius and Sillén [15].
(G) Bi2O3—CeO2.
No b.c.c. found in this system although reported by Aurivillius and Sillén [15].
Figure 5. Bi2O3 rich regions of Bi2O3—R2O5 systems, as determined from high-temperature x-ray diffraction data.
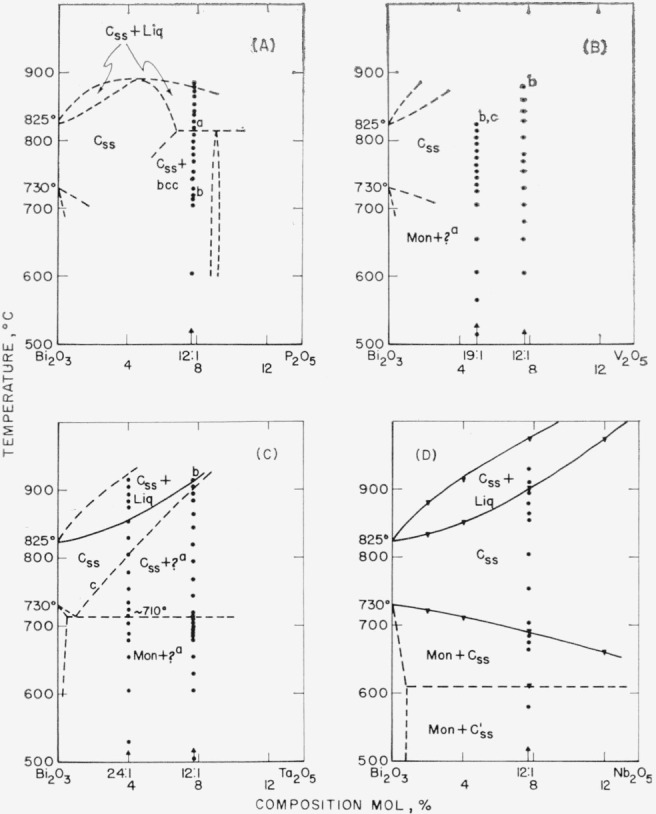
Phases: Mon—monclinic, C—cubic, C′—pseudocubic, b.c.c.—body-centered cubic, ?—unknown, ss—solid solution, Liq—liquid
(A) Bi2O3–P2O5
a—The b.c.c. phase decreases markedly in amount at about 815 °C, but persists in diminishing amounts to about 850 °C. It is possible, therefore, that the true solidus is at 850 °C and (1) a 2-phase region of Css + ? exists between 815 ° and 850 °C or (2) the decomposition temp, of b.c.c. should be raised to 850 °C.
b—The Mon to C transition with the high-temp, x ray occurs at about 720 °C. However, a sample held at 700 °C for 107 hr and slow-cooled does not show Mon. Therefore, the temperature of the Mon to C inversion is in doubt.
(B) Bi2O3—V2O5
A more complete phase diagram could not be postulated because of inconsistencies in the temperatures of transitions and the relative amounts of phases present.
a—b.c.c., if a stable phase; otherwise, unknown phase.
b—Above 815 °, only Css; between 715° and 815 °C, Css + b.c.c.; below 715 °C, phases present depend on previous heat treatment. Stability and approximate composition of b.c.c. could not be ascertained, c—Css cools to b.c.c.
(C) Bi2O3–Ta2O5
a—Apparently cubic symmetry; composition may correspond to C′ phase in Bi2O3—Nb2O5 system [17] (about 4:1).
b—Liq + Css cooled slowly shows only Css at all temps.
c—Because of nonreversibility (see b), this boundary may actually be much lower, as in the Bi2O3—Nb2O5 system (D).
(D) Bi2O3–Nb2O5
▼—Values taken from phase diagram of Roth and Waring [17].
c. Individual Phase Diagrams
In the following section, individual figures and selected diagrams will be discussed. Only two alkali oxide systems, representing extremes in cation radii, were studied (fig. 1). Both Li2O and Rb2O, in the region studied, were simple eutectic types with no solid solutions. It should not be inferred, however, that oxides of the intermediate cations necessarily would behave similarly.
For oxides of the divalent cations (fig. 2) the phase diagrams showed a number of variations, e.g., simple eutectic system (A), congruently melting b.c.c. phase (F), incongruently melting b.c.c. phase (H), C solid solution with liquidus and solidus raised (B), and C solid solution with liquidus and solidus lowered (H).
In the systems with CaO, SrO, and BaO, the rhombohedral solid solution phase described previously [7, 8] was found to be an equilibrium phase. Sillén and Aurivillius had found the phase in samples cooled rapidly from the liquid. The unit cell dimensions at 700 °C for the bismuth oxide-rich compositions of the solid solution phase are given in table 1.
Sillén and Sillén [9] report finding several phases in the Bi2O3-CdO system, one of which might be the unknown phase in the present study of the cadmium oxide system (fig. 2G).
The PbO-Bi2O3 system (fig. 2H) is interesting for several reasons. It varies significantly from the reported phase diagram of Belladen [10, 11]. The latter shows neither the Mon to C transition, nor the solid solution of PbO in Bi2O3, nor the b.c.c. phase at the 6Bi2O3·PbO composition. It is evident from the present diagram that the molal heat of fusion of Bi2O3 calculated by Kelley [12] from the liquidus curve of Belladen’s diagram (6800 cal/mole) is in error. The molal heat of fusion of Bi2O3 was discussed by Levin and McDaniel [4].
With regard to the systems of bismuth oxide with oxides of the trivalent cations, the Bi2O3-B2O3 system (fig. 3A) was reported previously [4], as determined by the quenching technique. However, one composition, 12Bi2O3:B2O3, was used to compare both methods and to show that agreement was satisfactory.
Apparently isostructural 1:2 compounds were found in systems of Bi2O3 with Al2O3 (fig. 3B), Ga2O3 (fig. 3C), and Mn2O3 (fig. 3E). An isostructural 1:2 compound also exists in the Bi2O3–Fe2O3 system; however, the high-temperature x-ray study revealed only a 1:1 compound (fig. 3D). The BiFeO3 phase is believed to be metastable, because according to the unpublished work of R. S. Roth, the compound composition can never be made single phase. It should also be noted that the portion of the diagram to the right of the b.c.c. phase does not obey the phase rule. Royen and Swars [13] who also have studied this system reported two Tet phases of approximately 30:1 and (12–13):1 compositions, a b.c.c. phase of composition 15:1, as well as 2:1 and 1:1 compounds. The present work does not substantiate the 30:1, (12–13) :1, and 2:1 compounds; and the composition of the b.c.c. phase appeared slightly greater than 24Bi2O3 :Fe2O3. As Royen and Swars obtained their compounds from fused mixtures, it is believed that some of them represented metastable states.
The system with the rare earth oxides Sm2O3 (fig. 3H) and La2O3 (fig. 3I), showed the same rhombohedral solid solution phase as was found in the CaO, SrO, and BaO systems (fig. 2B–D). The unit cell dimensions are given in table 1. The phase did not form in the Lu2O3 system (fig. 3G) nor in the MgO system (fig. 2A); consequently, the minimum cationic radius required for formation of this phase lies between that of Lu3+ and Ca2+ or between 0.85 and 0.99A (Ahrens).
In the systems studied with the group IV cations (fig. 4), SiO2 (A), GeO2 (B), and TiO2 (C) showed a congruently melting b.c.c. phase at or near the 6:1 composition. The phase diagrams provide positive proof, for the first time, that the impure b.c.c. phase is a discrete composition and not a solid solution phase of Bi2O3.
The Bi2O3-SnO2 system (fig. 4D) contains a 1:2 compound described by R. S. Roth [14] as having a distorted pyrochlore-type structure.
No b.c.c. phase was found in the ZrO2 and CeO2 systems, although this phase was obtained from fused mixtures by Aurivillius and Sillén [15]. As will be discussed later under the b.c.c. phase, cooling of the liquid or C phases tends to form metastable phases.
In the group V cations (fig. 5), systems with P2O5 (A) and V2O5 (B) showed inconsistencies which could not be reconciled, and these diagrams are most questionable. The systems with Ta2O5 (C) and Nb2O5 (D) are similar, and it is possible that the boundary curve in the Ta2O5 system between (Css+ ?) and Css should descend continuously as in the Nb2O5 system (see b and c in legend to fig. 5C).
Finally, in the Bi2O3–RO3 systems (fig. 6), the three systems studied are similar, including the occurrence of a phase of apparently pseudotetragonal symmetry but of unknown composition. Gattow [16] prepared a mixed oxide 2Bi2O3·MoO3, by precipitation from solution, and studied it by means of x-ray and thermal analysis. Because of insufficient data, however, it was not possible to compare the unknown phase in the present study with Gattow’s.
3.2. Metastable Phases
The results of the high-temperature x-ray experiments were especially informative regarding the occurrence of metastable phases observed at room temperature in samples cooled from higher temperatures. Such information is included in the figure captions. Illustrative examples are as follows:
Liquid cooled to a metastable b.c.c. phase in Bi2O3 systems with Rb2O (see c to caption of fig. IB), NiO (a of fig. 2E), and CdO (b of fig. 2G).
Cubic or cubic solid solution cooled to a metastable b.c.c. phase in systems with NiO (c of fig. 2E) and V2O5 (c of fig. 5B).
Liquid+cubic solid solution cooled to metastable cubic solid solution in systems with La2O3 (b of fig. 3I), Ta2O5 (b of fig. 5C), and Nb2O5 [17].
Liquid+cubic solid solution also cooled to metastable Tet in systems with Lu2O3 (c of fig. 3G), Sm2O3 (b and d of fig. 3H), and Nb2O5 [17].
In the zirconia system, liquid+ZrO2 cooled to metastable tetragonal.
It is emphasized that an exhaustive study of the formation of metastable phases was not attempted. In general, only one cooling cycle for a limited number of compositions was studied in each system. It is apparent, however, from the frequency and diversity of the matastable phases found, that phases obtained by the cooling of fused mixtures or of high-temperature forms may well represent nonequilibrium states at all temperatures. It is not surprising, therefore, that previous investigators [1, 2, 13, 15] studying fused samples of unknown compositions obtained various impurity phases. Many of these are metastable phases and have no place in the equilibrium diagrams.
3.3. Body-Centered Cubic Phase
Table 2 gives the unit cell dimensions for the stable and metastable b.c.c. phases of bismuth oxide found in this study. The unit cell dimensions were obtained at room temperature; and except for Rb2O and Bi2O3 (see footnotes d and e, respectively) the samples were heated in sealed platinum tubes according to the schedule given in the column under “Final Heat Treatment”. As observed from the x-ray diffraction patterns, most of the compositions studied were not single phase but showed a second phase.
Table 2.
Unit cell dimensions of body-centered cubic phases formed by small additions of oxides to Bi2O3
| Stable phases
| ||||||
|---|---|---|---|---|---|---|
| Oxide addition | Starting composition | Final heat treatment | Additional phases present | Ionic radius of cation (Ahrens) | Levin and Roth | Aurivilliusa and Sillen [15] |
|
|
|
|
|
|
|
|
| ° C/hr | A | A | Aa | |||
| ZnO | 6Bi2O3:ZnO | 700°/107 | Trace ZnO | 0.74 | 10.201 | |
| PbO | 6Bi2O3:PbO | 725°/1 | None | 1.20 | 10.258 | 10.25b |
| B2O3 | 12Bi2O3:B2O3 | 600°/65 | Trace Bi2O3+ trace 2:1 | 0.23 | 10.124 | |
| Al2O3 | 12Bi2O3: Al2O3 | 700°/107 | Trace Bi2O3·2Al2O3 | .51 | 10.169 | 10.16 |
| Ga2O3 | 12Bi2O3: Ga2O3 | 700°/107 | Trace Bi2O3·2Ga2O3 | .62 | 10.176 | |
| Fe2O3 | 19Bi2O3:Fe2O3c | 700°/3 | Trace BiFeO3 | .64 | 10.183 | 10.18 |
| Tl2O3 | .95 | 10.17 | ||||
| SiO2 | 6Bi2O3:SiO2 | 700°/107 | Small amt. Bi2O3 | .42 | 10.104 | 10.10 |
| GeO2 | 6Bi2O3: GeO2 | 700°/107 | Trace GeO2 | .53 | 10.143 | |
| TiO2 | 6Bi2O3:TiO2 | 700°/107 | None | .68 | 10.176 | |
| P2O5 | 12Bi2O3:P2O5 | 700°/107 | Trace? | .35 | 10.164 | |
|
| ||||||
| Metastable phases | ||||||
|
| ||||||
| Rb2O | 12Bi2O3: Rb2O | 795°/0.1d | Trace Bi2O3 | 1.47 | 10.22 | |
| NiO | Bi2O3:NiOc | 785°/1 | NiO | 0.69 | 10.227 | |
| MnO | Bi2O3:MnOc | 735°/1 | Moderate amt. Bi2O3·2Mn2O3 | .80 | 10.221 | |
| CdO | 6Bi2O3:CdO | 700°/107 | Trace CdO | .97 | 10.225 | |
| Bi2O3 | Bi2O3 | 780°/0.1e | Small amt. Mon Bi2O3 | 1.20f | 10.268 | 10.264g |
| ZrO2 | 0.79 | 10.23 | ||||
| CeO2 | .94 | 10.22 | ||||
| V2O5 | 12Bi2O3: V2O5 | 700°/107 | Small amt. Tet. Bi2O3 ss | .59 | 10.210 | |
| Nb2O5 | 6Bi2O3:Nb2O5c | 700°/3 | Moderate amt. cubic (C′ [17]) | .69 | 10.19 | |
| Nb2O5 | 24Bi2O3: Nb2O5 c | 700°/3 | Trace cubic (C′ [17]) | .69 | 10.263 | |
Converted from kx units.
Cation is tetravalent according to Aurivillius and Sillen [15].
Starting materials ground together in alcohol.
Sample cooled from liq. in high-temp., x-ray furnace.
Slow-cooled in high-temp., x-ray furnace.
Ahrens gives 0.96Å, which is low. See [4].
Agrees with value obtained by Schumb & Rittner [2].
Concerning the systems with a stable b.c.c. phase, it is seen that an exact 12Bi to 1Me atom ratio was not substantiated in most cases. Except for PbO and B2O3, systems with divalent and trivalent cations would show single phase b.c.c. at ratios of Bi to Me greater than 12:1. Systems with the tetravalent ions Si4+, Ge4+, and Ti4+ approached most closely the ideal ratio of 12Bi: 1Me, proposed by Sillén [1]. This conclusion is more apparent from figure 4A,B,C, where the b.c.c. phase in these systems is seen to melt congruently at a temperature about 100 °C above the melting point of Bi2O3. With the oxide of the pentavalent cation, P5+, the single phase b.c.c. composition appears to be less than 12Bi:1Me (fig. 5A). It can be seen from table 2 that within each valence group increased ionic radius of the cation is associated with increased unit cell dimensions of the b.c.c. phase. Unit cell dimensions versus ionic radius for all of the cations are plotted in figure 7. The general correlation between the two for the stable phases (solid points) is seen to be good, although not linear.
Figure 7. Unit cell dimensions versus ionic radius for impure body-centered cubic phases of Bi2O3.
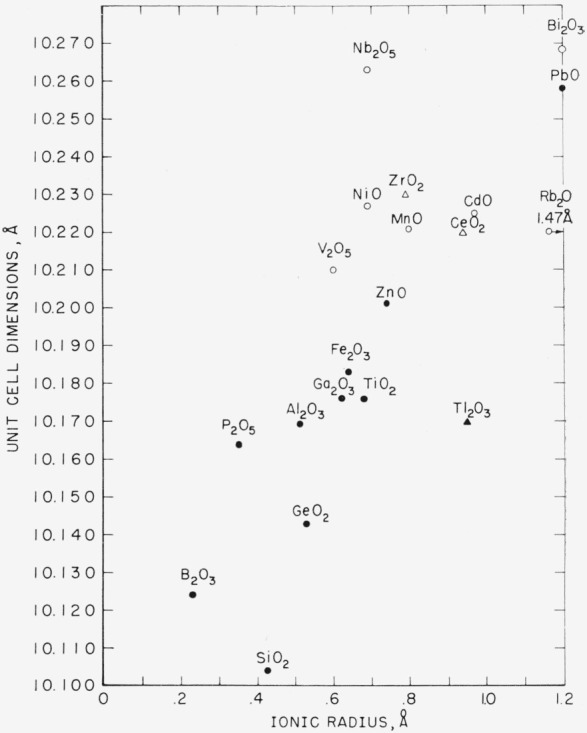
Oxides shown in the figure refer to the impurity additions. See figures 2 through 5 for approximate compositions of the phases.
●—equilibrium phases
○—metastable phases
▲, △—unit cell dimensions after Aurivillius and Sillén [15].
An interesting and surprising finding is that oxides of cations so diverse in ionic radius, oxygen coordination number, and polarizability as Zn2+, B3+, Ti4+, and Pb2+ can form with bismuth oxide a discrete phase of the same symmetry. An appealing explanation is the concept of a clathrate- or cage-type structure, in which as postulated by Sillén [1] for Si2Bi24O40, central Si atoms are surrounded by spheres of Bi12O20 atoms. For the case of a central ion with valence different from 4, charge balance would be achieved through cation or oxygen adjustments.
Regarding the metastable b.c.c. phase, the monovalent ion Rb+ formed the phase on cooling in the high temperature x-ray experiments. The compositions containing NiO, MnO, and Nb2O5, which in the process of preparation were ground in alcohol, also formed the b.c.c. phase, metastably. These results would seem to support the conclusion that an impure b.c.c. phase of Bi2O3 might be formed (metastably) with most cations, under the proper conditions of composition, grinding, and heating schedules.
It is seen from figure 7 that with the exception of PbO the unit cell dimensions of the metastable phases are larger than those of the stable phases. The cell dimensions of the metastable impure phases, also, are less than those for the b.c.c. metastable phase of pure Bi2O3. Therefore, the compositions of the impure metastable phases cannot be that of pure Bi2O3. However, contrary to the case of the stable b.c.c. phases, no correlation exists between unit cell dimensions and ionic radius for the metastable b.c.c. phases. The x-ray diffraction patterns of the b.c.c. phases of the stable and metastable impurity forms are similar in d spacings and intensities to the pattern for pure Bi2O3. It is a reasonable assumption that the structures are similar.
To summarize (see fig. 7), the b.c.c. phase of pure Bi2O3 has the largest unit cell dimensions, and the addition of a foreign ion to Bi2O3 tends to decrease the dimensions. This decrease is least for the larger ions, which tend to form the metastable b.c.c. phase. The decrease in cell dimensions is greatest for the smaller ions, which tend to form the stable b.c.c. phase. Whereas the stable b.c.c. phases show correlation with ionic radius, the metastable phases do not. These findings are compatible with a cage-type structure in which a central cation, including Bi, is surrounded by a sphere of atoms of approximately Bi12O20 composition.
4. Summary
The important phase equilibria relationships for the bismuth-rich portions of the phase diagrams are shown schematically in figure 8. Elements in boldfaced type refer to the respective oxide mixtures studied. Elements enclosed in heavy outlines represent oxides which formed the stable b.c.c. phase with bismuth oxide. Composition of the b.c.c. phase was found to be variable for different systems, but most nearly approached the ideal 12Bi:1Me ratio for oxides of the tetravalent ions Si4+, Ti4+, and Ge4+. Designations in the upper right-hand corners of the boxes for the stable b.c.c. phases refer to the nature of melting, e.g., congruent, incongruent, or decomposition. Oxides of elements which formed the metastable b.c.c. phase are indicated by an M in the upper right-hand corner of the box, and those that formed the rhombohedral solid solution phase, by Rh. The nature of the liquidus curves is indicated by a designation in the lower right-hand corner of each box, as follows: E, simple eutectic; ssr, solid solution type with liquidus and solidus raised; ssL, solid solution type with liquidus and solidus lowered.
Figure 8. Summary of some phase equilibria data on the effect of oxide additions to Bi2O3. Elements shown in boldfaced type on the Periodic Table refer to oxide additions.
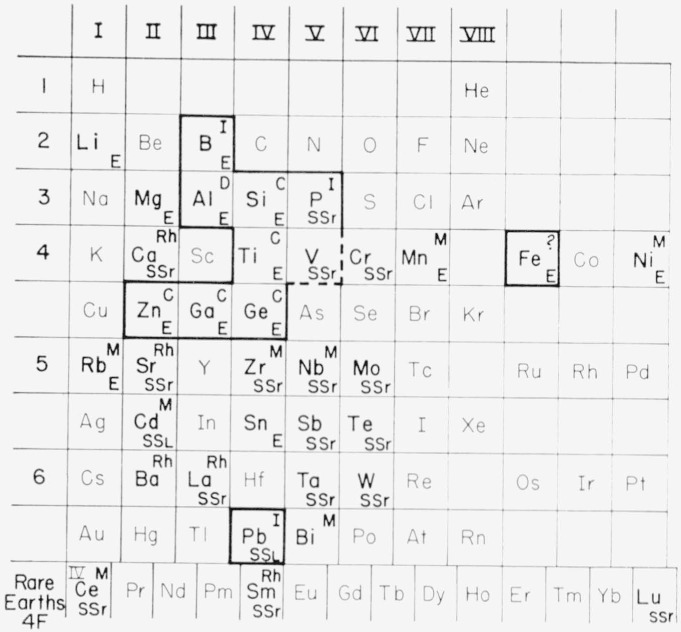
Elements enclosed in heavy outlines represent oxides which form stable body- centered cubic phases with bismuth oxide:
C—congruently melting
I—incongruently melting
D—decomposes
M—metastable body-centered cubic phase
E—eutectic-type system
SSr—solid solution of oxide in Bi2O3, with solidus and liquidus raised
SSL—solid solution, with solidus and liquidus lowered
Acknowledgments
The authors acknowledge their sincere appreciation to Robert Friedman, who as a guest worker, summer 1961, from the University of Chicago, prepared the compositions and obtained some of the unit cell dimensions.
Footnotes
Figures in brackets indicate the literature references at the end of this paper.
5. References
- 1.Sillén LG. Arkiv fr Kemi. Mineral Geol. 1937;12A(18):1–13. [Google Scholar]
- 2.Schumb WC, Rittner ES. J Am Chem Soc. 1943;65:1055–1060. [Google Scholar]
- 3.Gattow G, Schröder H. Z anorg u allgem Chem. 1962;318(3–4):176–189. [Google Scholar]
- 4.Levin EM, McDaniel CL. J Am Ceram Soc. 1962;45(8):355–360. [Google Scholar]
- 5.Levin EM, Robbins CR, Waring JL. J Am Ceram Soc. 1961;44(2):87–91. [Google Scholar]
- 6.Levin EM, Mailer FA. J Am Ceram Soc. 1963;46(1):59–60. [Google Scholar]
- 7.Aurivillius B. Arkiv Kemi. Mineral Geol. 1943;16A(17):1–13. [Google Scholar]
- 8.Sillén LG, Aurivillius B. Z Krist. 1939;101:483–495. [Google Scholar]
- 9.Sillén LG, Sillén B. Z Phys Chem. 1944;B49:27–33. [Google Scholar]
- 10.Belladen L. Gazz chim ital. 1922;5211:160–164. [Google Scholar]
- 11.Levin EM, McMurdie HF, Hall FP. Phase Diagrams for Ceramists. The American Ceramic Soc, Inc. 1956:58. fig. 97. [Google Scholar]
- 12.Kelley KK. Bur US Mines Bull. 1936;(393):166. 26. [Google Scholar]; Ceram Absts. 1937;16(5):162. [Google Scholar]
- 13.Royen P, Swars K. Angew Chem. 1957;69779(24) [Google Scholar]
- 14.Roth RS. J Research NBS. 1956;56(1):17–25. RP 2643. [Google Scholar]
- 15.Aurivillius B, Sillén LG. Nature. 1945;155(3932):305–306. [Google Scholar]
- 16.Gattow G. Z anorg Chem. 1959;298:65–71. [Google Scholar]
- 17.Roth RS, Waring JL. J Research NBS. 1962;66A(6):451–463. [Google Scholar]


