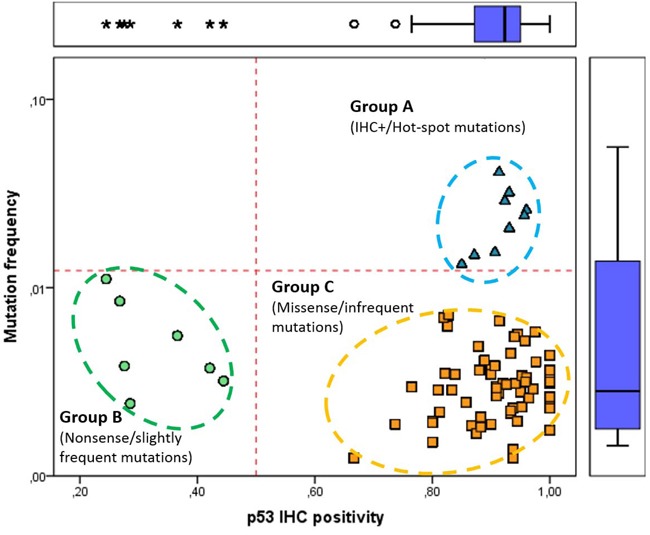
Figure 1. Classification of TP53 somatic mutations based on frequency and IHC positivity in IARC TP53 Database.

Somatic TP53 alterations were categorized into three groups: ‘hot spot’ mutations (marked with blue triangle) are frequent in Group A (mutation frequency ≥ 0.013 and IHC positivity ≥ 0.85); common nonsense mutations (blue circles) are in Group B (mutation frequency ≤ 0.011 and IHC positivity ≤ 0.44); less frequent and mostly positive missense mutations (yellow square) fall into Group C (mutation frequency ≤ 0.072 and IHC positivity ≥ 0.74). Each data point represents distinct TP53 mutations and only individual mutations with 15 or more IHC results were considered.
