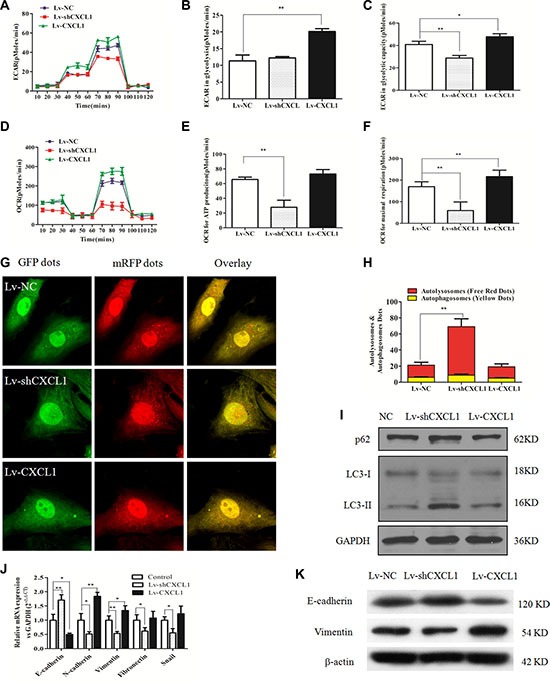
Figure 4. The effect of CXCL1 on mitochondrial respiration, autophagy and epithelial-mesenchymal transition (EMT).

(A) ECAR curves in the Lv-CXCL1, Lv-shCXCL1, and NC groups. (B, C) Upregulating CXCL1 increased the level of glycolysis under normal conditions and the glycolytic capacity, while downregulating CXCL1 reduced the glycolytic capacity. (D) OCR curves in the Lv-CXCL1, Lv-shCXCL1, and NC groups. (E, F) CXCL1 enhanced the maximal respiration capacity, but not the level of ATP consumption under normal conditions, while inhibition of CXCL1 decreased both. (G, H) MRFP-GFP tandem fluorescent-tagged LC3 was employed to detect the effects of CXCL1 expression on autophagic flux under confocal microscopy. Yellow puncta represent autophagosomes, while red puncta represented autolysosomes. Decreasing CXCL1 expression induced more autophagic flux (**P < 0.01, one-way ANOVA) while no significant change was noted with increased CXCL1 expression. (I) Decreasing CXCL1 expression increased P62 levels and the ratio of LC3 II/LC3 I protein. (J, K) CXCL1 induced activation of the EMT pathway, while reducing CXCL1 suppressed this process as demonstrated by immunoblotting and qPCR. Three independent assays were performed (mean ± SD). *P < 0.05, **P < 0.01.
