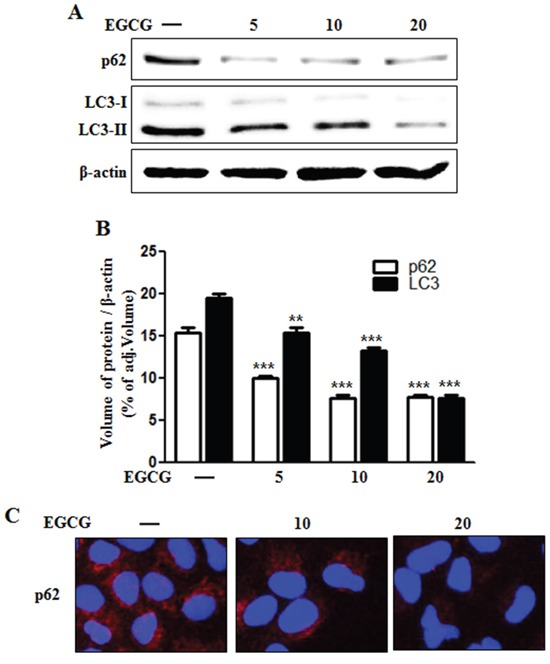
Figure 3. EGCG stimulated autophagy flux.

A. HCT116 cells were treated with EGCG at 5-20 μM for 12 h and subjected to western blot analysis for p62, LC3-I, and LC3-II proteins. β-actin was used as loading control; B. Bar graph indicating the averages of p62 and LC3-II protein levels. C. Representative images of p62 protein in HCT116 cells. **p < 0.01, *** p < 0.001: Significant differences between the control group and treatment group.
