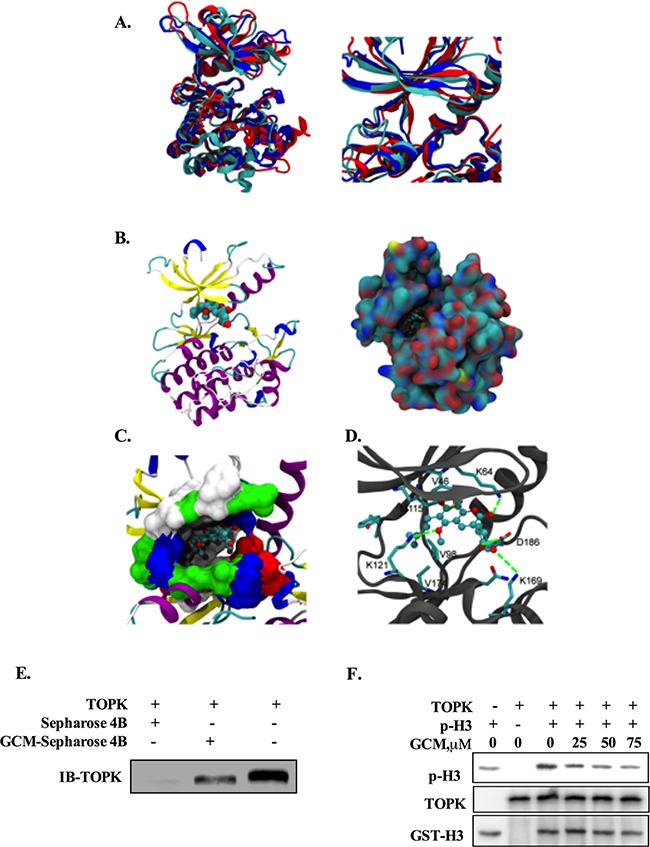
Figure 4. TOPK is a direct target of GCM.

A. Three predicted structures of the full-length TOPK (left) and their ATP-binding sites (right). B. The docking model of GCM / TOPK complex structure. GCM is shown in sphere representation (carbons are colored by cyan. TOPK is shown as a cartoon model, left) and in surface representation of TOPK (the location of GCM is shown in ball-stick, right). C. Binding site of TOPK with GCM. The ATP-binding site of TOPK is shown in surface representation (white: hydrophobic residues, blue: residues with positive charge, red: residues with negative charge, green: other polar residues). GCM is shown in ball-stick representation. D. The detailed Interaction between TOPK and GCM. Carbons on TOPK are colored grey. GCM is shown in ball-stick representation and key residues on TOPK are shown in stick representation. Carbons, oxygen, nitrogen and sulfur atoms are colored cyan, red, blue and yellow respectively. E. GCM binds directly to TOPK. Sepharose 4B was used for binding and pull-down assay. Lane 1, the negative control, indicating no binding between TOPK and beads alone; Lane 2, TOPK binds to GCM-Sepharose 4B beads; lane 3, input control. F. GCM inhibited TOPK activity in vitro in a dose dependent manner. An inactive GST-Histine H3 protein was used as the substrate with active TOPK and the p-histone H3 was measured by western blotting.
