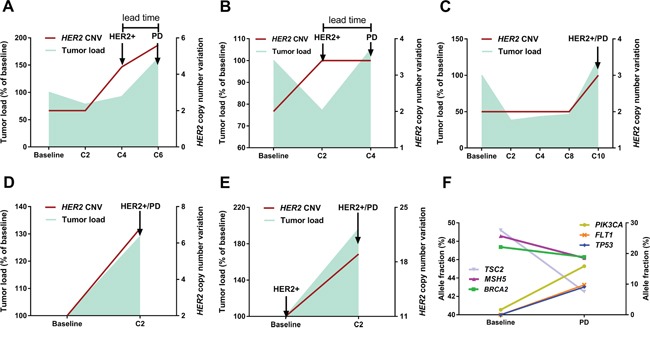
Figure 1. Serial monitoring of genomic alterations in ctDNA.

(panel A, patient No.3) A typical case illustrates the relationship between fluctuation patterns of HER2 copy number (right Y axis) and dynamics of tumor load (left Y axis). Notably, HER2 amplification in ctDNA was identified 8 weeks earlier than the clinical establishment of disease progression by CT. (panel B, patient No.2) The tumor load moderately decreased after C2 whereas HER2 copy number was elevated, which was followed by immediate disease progression after C4. (panel C, patient No.17; panel D, patient No.5; panel E, patient No.8) Notable increase in HER2 copy number and tumor burden was concurrently detected, regardless of HER2 status at baseline. (panel F, patient No.5) Dynamic ctDNA profiling revealed intra-tumor heterogeneity and clonal evolution, as evidenced by the diverging patterns of fluctuation in identified mutations. The left Y axis refers to the allele fractions of mutations in genes TSC2/MSH5/BRAC2 and the right Y axis to genes PIK3CA/FLT1/TP53.
