Abstract
Ultrasensitive mediator-free electrochemical detection for biomarker proteins was achieved at low cost using a novel composite of Fe3O4 nanoparticles loaded onto graphene oxide (GO) nanosheets (Fe3O4@GO). This paramagnetic Fe3O4@GO composite (1 μm size range) was decorated with antibodies against prostate specific antigen (PSA) and prostate specific membrane antigen (PSMA), and then used to first capture these biomarkers and then deliver them to an 8-sensor detection chamber of a microfluidic immunoarray. Screen-printed carbon sensors coated with electrochemically reduced graphene oxide (ERGO) and a second set of antibodies selectively capture the biomarker-laden Fe3O4@GO particles, which subsequently catalyze hydrogen peroxide reduction to detect PSA and PSMA. Accuracy was confirmed by good correlation between patient serum assays and enzyme-linked immunosorbent assays (ELISA). Excellent detection limits (LOD) of 15 fg/mL for PSA and 4.8 fg/mL for PSMA were achieved in serum. The LOD for PSA was 1000-fold better than the only previous report of PSA detection using Fe3O4. Dynamic ranges were easily tunable for concentration ranges encountered in serum samples by adjusting the Fe3O4@GO Concentration. Reagent cost was only $0.85 for a single 2-protein assay.
Keywords: Iron oxide, Magnetic, Graphene, Biomarker proteins, Immunoarray, Microfluidics
1. Introduction
Accurate, sensitive, cost-effective measurements of multiple proteins in patient samples are critical for progress in clinical detection and monitoring of cancer (Kulasingam and Diamandis, 2008; de Gramont et al., 2015). Recent advances in nanomaterials-assisted assays by ourselves (Rusling et al., 2014) and others (Zhang et al., 2013; Meissner et al., 2015; Das and Kelley, 2011; Kelley et al., 2014; Lam et al., 2013) have improved multiplexed protein sensitivity up to 1000-fold compared to earlier established commercial assays. However, cost and assay complexity still raise barriers to translation of effective protein-based cancer diagnostics into widespread clinical and point-of-care (POC) use (Rusling, 2013).
Enzyme-linked immunosorbent assays [ELISA] have long been the gold standard for clinical protein determinations, and typically achieve detection limits of 1–10 pg/mL for serum proteins (Lequin, 2005). ELISA employs enzyme labels attached to detection antibodies that have been pre-captured on an antibody-decorated well plate to measure proteins using optical detection of a colored enzyme reaction product. Many variations on this “sandwich assay” format, often utilizing magnetic beads, have been used in more modern, multiplexed commercial protein detection kits (Zhang et al., 2013; Rusling et al., 2014; Dixit et al., 2016). In our recent work, magnetic beads loaded with massive numbers of horseradish peroxidase (HRP) labels and detection antibodies were used to achieve ultrasensitive multiplexed protein detection at levels as low as 5 fg/mL (Otieno et al., 2014; Krause et al., 2013).
Iron oxide (Fe3O4) nanoparticles have peroxidase-like activity for catalysis of hydrogen peroxide (H2O2) reduction, which can be optically monitored by following the H2O2–assisted oxidation of 3,3′,5,5′-tetramethylbenzidine (TMB) or o-phenylendiamine (OPD) (Zhang et al., 2008; Chang et al., 2009; Liu et al., 2014; Wei and Wang, 2008). Peroxidase-like activity of Fe3O4 nanoparticles for electrochemical detection of hydrogen peroxide has been enhanced by incorporation with other materials like platinum (Ma et al., 2013), graphene derivatives (Fang et al., 2014; Liu et al., 2011; Yang et al., 2014), platinum/palladium (Sun et al., 2012), and gold (Sun et al., 2013). Chitosan coated Fe3O4 nanoparticles were used in colorimetric ELISA to detect of carcinoembryonic antigen with 1 ng/mL LOD (Gao et al., 2008) and thrombin with LOD of 1 nM (Zhang et al., 2010). Dumbbell-like gold-Fe3O4 was used for electrochemical detection of prostate specific antigen (PSA) with 5 pg/mL LOD and dynamic range of 0.01–10 ng/mL (Wei et al., 2010).
Loading Fe3O4 nanoparticles onto graphene oxide (GO) nanosheets improved wettability and dispersion of the composite material (Dong et al., 2012; Wu et al., 2013). Fe3O4 loaded on GO was previously synthesized and utilized for removal of cobalt (Liu et al., 2011), hydrocarbons (Han et al., 2012) and organic dyes (Jiao et al., 2015) from environmental samples. Electrostatic interactions between negatively charged graphene oxide sheets and Fe3O4 nanoparticles coated with positively charged poly(diallydimethylammonium chloride) (PDDA) were used to assemble core-shell Fe3O4@GO particles (Wei et al., 2012).
In this paper, we describe the first preparation and use of multiple-Fe3O4 nanoparticles assembled onto graphene oxide nanosheets and decorated with antibodies (Ab2) to first isolate biomarker proteins from the sample under magnetic control, and then electrochemically detect them at ultra-high sensitivity using the intrinsic peroxidase activity. Electrostatic interactions between intact GO sheets and PDDA-coated Fe3O4 nanoparticles (NP) provide precise control over the number of Fe3O4 NPs per GO sheet, and can be used to optimize the dynamic range of the assay. Here, Ab2-Fe3O4@GO particles were evaluated as substitutes for HRP-Ab2-magnetic beads (MB) (1 μm diam.) in an 8-sensor microfluidic system featuring off-line capture of PSA and prostate specific membrane antigen (PSMA) on magnetic particles, followed by delivery of these analyte protein-laden particles to an amperometric detection chamber featuring 8-sensors decorated with capture antibodies (Ab1). Using this approach, we achieved low cost ultrasensitive detection of PSA and PSMA simultaneously with tunable dynamic range.
2. Materials and methods
2.1. Synthesis of Fe3O4@GO
(See SI file for Chemicals and Materials, and full experimental details). Fe3O4 nanoparticles were synthesized by a solvo-thermal method (Deng et al., 2005) (see SI), Graphene Oxide (GO) was prepared using a modified Hummer’s method (SI) (Kim et al., 2014; Hummers and Offeman, 1958). Briefly, 50 mg of Fe3O4 nanoparticles were sonicated 5 min with 10 mL 0.1 mg/mL poly(diallydimethylammonium chloride) (PDDA) in water, magnetically separated, washed 3x with water, and re-suspended in 25 mL water. GO (50 mg) was sonicated in 25 mL water for 30 min after which the dispersion of PDDA-coated Fe3O4 nanoparticles was added dropwise with stirring 1 h (Wei et al., 2012). Fe3O4@GO composites were then magnetically separated, washed 3× with water, and dried overnight at 55 °C under vacuum. The Fe3O4@GO composite was suspended in water at the concentration required for each assay. ELISA kits used were Sigma Aldrich RAB0331 for PSA and Lifeome Biolabs/Cusabio EL008782HU-96 for PSMA.
2.2. Electrode preparation
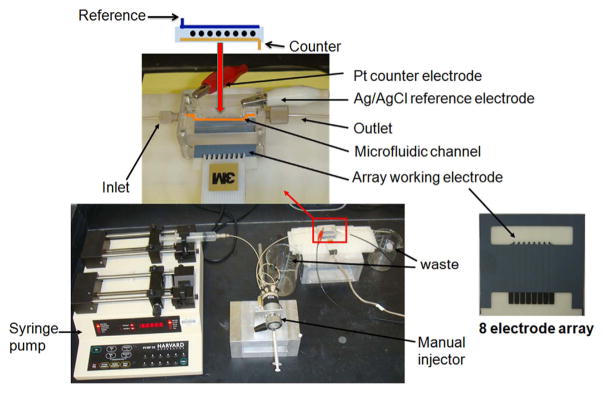
Electrochemically reduced graphene oxide (ERGO) was electrophoretically-deposited on the surface of 8-sensor screen-printed carbon arrays (Kanichi Research) from a dispersion of GO (4 mg/mL) in 0.1 M LiClO4 at −1.2 V for 60 s, then further reduced in 0.5 M LiClO4 for 60 s to increase conductivity and surface area. The ERGO-coated sensors were then washed 5× with water and dried under nitrogen (Sheng et al., 2012). Antibodies were attached to these sensors through both adsorption and amidization after treating with 1-(3-(Dimethylamino)propyl)-3-ethylcarbodiimide hydrochloride (EDC)/ N-hydroxysulfosuccinimide (NHSS) to activate ERGO carboxylate groups, then washing with water and incubating overnight with capture antibodies (Ab1) at 4 °C. Arrays were then washed with phosphate buffer (PBS) (pH 7.4) with 0.05% Tween 20 (PBS-T20) and incubated 1 h with 2% bovine serum albumin (BSA) in phosphate buffer (pH 7.4) to minimize nonspecific binding. They were then washed again with PBS-T20 and inserted into the detection chamber of a microfluidic immunoarray that was previously described (Malhotra et al., 2012) (Fig. 1 and Fig. S1, SI File) for protein detection. The detection chamber consists of a PDMS channel between two PMMA plates equipped with symmetrically placed reference Ag/AgCl electrode and counter Pt electrode. The chamber has an outlet and inlet connected to an injector and a syringe pump (Fig. 1).
Fig. 1.
Illustration of microfluidic immunoarray with an injector used to deliver captured protein on Ab2@Fe3O4@GO into a detection chamber equipped with Ag/AgCl reference electrode, Pt counter electrode and housing an 8 electrode ERGO-coated sensor array (Kanichi®) connected to 8 an channel multi-potentiostat (see Malhotra et al. (2012)).
2.3. Offline analyte protein capture
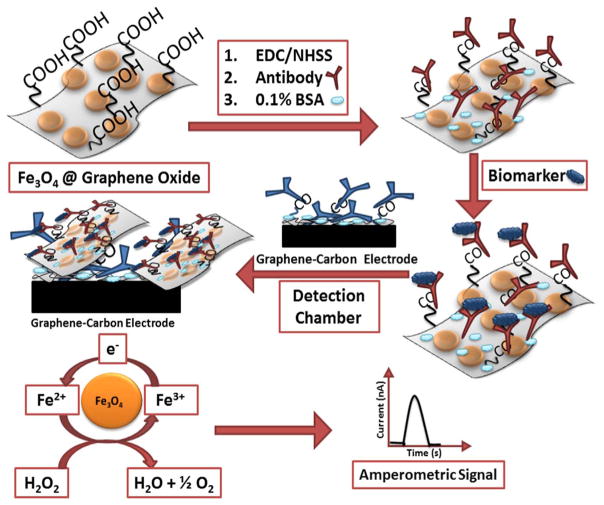
The Fe3O4@GO composite was reacted with EDC/NHSS by stirring for 10 min to activate carboxylic groups on the GO, then reacted with antibodies (Ab2) by incubation overnight at 4 °C to form Ab2@Fe3O4@ GO conjugates. Ab2@Fe3O4@GO conjugates were magnetically separated, washed 2× with 0.1% BSA, then incubated for 1 h with 0.1% BSA to minimize nonspecific binding. Protein biomarkers (antigen, Ag) were captured from samples by mixing with Ab2@Fe3O4@GO conjugates while stirring for 30 min (Malhotra et al., 2012). Ab2@Fe3O4@ GO with captured analyte proteins were then magnetically separated, washed with 0.1% BSA and dispersed in 120 μL 0.1% BSA. These Ab2@ Fe3O4@GO-protein conjugates were delivered to the detection chamber through an injector equipped with a 100 μL sample loop. Once the particles filled the reaction chamber as monitored by the black color of the conjugates, the flow was stopped and the array was incubated for 30 min to enable Ab2@Fe3O4@GO-protein capture on the Ab1-decorated sensors. Then, sensors were washed with PBS-T20 for 4 min at 100 μL/min to remove unbound species (Scheme 1).
Scheme 1.
Protein capture and detection mediated by Fe3O4@GO sheets. Proteins captured by Fe3O4@GO decorated with detection antibodies. Composite with biomarker was then captured on the sensor surfaces coated with graphene and capture antibodies. Amperometric signal was generated by injecting 100 μL 5 mM H2O2.
2.4. Protein measurements
Amperometric signals were generated by injecting 100 μL of 5 mM H2O2 in PBS at a flow rate of 100 μL/min and applying −0.3 V vs. Ag/AgCl (0.14 M NaCl). Amounts of Fe3O4@GO on the sensors depend on concentrations of captured biomarker proteins. To mimic human serum, undiluted calf serum was used to prepare protein standards.
3. Results and discussion
3.1. Characterization of Fe3O4@GO
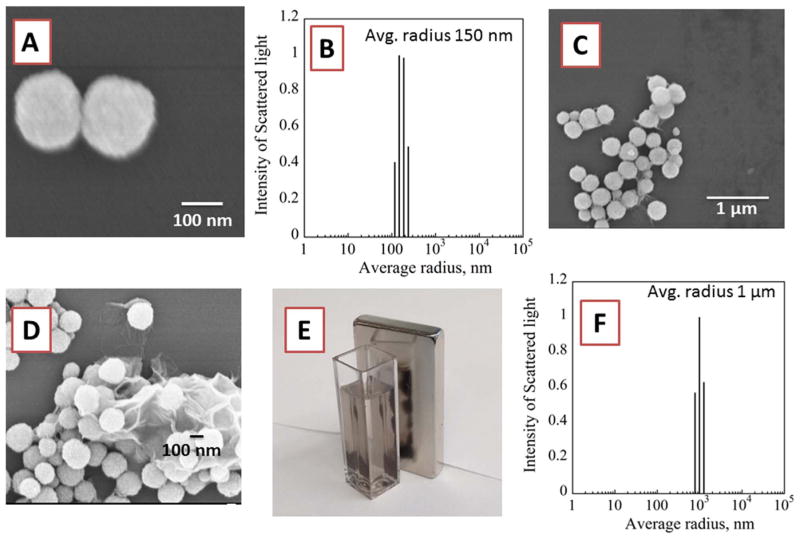
Dynamic light scattering (DLS) and scanning electron microscopy (SEM) images of Fe3O4 nanoparticles revealed average diameters of 300 (± 15) nm (Fig. 2A,B). Zeta potential measurements showed that Fe3O4 nanoparticles had surface charge −11 (± 4) mV. The surface charge changed to +65 (± 6) mV after coating Fe3O4 nanoparticles with polycationic PDDA. GO sheets exhibited an average size of 900 (± 40) nm and surface charge of −79 ± 7 mV. The negative surface charge of GO is due to oxygen-containing surface groups, e.g. carboxylate, epoxy, and hydroxyl (Loh et al., 2010).
Fig. 2.
Morphology of Fe3O4 nanoparticles: (A) SEM image showing two Fe3O4 nanoparticles and (B) DLS of Fe3O4 nanoparticles with average diameter 300 nm. (C & D) SEM Images of Fe3O4 on surface of GO sheets showing morphology of Fe3O4@GO, (E) Magnetic attraction of Fe3O4@GO nanoparticles in the cuvette to the magnet on the right (F) DLS of Fe3O4@GO composite.
When positively charged PDDA-coated Fe3O4 nanoparticles were mixed with negatively charged GO sheets, a composite of Fe3O4 nanoparticles bound to the surface of GO sheets (Fe3O4@GO) formed through electrostatic interactions with a final surface charge of −42 (± 3). The Fe3O4@GO composite was readily dispersed in aqueous solution and then separated in 30 s using a magnet to isolate the particles (Fig. 2E). The Fe3O4@GO composites had irregular shapes with an average size dimension of ~1.0 μm as seen in SEM images (Fig. 2C,D,F).
Peroxidase-like activity of Fe3O4@GO for hydrogen peroxide reduction was demonstrated by measuring the rate of oxidation of 2,2′-Azino-bis(3-ethylbenzothiazoline-6-sulfonic acid) diammonium salt (ABTS) (Biochemica, 1987). In this standard assay the change in absorbance at 592 nm corresponds to the catalytic oxidation of ABTS in the presence of H2O2 to a colored product. Measured catalytic activity was 260 units per mg Fe3O4@GO, equivalent to catalytic activity of 0.312 mg of pure HRP enzyme (SI file, page S6).
For voltammetry, the negatively charged Fe3O4@GO composites, (0.1 mg/mL) were attached to screen-printed carbon electrodes in the array through alternating electrostatic layer-by-layer (LBL) assembly (Rusling, et al., 2014) using aqueous 2 mg/mL PDDA solution as the alternate-layer polycation. After washing, cyclic and square wave voltammograms (CV, SWV) of PDDA/Fe3O4@GO electrodes in 0.1 M PBS buffer showed a large increase in peak current when the concentration of H2O2 was increased compared to a bare electrode (Fig. S2, SI file). Catalytic peak current of the Fe3O4@GO electrode gave a good linear correlation with increasing H2O2 concentration for CV and SWV peak currents (Fig. S2, SI). These results confirmed the high catalytic activity of Fe3O4@GO for the reduction of H2O2, and the ability of this material to serve as a label in electrochemical detection.
A bicinchoninic acid (BCA) total protein assay was used estimate the amount of antibodies loaded on Fe3O4@GO (Noble and Bailey, 2009). Loading capacity was found to be 1.52 μg of proteins per 1 mg Fe3O4@GO which represents around 2.25×10¹² antibodies /mg Fe3O4@GO (Fig S5, SI file).
Electrical conductivity of the Fe3O4@GO as well as GO and Fe3O4 films were measured using the standard four-probe method (Smits, 1958). Conductivities were 52 (± 11) S/cm for GO, 4.0×10⁻³ (± 7.0×10⁻⁴) S/cm for Fe3O4 films, and 17 (± 2) S/cm for Fe3O4@GO.
3.2. Sensor characterization
Array sensor surface areas before and after coating with ERGO were estimated by CV using the Randles-Sevcik equation (Bard and Faulkner, 2000) with 1 mM ruthenium hexamine chloride as a redox probe in 0.1 M KCl. Surface area of the screen printed carbon electrode was 9.7 ± 0.1×10⁻⁴ cm2 and increased to 2.0 ± 0.1×10⁻³ cm2 after depositing ERGO (Fig. S3, SI file). The increase in electrochemical active surface area is due to the increased roughness of the surface after deposition of ERGO (Fig. S4, SI File).
3.3. Optimization
Analytes chosen to demonstrate system performance (PSA and PMSA) in serum are overexpressed in prostate cancers. PSA is an intercellular glycoprotein (34 kDa kallikrein-like protease) that is locally synthesized in prostatic tissue (Stamey et al., 1995) PSA levels higher than 4 ng/mL or rising levels with time are indicatives of prostate cancer (Smith et al., 2005). PSMA is a cell-surface glycoprotein (O’Keefe et al., 1998) with average plasma levels in males above 50 at 360 ng/mL and 275 ng/mL in males younger than 50. Plasma levels can increase above 600 ng/mL in prostate cancer patients (Xiao et al., 2001).
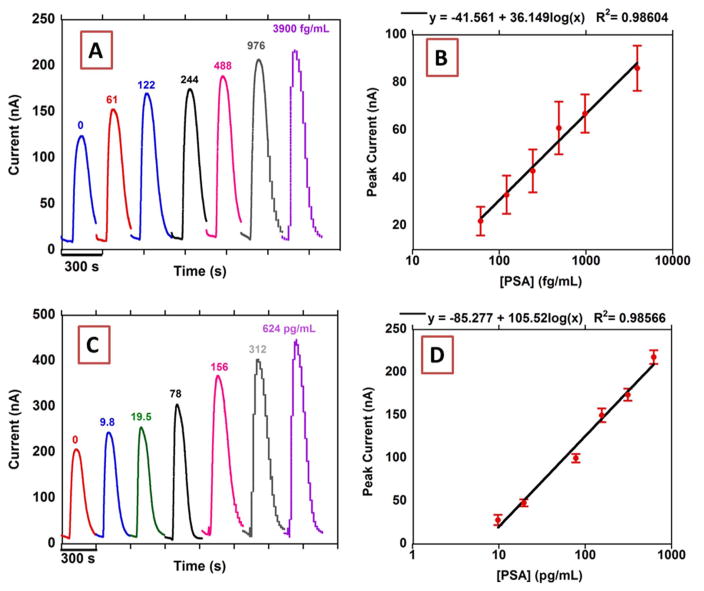
The system in Fig. 1 was optimized to measure the analyte proteins with specific capture antibodies attached onto the sensors. The analyte proteins were first captured by detection antibodies (Ab2) immobilized on Fe3O4@GO in a test tube and magnetically separated. Then the protein-Ab2-Fe3O4@GO bioconjugate was delivered to the detection chamber (See Experimental). The protein-Ab2-Fe3O4@GO conjugates were captured by Ab1 on sensor surfaces under stopped flow, and unbound conjugates were then washed away. Amounts of Fe3O4@GO bound to the sensor were proportional to the specific protein concentrations, as was the amperometric peak current due to the decomposition of H2O2 catalyzed by Fe3O4 nanoparticles in the detection step (Fig. 3).
Fig. 3.
Results from n=8. microfluidic array for standard solutions of PSA in calf serum (A) peak currents using 2 mg/mL Fe3O4@GO and (B) calibration plot (control subtracted) using 2 mg/mL Fe3O4@GO, n=8 (C) peak currents using 0.5 mg/mL Fe3O4@GO and (D) calibration plot (control subtracted) using 0.5 mg/mL Fe3O4@GO, n=8. Signals at −0.3 V vs Ag/AgCl (0.14 M NaCl) after injecting 100 μL 5 mM H2O2.
Concentrations of Ab1 on sensors and Ab2 on Fe3O4@GO were optimized first in order to achieve the largest signal to noise ratio for PSA and PSMA proteins in undiluted calf serum. To optimize Ab1, other experimental parameters including Ab2 concentration were kept constant while varying Ab1 concentration. Similar procedures were used to optimize Ab2 concentration while keeping Ab1 constant. Optimal Ab1 concentrations in the sensor reaction mixture were 100 μg/mL for both PSA and PSMA, while the optimal Ab2 concentration was 20 μg/mL for PSA and 25 μg/mL for PSMA (Fig. S6, SI file).
3.4. Detection of PSA and PSMA
Optimized Ab1 and Ab2 concentrations were used to detect single biomarker proteins utilizing different concentrations of the Fe3O4@GO to tune the dynamic range and limits of detection (LOD, as 3X SD above blank) of the assay. For the most sensitive PSA assay, we used a high concentration of Fe3O4@GO (2 mg/mL) to get a linear correlation with 0.0361 nA/(log(pg/mL)sensitivity, LOD 15 fg/mL and dynamic range of 61 fg/mL to 3.9 pg/mL. To achieve a higher concentration dynamic range, we used a lower concentration of Fe3O4@GO (0.5 mg/ mL) to get 105 nA/(log(pg/mL) sensitivity with a LOD 4.9 pg/mL and dynamic range of 9.8–624 pg/mL (Fig. 3).
For PSMA, using a 2 mg/mL concentration of Fe3O4@GO, LOD was 4.8 fg/mL with 0.0611 nA/(log(pg/mL) sensitivity and dynamic range was 9.8 fg/mL to 10 pg/mL. With 0.5 mg/mL Fe3O4@GO, and LOD 15.6 pg/mL, the dynamic range was 15.6–7.8 ng/mL with 25.9 nA/ (log(pg/mL) sensitivity (Fig. S7, SI File).
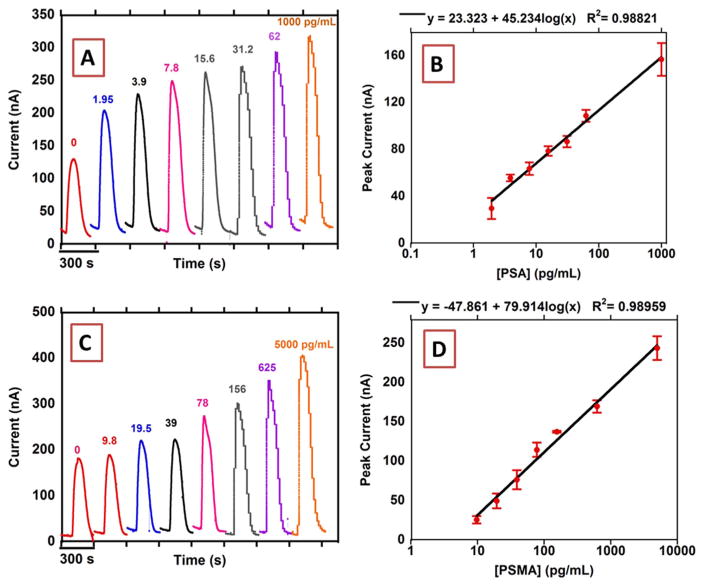
Serum levels for PSA in prostate cancer patients is > 4 ng/mL and that for PSMA is > 300 ng/mL (Smith et al., 2005; Xiao et al., 2001). Concentrations of Fe3O4@GO were tuned for multiplexing both biomarkers on the same sensor array to avoid excessive dilution of patient samples. To prepare Ab2-Fe3O4@GO bio-conjugates, 0.5 mg/ mL Fe3O4@GO was used to label PSMA Ab2 while 1.0 mg/mL Fe3O4@ GO was used to label PSA Ab2. Using this protocol, the PSA was tuned to LOD 1.25 pg/mL with a dynamic range of 1.25–1000 pg/mL while PSMA was tuned to LOD 9.7 pg/mL with a dynamic range of 9.7–5000 pg/mL (Fig. 4). This approach allowed dilution of patient serum by 100-fold in buffer to bring concentrations into dynamic ranges.
Fig. 4.
Amperometric responses from microfluidic immunoarray in mixtures: (A) PSA and (C) PSMA. Along with multiplexed calibrations of: (B) PSA and (D) PSMA in calf serum using 1 mg/mL Fe3O4@GO after injecting 5 mM H2O2 at −0.3 V vs. Ag/AgCl(0.14 M NaCl), Controls subtracted, n=8.
3.5. Assay validation
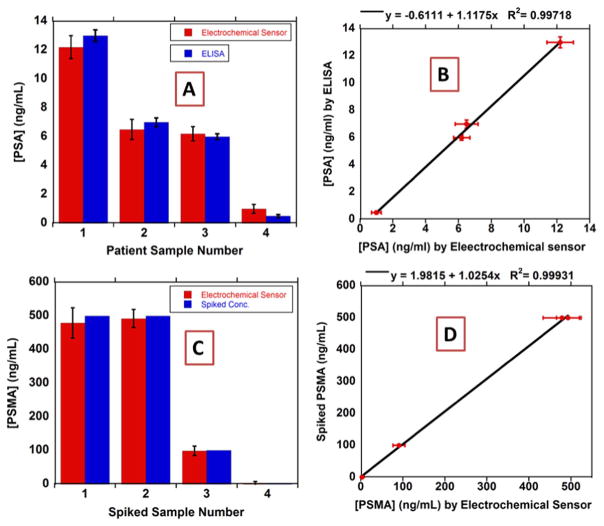
PSA and PSMA were determined in 3 pooled prostate cancer patient serum samples and one negative control human sample (Capital Bioscience Inc.) and compared to single protein ELISA assays. 10 μL of each sample was diluted 100× in PBS. Samples were also spiked with varying concentrations (100–500 ng/mL) of PSMA as an additional accuracy test, since initial analyses showed very low concentrations of this protein (less than 20 ng/mL). Immunoarray results showed very good correlation with the results obtained from single protein ELISA (Fig. 5). Linear correlation plots of the immunoassay against ELISA showed slopes near unity, 1.118 ± 0.042 for PSA and 1.025 ± 0.019 for PSMA, and intercepts close to zero, −0.611 ± 0.319 for PSA and 2.0 ± 6.6 for PSMA (Fig. 5).
Fig. 5.
Multiplexed immunoarray compared to single-protein ELISA results for patient samples for (A) PSA and (B) PSMA and linear correlation plots of immunoarray against ELISA for (C) PSA and (D) PSMA.
The above results demonstrated the use of Fe3O4 nanoparticles on graphene oxide sheets (Fig. 2) decorated with antibodies to facilitate both analyte protein capture and electrochemical detection (Scheme 1) in a simple microfluidic device for sensitive measurements of proteins. Prostate cancer biomarker proteins PSA and PSMA were detected in diluted serum with LODs in the low fg/mL range and with very high sensitivity. Attachment of multiple Fe3O4 nanoparticles on each GO sheet provides amplification of the amperometric signal for each protein. The GO sheets also allow attachment of a large number of detection antibodies leading to very efficient protein capture, analogous to multi-antibody magnetic beads (Mani et al., 2012). In addition, the large surface area facilitates larger currents that increase signal to background when non-specific binding is minimized. This approach provided sensitivity roughly equivalent to that obtained using 1 μm diam. magnetic beads coated with massive numbers of Ab2 and HRP labels (Malhotra et al., 2012, Otieno et al., 2014). This LOD is 1000-fold better than the only previous report of using Fe3O4 (as gold-Fe3O4) as an electrochemical label for detection of PSA (Wei et al., 2010).
Excellent reproducibility was obtained as evidenced by the small error bars in multiple measurements (Figs. 3 and 4). The Fe3O4@GO conjugates provide a low cost material stabilized by virtue of multiple co-operative binding events on the GO sheets. In addition to catalytic activity of Fe3O4 nanoparticles providing the detection approach, they also provide magnetic control that facilitates separation and washing. Electrodes decorated with capture antibodies were stable for 3 days at 4°C after which 20% of the activity were lost on day 4 (Fig. S8, SI).
Sensitivities as given by the slopes of the calibration curves (Fig. 3 and Fig. S7, SI file) and LODs in calf serum can be easily tuned in this system by adjusting the amounts of Fe3O4@GO composite used in the assay. For PSA, sensitivity can be tuned from 0.036 nA/log (pg/mL) to 10.5 nA/log (pg/mL) and from 0.061 nA/log (pg/mL) to 25.9 nA/log (pg/mL) for PSMA. In contrast, other assay done using the same offline protein capture technique in a similar microfluidic device utilizing magnetic beads labeled with 400,000 HRP had a sensitivity of 5.9–6.8 nA/log (pg/mL) (Malhotra et al., 2012). LOD was 15 fg/mL for PSA and 4.8 fg/mL for PSMA which is comparable to those obtained in other multiplexed protein assays using commercial magnetic beads labeled with multiple HRPs and Ab2 (Malhotra et al., 2012; Otieno et al., 2014; Krause et al., 2013). Tuning of these enzyme-label assays can be done by changing the number of HRPs on the beads and/or by changing bead size, but both approaches require new syntheses of the HRP-Ab2-coated magnetic beads. Maintaining the ultra-low LODs, the cost of reagents for 2-protein assays using Fe3O4@GO was $0.85, only 30% of the cost of the same assay with commercial magnetic beads and HRP which cost around $3.00/2-protein assays (Krause et al., 2013).
Multiplexing is important in protein-based cancer diagnostics to lower incidence false positives and false negatives encountered with less reliable single protein biomarker based assays (Rusling, 2013). Multiplexed protein detection is easily optimized in the present assay system by tuning the dynamic range of the assay for each protein concentration level expected in the particular samples at hand by adjusting the amount of Fe3O4@GO used to prepare Ab2-Fe3O4@GO for each protein (Fig. 4). Tuning the dynamic ranges allowed simultaneous detection of two protein biomarkers in the same assay here, in which the serum level of PSMA can be up to 80-fold larger than that of PSA (Fig. 5) (Smith et al., 2005; Xiao et al., 2001).
Coating the screen-printed carbon sensor electrodes with electrochemically reduced GO facilitated immobilization of a large number of capture antibodies and also improves the conductivity of the electrode surface. While GO is a semiconductor (Li et al., 2012) with 52 (± 11) S/ cm conductivity, incorporation of Fe3O4 onto the surface did not impair semi-conductive character of the Fe3O4@GO composite that had a conductivity of 17 (± 2) S/cm.
The assay gave excellent accuracy as shown by the good correlation to single protein ELISA with slopes of unity and near zero intercepts (Fig. 5). Sample required was only 10 μL diluted 100 times to fit into the dynamic range of the multiplexed assay that was enough for three or more runs. Ability to detect PSA and PSMA in human serum samples that contain hundreds of other proteins demonstrated the high selectivity of the assay.
4. Conclusions
An ultrasensitive, tunable mediator-free, enzyme-free immunoarray protocol using magnetic Fe3O4@GO composites was demonstrated for the detection of two prostate cancer biomarkers. Fe3O4@GO composites serve the dual function of magnetic analyte isolation and labels for detection. Ease of tunability allowed tailoring of protocols to simultaneously detect PSMA at levels up to 80-fold more concentrated than PSA in patient samples. Accuracy was demonstrated by excellent correlation of patient serum sample immunoarray results with ELISA.
Supplementary Material
Acknowledgments
This work was supported financially by grant No. EB016707 from the National Institute of Biomedical Imaging and Bioengineering (NIBIB), NIH.
Appendix A. Supporting information
Supplementary data associated with this article can be found in the online version at doi:10.1016/j.bios.2016.12.052.
References
- Bard AJ, Faulkner LR. Electrochemical Methods: Fundamentals and Applications. John Wiley & Sons Inc; New York: 2000. [Google Scholar]
- Biochemica BMG. Biochemica Information: A Revised Biochemical Reference Source. Boehringer Mannheim GmbH; Biochemica: 1987. [Google Scholar]
- Chang Q, Deng K, Zhu L, Jiang G, Yu C, Tang H. Microchim Acta. 2009;165:299. [Google Scholar]
- Das J, Kelley SO. Anal Chem. 2011;83:1167–1172. doi: 10.1021/ac102917f. [DOI] [PubMed] [Google Scholar]
- de Gramont A, Watson S, Ellis LM, Rodón J, Tabernero J, de Gramont A, Hamilton SR. Nat Rev Clin Oncol. 2015;12:197–212. doi: 10.1038/nrclinonc.2014.202. [DOI] [PubMed] [Google Scholar]
- Deng H, Li X, Peng Q, Wang X, Chen J, Li Y. Angew Chem Int Ed. 2005;44:2782–2785. doi: 10.1002/anie.200462551. [DOI] [PubMed] [Google Scholar]
- Dixit CK, Kadimisetty K, Otieno BA, Tang C, Malla S, Krause CE, Rusling JF. Analyst. 2016;141:536–547. doi: 10.1039/c5an01829c. [DOI] [PMC free article] [PubMed] [Google Scholar]
- Dong Y, Zhang H, Rahman ZU, Su L, Chen X, Hu J, Chen X. Nanoscale. 2012;4:3969–3976. doi: 10.1039/c2nr12109c. [DOI] [PubMed] [Google Scholar]
- Fang H, Pan Y, Shan W, Guo M, Nie Z, Huang Y, Yao S. Anal Methods. 2014;6:6073–6081. [Google Scholar]
- Gao L, Wu J, Lyle S, Zehr K, Cao L, Gao D. J Phys Chem C. 2008;112:17357–17361. [Google Scholar]
- Han Q, Wang Z, Xia J, Chen S, Zhang X, Ding M. Talanta. 2012;101:388–395. doi: 10.1016/j.talanta.2012.09.046. [DOI] [PubMed] [Google Scholar]
- Hummers WS, Offeman RE. J Am Chem Soc. 1958;80:1339–1339. [Google Scholar]
- Kelley SO, Mirkin CA, Walt DR, Ismagilov RF, Toner M, Sargent EH. Nat Nanotechnol. 2014;9:969–980. doi: 10.1038/nnano.2014.261. [DOI] [PMC free article] [PubMed] [Google Scholar]
- Jiao T, Liu Y, Wu Y, Zhang Q, Yan X, Gao F, Bauer AJP, Liu J, Zeng T, Li B. Sci Rep. 2015;5:12451. doi: 10.1038/srep12451. [DOI] [PMC free article] [PubMed] [Google Scholar]
- Kim MI, Kim MS, Woo MA, Ye Y, Kang KS, Lee J, Park HG. Nanoscale. 2014;6:1529. doi: 10.1039/c3nr05539f. [DOI] [PubMed] [Google Scholar]
- Krause CE, Otieno BA, Latus A, Faria RC, Patel V, Gutkind JS, Rusling JF. ChemistryOpen. 2013;2:141–145. doi: 10.1002/open.201300018. [DOI] [PMC free article] [PubMed] [Google Scholar]
- Kulasingam V, Diamandis EP. Nat Clin Pract Oncol. 2008;5:588–599. doi: 10.1038/ncponc1187. [DOI] [PubMed] [Google Scholar]
- Lam B, Das J, Holmes RD, Live L, Sage A, Sargent EH, Kelley SO. Nat Commun. 2013;4:2001. doi: 10.1038/ncomms3001. [DOI] [PubMed] [Google Scholar]
- Lequin RM. Clin Chem. 2005;51:2415–2418. doi: 10.1373/clinchem.2005.051532. [DOI] [PubMed] [Google Scholar]
- Li ZJ, Yang BC, Zhang SR, Zhao CM. Appl Surf Sci. 2012;258:3726–3731. [Google Scholar]
- Liu M, Chen C, Hu J, Wu X. J Phys Chem C. 2011;115:25234–25240. [Google Scholar]
- Liu Y, Yuan M, Qiao L, Guo R. Biosens Bioelectron. 2014;52:391–396. doi: 10.1016/j.bios.2013.09.020. [DOI] [PubMed] [Google Scholar]
- Loh KP, Bao Q, Eda G, Chhowalla M. Nat Chem. 2010;2:1015–1024. doi: 10.1038/nchem.907. [DOI] [PubMed] [Google Scholar]
- Ma M, Xie J, Zhang Y, Chen Z, Gu N. Mater Lett. 2013;105:36–39. [Google Scholar]
- Malhotra R, Patel V, Chikkaveeraiah BV, Munge BS, Cheong SC, Zain RB, Abraham MT, Dey DK, Gutkind JS, Rusling JF. Anal Chem. 2012;84:6249–6255. doi: 10.1021/ac301392g. [DOI] [PMC free article] [PubMed] [Google Scholar]
- Mani Vigneshwaran, Wasalathanthri Dhanuka P, Joshi Amit A, Kumar Challa V, Rusling James F. Highly efficient binding of paramagnetic beads bioconjugated with 100,000 or more antibodies to protein-coated surfaces. Anal Chem. 2012;84:10485–10491. doi: 10.1021/ac3028257. [DOI] [PMC free article] [PubMed] [Google Scholar]
- Meissner EG, Decalf J, Casrouge A, Masur H, Kottilil S, Albert ML, Duffy D. PLoS One. 2015;10:e0133236. doi: 10.1371/journal.pone.0133236. [DOI] [PMC free article] [PubMed] [Google Scholar]
- Noble JE, Bailey MJA. Methods Enzymol. 2009;463:73–95. doi: 10.1016/S0076-6879(09)63008-1. [DOI] [PubMed] [Google Scholar]
- O’Keefe DS, Su SL, Bacich DJ, Horiguchi Y, Luo Y, Powell CT, Zandvliet D, Russell PJ, Molloy PL, Nowak NJ, Shows TB, Mullins C, Vonder Haar RA, Fair WR, Heston WD. Biochim Biophys Acta. 1998;1443:113–127. doi: 10.1016/s0167-4781(98)00200-0. [DOI] [PubMed] [Google Scholar]
- Otieno BA, Krause CE, Latus A, Chikkaveeraiah BV, Faria RC, Rusling JF. Biosens Bioelectron. 2014;53:268–274. doi: 10.1016/j.bios.2013.09.054. [DOI] [PMC free article] [PubMed] [Google Scholar]
- Rusling JF. Anal Chem. 2013;85:5304–5310. doi: 10.1021/ac401058v. [DOI] [PMC free article] [PubMed] [Google Scholar]
- Rusling JF, Bishop GW, Doan N, Papadimitrakopoulos F. J Mater Chem B Mater Biol Med. 2014:2. doi: 10.1039/C3TB21323D. [DOI] [PMC free article] [PubMed] [Google Scholar]
- Sheng K, Sun Y, Li C, Yuan W, Shi G. Sci Rep. 2012:2. doi: 10.1038/srep00247. [DOI] [PMC free article] [PubMed] [Google Scholar]
- Smith RA, Cokkinides V, Eyre HJ. CA Cancer J Clin. 2005;55:31–44. 56. doi: 10.3322/canjclin.55.1.31. [DOI] [PubMed] [Google Scholar]
- Smits FM. Bell Syst Tech J. 1958;37:711–718. [Google Scholar]
- Stamey TA, Teplow DB, Graves HCB. Prostate. 1995;27:198–203. doi: 10.1002/pros.2990270404. [DOI] [PubMed] [Google Scholar]
- Sun H, Jiao X, Han Y, Jiang Z, Chen D. Eur J Inorg Chem. 2013;2013:109–114. [Google Scholar]
- Sun X, Guo S, Liu Y, Sun S. Nano Lett. 2012;12:4859–4863. doi: 10.1021/nl302358e. [DOI] [PubMed] [Google Scholar]
- Wei H, Wang E. Anal Chem. 2008;80:2250–2254. doi: 10.1021/ac702203f. [DOI] [PubMed] [Google Scholar]
- Wei H, Yang W, Xi Q, Chen X. Mater Lett. 2012;82:224–226. [Google Scholar]
- Wei Q, Xiang Z, He J, Wang G, Li H, Qian Z, Yang M. Biosens Bioelectron. 2010;26:627–631. doi: 10.1016/j.bios.2010.07.012. [DOI] [PubMed] [Google Scholar]
- Wu X, Zhang Y, Han T, Wu H, Guo S, Zhang J. RSC Adv. 2013;4:3299–3305. [Google Scholar]
- Xiao Z, Adam BL, Cazares LH, Clements MA, Davis JW, Schellhammer PF, Dalmasso EA, Wright GL. Cancer Res. 2001;61:6029–6033. [PubMed] [Google Scholar]
- Yang X, Wang L, Zhou G, Sui N, Gu Y, Wan J. J Clust Sci. 2014;26:789–798. [Google Scholar]
- Zhang L, Zhai Y, Gao N, Wen D, Dong S. Electrochem Commun. 2008;10:1524–1526. [Google Scholar]
- Zhang Y, Guo Y, Xianyu Y, Chen W, Zhao Y, Jiang X. Adv Mater. 2013;25:3802–3819. doi: 10.1002/adma.201301334. [DOI] [PubMed] [Google Scholar]
- Zhang Z, Wang Z, Wang X, Yang X. Sens Actuators B Chem. 2010;147:428–433. [Google Scholar]
Associated Data
This section collects any data citations, data availability statements, or supplementary materials included in this article.


