

Abstract
Objective
Lipoprotein(a) [Lp(a)] levels are genetically determined by hepatocyte apolipoprotein(a) synthesis, but catabolic pathways also influence circulating levels. APOE genotypes have different affinities for the LDL receptor (LDLR) and LDL related protein-1 (LRP-1), with ε2 having the weakest binding to LDLR at <2% relative to ε3 and ε4.
Approach and Results
APOE genotypes (ε2/ε2, ε2/ε3, ε2/ε4, ε3/ε3, ε3/ε4 and ε4/ε4), Lp(a) mass, directly-measured Lp(a) cholesterol (Lp(a)-C) levels and a variety of apoB-related lipoproteins were measured in 431,239 patients. The prevalence of APOE traits were: ε2:7.35%, ε3:77.56%, and ε4:15.09%. Mean (SD) Lp(a) levels were 65% higher in ε4/ε4 compared to ε2/ε2 genotypes and increased significantly according to APOE genotype: ε2/ε2: 23.4(29.2), ε2/ε3: 31.3(38.0), ε2/ε4: 32.8(38.5), ε3/ε3: 33.2(39.1), ε3/ε4: 35.5(41.6), and ε4/ε4: 38.5(44.1) mg/dL (P<0.0001). LDL-C, apoB, Lp(a)-C, LDL-C corrected for Lp(a)-C content, LDL particle number and small dense LDL also had similar patterns. Patients with LDL-C ≥250mg/dL, who are more likely to have LDLR mutations and reduced affinity for apoB, had higher Lp(a) levels across all apoE isoforms, but particularly in patients with ε2 alleles, compared to LDL <250mg/dL. The lowest Lp(a) mass levels were present in patients with ε2 isoforms and lowest LDL-C.
Conclusions
APOE genotypes strongly influence Lp(a) and apoB-related lipoprotein levels. This suggests that differences in affinity of apoE proteins for lipoprotein clearance receptors may affect Lp(a) catabolism, suggesting a competition between Lp(a) and apoE protein for similar receptors.
Keywords: Lp(a), apoE, genotype, cardiovascular disease, prevalence, populations, guidelines
Introduction
Lipoprotein(a) [Lp(a)] is an independent and likely causal risk factor for cardiovascular disease (CVD) and calcific aortic valve stenosis (CAVS).1-3 Lp(a) plasma levels are primarily (∼90%) determined by variations in the LPA gene locus,4 including the number of kringle IV2 repeats and LPA single nucleotide polymorphisms. In addition, apolipoprotein(a) gene expression can be modulated by interlukin-6 that increases hepatocyte apolipoprotein(a) production, and by estrogen and bile acids that decrease production.5, 6 Clearance mechanisms are not well defined but the major possibilities include the LDL receptor (LDLR), scavenger receptor B1,7 plasminogen receptors and renal mechanisms.8
Apolipoprotein E (apoE) is polymorphic glycoprotein synthesized and secreted primarily by liver, brain, skin and macrophages.9 ApoE is present on very low density lipoproteins (VLDL), remnant lipoproteins and HDL and facilitates their clearance via the LDL receptor (LDLR) and the LDL related protein-1 (LRP1) and syndecan-1 (SDC1).10, 11 The 3 isoforms of APOE, ε2, ε3 and ε4, differ by single amino acid substitutions at two non-synonymous sites, which affect binding affinity for LDLR, LRP1 and SDC1. These variations are associated with differences in circulating VLDL-C, IDL-C and LDL-C levels, risk of CVD and the propensity to Alzheimer's disease.12
Although APOE genotypes have been associated with differences in lipoprotein levels, less is known about their role in influencing plasma Lp(a) levels.13, 14 Previous studies reporting a relationship between Lp(a) and the apoE genotype are difficult to interpret as they suffer from low patient numbers in the less prevalent apoE genotypes. In particular controversy persists on whether the LDLR plays any significant role in Lp(a) clearance, and therefore if it influences plasma Lp(a) levels under physiological conditions.8, 15 Furthermore, the relationship of APOE genotypes with Lp(a)-cholesterol [Lp(a)-C] and advanced measures of lipoproteins, such as plasma levels of apolipoprotein B-100, LDL particle number, small dense LDL and high-sensitivity C-reactive protein (hsCRP) has not been previously evaluated. In this study, we describe the relationship of APOE genotypes with Lp(a) levels and apoB-related lipoprotein measurements in a very large database from a referral laboratory.
Materials and Methods
Materials and Methods are available in the online-only Data Supplement Materials and Methods
Results
Baseline characteristics
The data is presented by APOE isoform genotype in Table 1. The prevalence of APOE traits were: ε2: 7.35%, ε3: 77.56%, and ε4: 15.09%. The prevalence of APOE genotypes were: ε2/ε2: 0.61%, ε2/ε3: 11.17%, ε2/ε4: 2.3%, ε3/ε3: 60.41%, ε3/ε4: 23.14% and ε4/ε4: 2.38%.. The mean age range was approximately 54-56, ∼53% of patients were female and BMI was ∼30.
Table 1. Baseline variables expressed by APOE isoform status.
| Variable | ε2/ε2 | ε2/ε3 | ε2/ε4 | ε3/ε3 | ε3/ε4 | ε4/ε4 | P-trend |
|---|---|---|---|---|---|---|---|
| ApoE genotype, Number | 2,645 | 48,155 | 9,914 | 262,337 | 100,388 | 10,307 | |
| ApoE genotype, % | 0.61 | 11.2 | 2.3 | 60.8 | 23.3 | 2.4 | <0.001 |
| Age, years | 55.4 (15.1) | 56.1 (15.0) | 55.4 (14.6) | 55.6 (15.0) | 55.0 (14.7) | 54.0 (14.3) | <0.001 |
| Sex, % Female | 53.0 | 52.0 | 52.3 | 52.1 | 52.7 | 52.9 | <0.001 |
| BMI | 30.1 (6.9) | 29.9 (6.8) | 30.1 (7.2) | 29.6 (6.7) | 29.7 (6.8) | 29.8 (7.0) | <0.001 |
| Lp(a) mass, mean, mg/dL | 23.4 (29.2) | 31.3 (38.0) | 32.8 (38.5) | 33.2 (39.1) | 35.5 (41.6) | 38.5 (44.1) | <0.001 |
| Lp(a) mass, median, mg/dL | 11 (5-30) | 15 (6-43) | 16 (7-46) | 17 (7-46) | 18 (7-50) | 20 (8-56) | <0.001 |
| Lp(a)-C, mean, mg/dL | 9.8 (7.7) | 11.2 (8.0) | 10.9 (7.6) | 11.1 (8.1) | 11.4 (8.4) | 11.5 (8.8) | <0.001 |
| Lp(a)-C, median, mg/dL | 7.7 (5.1-12.0) | 9.1 (5.5-14.5) | 8.8 (5.3-14.5) | 9.0 (5.2-14.7) | 9.1 (5.3-15.0) | 9.0 (5.1-15.4) | <0.001 |
| TC, mg/dL | 176.5 (62.6) | 177.4 (1.5) | 181.9 (42.8) | 187.5 (43.0) | 191.6 (44.4) | 195.8 (46.1) | <0.001 |
| LDL-C, mg/dl | 49.6 (18.5) | 89.1 (28.8) | 95.0 (30.5) | 106.1 (33.6) | 110.6 (35.2) | 114.3 (36.8) | <0.001 |
| LDL-C, corr, mg/dL | 42.7 (18.4) | 79.8 (29.7) | 85.2 (31.4) | 96.1 (34.5) | 100.0 (36.2) | 102.8 (37.8) | <0.001 |
| ApoB, mg/dL | 56.6 (19.2) | 82.3 (23.5) | 87.1 (24.7) | 93.4 (25.6) | 97.45 (26.8) | 101.1 (27.7) | <0.001 |
| LDL particle #, nmol/L | 749 (361) | 1309 (476) | 1402 (507) | 1558 (537) | 1629 (560) | 1682 (578) | <0.001 |
| Small dense LDL, mg/dL | 14.6 (7.3) | 25.8 (12.1) | 27.9 (12.8) | 30.9 (14.3) | 33.2 (15.1) | 35.1 (15.6) | <0.001 |
| non-HDL-C, mg/dL | 122.3 (64.3) | 122.9 (39.5) | 127.8 (40.6) | 133.7 (39.8) | 138.5 (41.2) | 143.1 (42.6) | <0.001 |
| HDL-C, mg/dL | 54.2 (16.8) | 54.6 (16.4) | 54.1 (16.5) | 52.9 (15.6) | 53.1 (15.4) | 53.8 (15.5) | <0.001 |
| ApoA-I | 152.1 (31.6) | 149.6 (30.4) | 147.4 (30.8) | 146.8 (29.8) | 144.5 (29.6) | 143.5 (29.6) | <0.001 |
| TG, mg/dL | 140 (96-218) | 115 (80-167) | 112 (79-166) | 109 (77-155) | 109 (77-159) | 109 (77-161) | <0.001 |
| hsCRP, mg/L | 2.3 (1.1-5.1) | 2.2 (1.0-5.1) | 1.8 (0.8-4.3) | 2.0 (0.9-4.6) | 1.5 (0.67-3.6) | 1.1 (0.5-2.7) | <0.001 |
The data is provided as mean (SD) or median (IQR). LDL-C corr is LDL-C corrected for Lp(a)-C content and is derived as LDL-C minus (Lp(a) mass*0.3)
Lipid and lipoprotein variables
Corresponding mean(SD) Lp(a) levels increased significantly according to APOE genotype ranging from 23.4 mg/dL for ε2/ε2 to 38.5(44.1) mg/dL for ε4/ε4 (P<0.0001 ANOVA) (Table 1 and Figure 1). Median Lp(a) levels also increased by genotype, from 11 mg/dL for ε2/ε2 to 20 mg/dL for ε4/ε4. Along with Lp(a) mass, Lp(a)-C also increased according to APOE genotype. Mean LDL-C also increased by APOE genotype ranging from 49.6 mg/dL for ε2/ε2 to 114.3 mg/dL for ε4/ε4 (P<0.0001 ANOVA). Corresponding mean apoB levels ranged from 56.6 for ε2/ε2 to 101.1 mg/dL for ε4/ε4 (p<0.0001 ANOVA). Striking increases in LDL particle number and small dense LDL were also noted according to genotype, with lowest values in ε2/ε2 to highest values in ε4/ε4.
Figure 1.
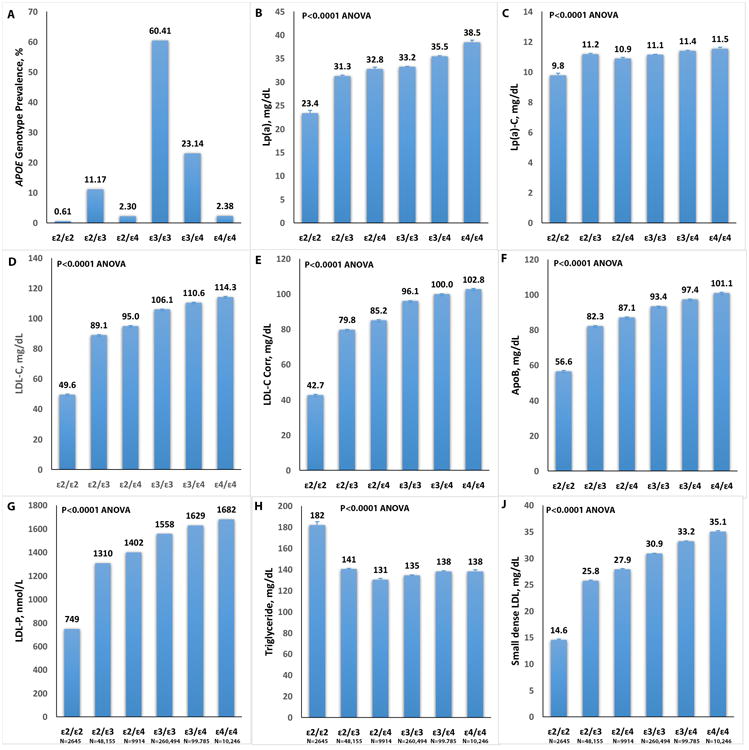
Relationship of APOE genotypes (prevalence shown in panel A) to Lp(a) mass (B), Lp(a)-C (C), LDL-C (D), LDL-C corr (E), apoB (F), LDL-particle number (LDL-P) (G), triglycerides (H) and small dense LDL (J).
In contrast, median triglyceride levels were inversely associated with APOE genotype from 140 mg/dL to 109 mg/dL for ε4/ε4 (p<0.0001 ANOVA). A similar but modest inverse association was noted with HDL-C (P<0.0001 ANOVA). Finally, hsCRP was also inversely associated with APOE genotype, with highest values in highest values in ε2/ε2 to lowest values in ε4/ε4 (Table 1).
For the patients with ε2/ε2 phenotype, a portion of which can have elevated triglycerides when a secondary stimulus accelerates VLDL production, additional analyses were performed. Out of 2445 patients with ε2/ε2 phenotype, there were 1205, 782 and 93 patients with triglyceride levels ≥150 mg/dL, ≥200 mg/dL and ≥500 mg/dL, respectively. Patients with triglycerides < vs. ≥150 mg/dL (Lp(a) mean (SD) 23.1 (28.5 vs. 23.7 (30.0), p=0.54), <200 vs. ≥200 mg/dL (Lp(a) mean (SD) 23.6 (29.5 vs. 22.8 (9.2), p=0.53), or <500 vs. ≥500 mg/dL (Lp(a) mean (SD) 23.4 (29.1 vs. 23.5 (30.9), p=0.98), did not have significantly different levels. Figure 1 shows a graphical representation of some of the key relationships.
Correlations among variables
Using a validated Lp(a)-C assay,16 the Spearman correlation between Lp(a) mass and Lp(a)-C was r2=0.79 (p<0.001) and between Lp(a) mass and LDL-C r2=0.008 (p<0.001) (Figure 2). All other correlations of Lp(a) mass with variables in Table 1 had r <0.10, but due to the large numbers all were statistically significant with p<0.001 (data not shown). Lp(a)-C also had a weak correlation with LDL-C (r2=0.012, p<0.001), total cholesterol (r2=0.018, p<0.001), HDL-C r2=0.0.38, p<0.001), and triglycerides (r2=-0.016, p<0.001). All other correlations of Lp(a)-C with variables in table 1 had r <0.10, but due to the large numbers all were statistically significant with p<0.001 (data not shown).
Figure 2.

Relationship of Lp(a) mass to Lp(a)-C and LDL-C.
Relationship Of Apoe Isoforms To Ldl-C ≥190 Mg/Dl And Ldl-C ≥250 Mg/Dl
Because LDLR mutation status was not available, we used LDL-C ≥190 mg/dL and LDL-C ≥250 mg/dL as potential surrogates for LDLR deficiency to derive insights into the potential role of the LDLR vis-à-vis APOE genotypes and Lp(a) catabolism. The analysis showed that compared to patients with LDL-C <190 mg/dL or <250 mg/dL, respectively, patients with LDL-C ≥190 mg/dL (mean (SD) Lp(a) 33.4 (39.4) mg/dL vs. 47.2 (50.9) mg/dL, p<0.001) and LDL ≥250 (mean (SD) Lp(a) 33.6 (39.6) mg/dL vs. 49.4 (53.1) mg/dL, p<0.001) had significantly higher Lp(a) levels.
When analyzed by APOE isoform status and LDL-C cutoffs, the lowest Lp(a) levels were present in ε2 genotypes with concomitant low LDL-C (Table 2). In contrast, ε2 genotypes with concomitant high LDL-C had the highest Lp(a) levels. The differences in Lp(a) levels according to APOE genotypes and normal or elevated LDL-C were greatest in ε2 genotypes and smallest in ε4 genotypes. For example, in individuals with ε2/ε3 genotype (there was only one ε2/ε2 individual with LDL ≥190, so this genotype could not be examined), Lp(a) levels were 31.2 (37.9) for LDL-C <190 mg/dL and 63.3 (57.5) for LDL ≥190 mg/dL (p<0.001). In contrast, for ε4/ε4 Lp(a) levels were 38.1 (43.8) mg/dL for LDL-C <190 mg/dL and 50.2 (52.1) for LDL ≥190 mg/dL (p<0.001).
Table 2. Baseline variables expressed by APOE isoform status and LDL-C cutoffs of < or ≥190 mg/dL and < or ≥250 mg/dL.
| Variable | ε2/ε2 | ε2/ε2 | ε2/ε2 | ε2/ε2 | ||
|---|---|---|---|---|---|---|
| LDL-C <190 | LDL-C ≥190 | p-value | LDL-C <250 | LDL-C ≥250 | p-value | |
|
|
||||||
| Number | 2644 | 1 | 2645 | 0 | ||
| Lp(a) mass, mean, mg/dL | 23.4 (29.2) | 3.0 | 0.49 | 23.4 (29.2) | - | - |
| Lp(a) mass, median, mg/dL | 11.0 (5.0-30.0) | 0.49 | 11.0 (5.0-30.0) | - | - | |
| Lp(a)-C*, mg/dL | 7.7 (5.1-12.0) | - | - | 7.7 (5.1-12.0) | - | - |
| LDL-C, mg/dl | 49.5 (18.1) | 244 | <0.001 | 49.5 (18.1) | - | - |
| LDL-Ccorr, mg/dl | 42.7 (18.1) | 243 | <0.001 | 42.7 (18.1) | - | - |
| non-HDL-C, mg/dL | 122.3 (64.3) | 228 | 0.10 | 122.3 (64.3) | - | - |
| ApoB, mg/dL | 56.6 (54.0) | 199 | <0.001 | 56.6 (54.0) | - | - |
| TG, mg/dL | 140 (96-218) | 108 | 0.65 | 140 (96-218) | - | - |
| ε2/ε3 | ε2/ε3 | ε2/ε3 | ε2/ε3 | |||
|
|
||||||
| LDL-C <190 | LDL-C ≥190 | p-value | LDL-C <250 | LDL-C ≥250 | p-value | |
|
|
||||||
| Number | 48,011 | 144 | 48,138 | 17 | ||
| Lp(a) mass, mean, mg/dL | 31.2 (37.9) | 63.3 (57.5) | <0.001 | 31.3 (38.0) | 67.3 (66.4) | <0.001 |
| Lp(a) mass, median, mg/dL | 15.0 (6.0-43.0) | 46.0 (16.0-99.8) | <0.001 | 15.0 (6.0-43.0) | 44.0 (13.5-109.5) | <0.001 |
| Lp(a)-C*, mg/dL | 9.1 (5.5-14.4) | 15.2 (7.5-23.2) | <0.001 | 9.1 (5.5-14.5) | 15.7 (10.1-30.3) | <0.001 |
| LDL-C, mg/dl | 88.7 (27.9) | 217.5 (32.9) | <0.001 | 89.0 (28.5) | 282.2 (53.1) | <0.001 |
| LDL-Ccorr, mg/dl | 79.4 (28.8) | 198.5 (35.9) | <0.001 | 79.7 (29.4) | 2612.0 (50.7) | <0.001 |
| non-HDL-C, mg/dL | 122.4 (38.6) | 269.3 (51.5) | <0.001 | 122.8 (39.3) | 342.9 (67.0) | <0.001 |
| ApoB, mg/dL | 82.1 (22.9) | 173.9 (27.8) | <0.001 | 82.3 (23.3) | 215.1 (29.9) | <0.001 |
| TG, mg/dL | 115 (80-167) | 168 (109-235) | <0.001 | 115 (80-167) | 162.5 (89.3) | 0.45 |
| ε2/ε4 | ε2/ε4 | ε2/ε4 | ε2/ε4 | |||
|
|
||||||
| LDL-C <190 | LDL-C ≥190 | p-value | LDL-C <250 | LDL-C ≥250 | ||
|
|
||||||
| Number | 9,853 | 62 | 9906 | 8 | ||
| Lp(a) mass, mean, mg/dL | 32.7 (38.4) | 51.8 (51.8) | <0.001 | 32.7 (38.5) | 77.0 (61.0) | 0.001 |
| Lp(a) mass, median, mg/dL | 16.0 (7.0-46.0) | 26.0 (15.3-86.3) | <0.001 | 16.0 (7.0-46.0) | 91 (18-101.5) | 0.30 |
| Lp(a)-C, mg/dL | 8.8 (5.3-14.5) | 13.6 (7.4-20.3) | 0.002 | 8.8 (5.3-14.5) | 14.5 (11.0-19.0) | 0.002 |
| LDL-C, mg/dl | 94.2 (29.0) | 215.4 (27.0) | <0.001 | 94.8 (30.1) | 272.4 (22.1) | <0.001 |
| LDL-Ccorr, mg/dl | 84.5 (30.1) | 199.8 (27.0) | <0.001 | 85.0 (31.1) | 249.3 (16.7) | <0.001 |
| non-HDL-C, mg/dL | 127.0 (39.2) | 259.1 (44.0) | <0.001 | 127.7 (40.1) | 336.8 (34.5) | 0.32 |
| ApoB, mg/dL | 86.6 (23.8) | 168.5 (23.2) | <0.001 | 87.0 (24.4) | 211.9 (14.8) | <0.001 |
| TG, mg/dL | 112 (79-166) | 154 (105-217) | 0.025 | 112 (79-166) | 169 (124-229) | 0.025 |
| ε3/ε3 | ε3/ε3 | ε3/ε3 | ε3/ε3 | |||
|
|
||||||
| LDL-C <190 | LDL-C ≥190 | p-value | LDL-C <250 | LDL-C ≥250 | p-value | |
|
|
||||||
| Number | 256,822 | 3,672 | 260,253 | 241 | ||
| Lp(a) mass, mean, mg/dL | 33.1 (38.8) | 46.0 (50.4) | <0.001 | 33.2 (39.0) | 47.7 (52.4) | <0.001 |
| Lp(a) mass, median, mg/dL | 17.0 (7.0-46.0) | 25.0 (10.0-71.0) | <0.001 | 17.0 (7.0-46.0) | 26.0 (11.0-70.5) | <0.001 |
| Lp(a)-C*, mg/dL | 9.0 (5.2-14.6) | 12.2 (6.7-19.7) | <0.001 | 9.0 (5.2-14.7) | 13.3 (6.8-22.7) | <0.001 |
| LDL-C, mg/dl | 104.6 (31.1) | 212.3 (25.4) | <0.001 | 105.9 (33.1) | 284.7 (37.9) | <0.001 |
| LDL-Ccorr, mg/dl | 94.7 (32.3) | 198.4 (28.9) | <0.001 | 95.9 (34.1) | 269.4 (38.7) | <0.001 |
| non-HDL-C, mg/dL | 132.1 (37.3) | 247.2 (41.0) | <0.001 | 133.5 (39.3) | 328.2 (78.0) | <0.001 |
| ApoB, mg/dL | 92.4 (24.2) | 166.7 (25.2) | <0.001 | 93.3 (25.5) | 215.3 (34.4) | <0.001 |
| TG, mg/dL | 108 (77-154) | 159 (117-217) | <0.001 | 108 (77-155) | 168 (117-235) | <0.001 |
|
|
||||||
| ε3/ε4 | ε3/ε4 | ε3/ε4 | ε3/ε4 | p-value | ||
|
|
||||||
| Number | LDL-C <190 | LDL-C ≥190 | p-value | LDL-C <250 | LDL-C ≥250 | |
|
|
||||||
| Lp(a) mass, mean, mg/dL | 97,621 | 2,164 | 99.641 | 144 | ||
| Lp(a) mass, median, mg/dL | 35.2 (41.4) | 47.6 (50.9) | <0.001 | 35.4 (41.6) | 47.7 (9.0-80.8) | <0.001 |
| Lp(a)-C, mg/dL | 17.0 (7.0-50.0) | 26.0 (10.0-73.0) | <0.001 | 18.0 (7.0-50.0) | 26.0 (9.0-80.8) | <0.001 |
| LDL-C, mg/dl | 9.1 (5.3-14.7) | 11.9 (6.7-19.4) | <0.001 | 9.1 (5.3-14.9) | 15.3 (9.5-24.5) | <0.001 |
| LDL-Ccorr, mg/dl | 108.3 (31.8) | 212.9 (26.9) | <0.001 | 110.3 (34.5) | 288.8 (42.0) | <0.001 |
| non-HDL-C, mg/dL | 97.8 (33.2) | 198.6 (30.6) | <0.001 | 99.8 (35.6) | 274.5 (46.5) | <0.001 |
| ApoB, mg/dL | 136.2 (38.0) | 245.0 (38.7) | <0.001 | 138.3 (40.6) | 325.8 (61.6) | <0.001 |
| TG, mg/dL | 95.9 (24.7) | 166.9 (25.0) | <0.001 | 97.3 (26.4) | 215.8 (34.1) | <0.001 |
| 108 (77-157) | 153 (112-209) | <0.001 | 109 (77-159) | 163.5 (117-218) | <0.001 | |
| ε4/ε4 | ε4/ε4 | ε4/ε4 | ε4/ε4 | |||
|
|
||||||
| LDL-C <190 | LDL-C ≥190 | p-value | LDL-C <250 | LDL-C ≥250 | p-value | |
|
|
||||||
| Number | 9,926 | 320 | 10,225 | 21 | ||
| Lp(a) mass, mean, mg/dL | 38.1 (43.8) | 50.2 (52.1) | <0.001 | 38.4 (44.1) | 54.8 (71.6) | 0.089 |
| Lp(a) mass, median, mg/dL | 20.0 (8.0-55.0) | 27.0 (11.0-85.3) | <0.001 | 20.0 (8.0-56.0) | 21.0 (7.0-92.0) | 0.089 |
| Lp(a)-C, mg/dL | 8.9 (5.1-15.2) | 12.1 (6.0-85.3) | <0.001 | 9.0 (5.1-15.4) | 15.9 (4.5-23.4) | 0.10 |
| LDL-C, mg/dl | 111.0 (32.3) | 214.5 (24.4) | <0.001 | 113.9 (36.0) | 280.2 (30.9) | <0.001 |
| LDL-Ccorr, mg/dl | 99.7 (33.7) | 199.4 (29.5) | <0.001 | 103.5 (37.1) | 263.8 (42.8) | <0.001 |
| non-HDL-C, mg/dL | 139.8 (38.7) | 244.4 (168.8) | <0.001 | 142.7 (41.9) | 312.8 (35.6) | <0.001 |
| ApoB, mg/dL | 98.9 (24.9) | 168.8 (24.9) | <0.001 | 100.9 (27.2) | 212.2 (29.4) | <0.001 |
| TG, mg/dL | 108 (76-159) | 143 (99-199) | 0.001 | 109 (77-161) | 121 (113-178) | 0.41 |
The data is presented as mean (SD) or median (IQR).
For Lp(a)-C there were 667 patients in e2/e2, 84 in e2/e3, 62 in e2/e4, 86,853 in e3/e3, 34,995 in e3/e4, and 142 in e4/e4 groups.
Discussion
The current data document that APOE isoforms strongly influence Lp(a) mass levels, with a 65% increase in ε4/ε4 compared to ε2/ε2 genotypes. Consistent with this, Lp(a)-C levels, determined with an assay that strongly reflects Lp(a) mass,16 also increased according to APOE genotypes. In addition, a variety of measures of lipoprotein particle number, including apoB levels, LDL particle number and small dense LDL had similar statistically significant associations. Finally, it was documented that concomitantly highly elevated LDL-C, a surrogate for LDLR deficiency, also influenced Lp(a) levels overall with higher levels in subjects with elevated LDL, as shown previously with a gene-dose relationship in subjects with homozygous and heterozygous familial hypercholesterolemia.17, 18 This relationship was particularly accentuated in patients with ε2/ε2 genotypes that have the lowest affinity for the LDLR and LRP1. Because apoE proteins are not thought to directly affect hepatocyte synthesis of apolipoprotein(a) or impact Lp(a) assembly or secretion, it suggests that Lp(a) catabolism is influenced by apoE affinities for lipoprotein receptor clearance pathways such as LDLR and LRP1. These data further suggest a competition for such receptors by apoE and Lp(a) that affect circulating Lp(a) levels. It may also explain the weak to modest inverse correlation noted with Lp(a) and triglycerides in this study and several other studies, with higher Lp(a) levels being associated with lower triglyceride levels.19, 20 Figure 3 represents a hypothetical construct of these relationships.
Figure 3.

Conceptual rendition of the potential role of apoE, LDLR, LRP1 in the catabolsim of Lp(a). ApoE on triglyceride-rich lipoproteins (TRLs) compete with Lp(a) for binding to LDLR and LRP1 on hepatocytes. (A) ApoE2 is the lower affinity isoform for LDLR and LRP1, which allow LDL and Lp(a) particles to clear faster. (B-C) Relatively high affinity isoforms, such as apoE4 and apoE3 favor hepatic clearance of TRLs via LDLR and LRP1 over LDL and Lp(a). This results in elevated LDL-C, apoB and Lp(a) levels. (C) ApoE4 partitions preferentially on TRLs and thus generates a bigger mass of lipoproteins to outcompete Lp(a) binding.
ApoE isoforms at the protein level are characterized by differences in 1 or 2 amino acids: ε3 has Cys-112 and Arg-158, ε4 has Arg-112 and Arg-158 and ε2 has Cys-112 and Cys-158. The LDLR binding activity for ε3 and ε4 is reported to be normal but ε2 has <2% of normal LDLR binding activity and is associated with recessive inheritance and low penetrance (10%).12, 21, 22 The binding of apoE proteins to LRP1 has not been well-studies, but ligand blotting experiments suggest that lipid-bound apoE2 has 30-50% of normal LRP1 binding activity.23 The defective binding of apoE2 to the LDLR results in clinical expression of type III hyperlipoproteinemia in the presence of another factor (diabetes, obesity, hypothyroidism or estrogen deficiency) that overwhelms the capacity of apoE2 to mediate remnant lipoprotein clearance due to increases in VLDL production or reduced LDLR expression. These amino acid differences also result in different affinities for triglyceride-rich lipoproteins that lead to different effects on remodeling of VLDL to LDL and in receptor-mediated remnant clearance.12, 24-30 The apoE4 protein is reported to prefer large, triglyceride-rich lipoproteins (VLDL and chylomicrons, while apoE3 and apoE2 proteins preferentially bind to small spherical HDL particles.31, 32 In that regard, the apoE4 isoform is associated with the lowest triglyceride levels but higher LDL-C. It is presumed that enrichment of apoE4 on VLDL accelerates its clearance from the circulation by liver LDLR, LRP1 and SDC1 consequently downregulating hepatic LDLR expression. In addition, the enrichment of apoE4 on VLDL can outcompete LDL binding to LDLR due to the 20-fold greater affinity of apoE3 and apoE4 for LDLR compared to apoB100, further increasing circulating LDL-C.9, 33
Controversy exists whether the LDLR is involved in clearance of Lp(a) and data from cell culture, animal and human studies have given conflicting results. Initial studies revealed that the clearance rate of Lp(a) was similar when radiolabeled Lp(a) is injected in very small numbers of human with homozygous or heterozygous familial hypercholesterolemia or mice with or without intact LDLR receptors.15, 34 Additionally, statins increase LDLR density but a seemingly paradoxical effect of statin-treatment on Lp(a) levels occurs and statins do not lower plasma Lp(a) levels. In fact, a recent analysis of 3896 patients on multiple statins as well as different doses of statins modestly raised mean Lp(a) levels by a mean of 11% and up to 50% in some studies.35 These studies argue against a major role of the LDLR in Lp(a) clearance.
However, Lp(a) was shown to compete for LDL for binding to human LDLR in intact fibroblasts and that overexpression of the human LDLR in mice led to faster clearance of Lp(a).36 Additionally, patients with familial hypercholesterolemia with abnormalities in the LDLR not only have higher LDL-C but also 1.5-2 times higher Lp(a) in a gene-dose relationship compared to their unaffected siblings.17, 18 These studies argue for a role of the LDLR in clearance of Lp(a). More recent cell culture studies have also had conflicting results, with one study showing that Lp(a) catabolism in human hepatoma cell lines and primary fibroblasts is inhibited by PCSK9 via the LDLR, which mediated the effects of PCSK9 on Lp(a) internalization.8 However, another study suggests the LDLR plays no role, but that PCSK9 may potentiate Lp(a) secretion, a pathway inhibited by PCSK9 antibodies.37 The current data also favor that the LDLR is involved in clearing Lp(a), but that this is also influenced by the underlying APOE genotype that also competes for the same receptor. However, it is not possible to quantitate this effect, or the effect of non-LDLR pathways, such as plasminogen and SRB1 receptors.7, 8
The apolipoprotein(a) molecule is large with molecular mass ∼200-900 KD and often larger than apolipoprotein B-100. It is covalently linked by a disulfide bond at cysteine number 4326 on apoB which is near the apoB docking site that binds to the LDLR. Thus, the apolipoprotein(a) of Lp(a) may cause the apoB of Lp(a) to be sterically hindered in its interaction with the LDLR and thus slow Lp(a)'s clearance. This is supported by the fact that Lp(a) has slower clearance rate than LDL, approximately a day longer with a fractional catabolic rate (FCR) of 0.22 pools/day versus FCR of 0.37 pools/day for LDL,38, 39 and that when apolipoprotein(a) synthesis is inhibited by antisense oligonucleotides (ASO), LDL-C is significantly reduced. The effect of the apolipoprotein(a) ASO on LDL is independent of effects on apoB synthesis and LDL- production,40, 41 which is in agreement with the different metabolic production routes for Lp(a) and LDL production.42
This study also demonstrates that LDL-C levels and apolipoprotein B-100 variables distribute in the same direction as Lp(a) mass and Lp(a)-C. Despite this, there is almost negligible correlation between Lp(a) and LDL-C or apoB due to different genetic influences in production of each. Despite the fact that Lp(a), unlike LDL, is not derived from a VLDL precursor the mechanisms associated with elevation of each may be similar. One may postulate that when apoE is present on larger chylomicron remnants and VLDL particles, it competes for binding to LDLR and LRP1, thereby slowing their clearance and leading to higher LDL-C and Lp(a) levels. When there is relatively high affinity for these receptors, such as apoE4(and apoE3, it leads to higher LDL-C, apoB and Lp(a). In contrast, when there is lower affinity, such as with apoE2, LDL and Lp(a) particles can clear faster. In addition, the slower conversion of VLDL to LDL with ε2 genotype, leads to lower LDL levels, which further enhances Lp(a) clearance due to less LDL competition. The additional increment in circulating Lp(a) levels in ε4/ε4 patients is likely explained by the fact the ε4 partitions preferentially on triglyceride-rich lipoproteins and thus generates a bigger mass of lipoproteins to outcompete Lp(a) binding.
It is also possible that LRP1 can be responsible for the observed apoE-Lp(a) correlation. The apoE2 isoform has negligible binding to LDLR (< 2% compared to ε3). If LDLR was responsible for our observed association one could expect to see a reduction in plasma Lp(a) and Lp(a)-cholesterol levels between ε3/ε3 and ε2/ε2 patients greater than the observed 27% and 14%. In contrast LDL-C, LDL-P and apoB levels, both cleared by LDLR, are 50-55% lower in ε2/ε2 patients. Binding of the ε2 isoform to LRP1 is only reduced by 50-70% and can possibly explain the less drastic reduction in Lp(a) levels in ε2/ε2 patients compared to LDL and apoB. The underlying mechanisms of elevation of Lp(a) in different APOE isoforms are evidently more complex and whether LDLR and LRP1 receptors pay a role in this relationship needs to be determined in experimental studies.
Limitations of this study are the lack of data on race and lipid-modifying therapies. This study provides a rationale to study the role of apoE in explaining differences in Lp(a) and in therapeutic interventions such as with PCSK9 inhibitors and antisense oligonucleotides to Lp(a) lowering.40, 43
Supplementary Material
Highlights.
Lp(a) levels were 65% higher in ε4/ε4 compared to ε2/ε2 genotypes.
LDL-C, apoB, directly measured Lp(a)-C, LDL-C corrected for Lp(a)-C content, LDL particle number and small dense LDL also had similar patterns.
Triglyceride and hsCRP levels were highest in ε2/ε2 and lowest in ε4/ε4 genotype.
These data suggest that circulating Lp(a) levels are not only genetically determined by hepatocyte apolipoprotein(a) synthesis, but can also be influenced by the APOE genotype possibly due to apoE isoform differences in lipoprotein clearance pathways.
Acknowledgments
none.
Funding source: Dr. Gordts is supported by the AHA grant 15BGIA25550111.
Dr Tsimikas is supported by NIH grants HL119828, HL055798, HL088093, HL106579, HL078610, and HL124174.
Abbreviations
- LDLR
LDL receptor
- LRP-1
LDL related protein-1
- CVD
cardiovascular disease
- CAVS
calcific aortic valve stenosis
- ApoE
Apolipoprotein E
- SDC1
syndecan-1
- hsCRP
high-sensitivity C-reactive protein
Footnotes
Disclosures: PMM is a speaker/consultant to Genzyme, Regeneron, Sanofi, Ionis, Amgen, Esperion, Aegerion, Kowa, Eliaz, Alexion, Lilly, Catabasis and Pfizer. SV and JPMcC are employees of Salveo Diagnostics. Dr. Gordts reports no conflicts. Dr. Tsimikas is a co-inventor and receives royalties from patents owned by the University of California San Diego and has a dual appointment at UCSD and Ionis Pharmaceuticals.
References
- 1.Kronenberg F. Human genetics and the causal role of Lipoprotein(a) for various diseases. Cardiovasc Drugs Ther. 2016;30:87–100. doi: 10.1007/s10557-016-6648-3. [DOI] [PMC free article] [PubMed] [Google Scholar]
- 2.Thanassoulis G. Lipoprotein (a) in calcific aortic valve disease: from genomics to novel drug target for aortic stenosis. J Lipid Res. 2016;57:917–924. doi: 10.1194/jlr.R051870. [DOI] [PMC free article] [PubMed] [Google Scholar]
- 3.Capoulade R, Chan KL, Yeang C, Mathieu P, Bosse Y, Dumesnil JG, Tam JW, Teo KK, Mahmut A, Yang X, Witztum JL, Arsenault BJ, Despres JP, Pibarot P, Tsimikas S. Oxidized phospholipids, lipoprotein(a), and progression of calcific aortic valve stenosis. J Am Coll Cardiol. 2015;66:1236–1246. doi: 10.1016/j.jacc.2015.07.020. [DOI] [PubMed] [Google Scholar]
- 4.Schmidt K, Noureen A, Kronenberg F, Utermann G. Structure, function, and genetics of lipoprotein (a) J Lipid Res. 2016;57:1339–1359. doi: 10.1194/jlr.R067314. [DOI] [PMC free article] [PubMed] [Google Scholar]
- 5.Hoover-Plow J, Huang M. Lipoprotein(a) metabolism: potential sites for therapeutic targets. Metabolism: Clin Exper. 2013;62:479–491. doi: 10.1016/j.metabol.2012.07.024. [DOI] [PMC free article] [PubMed] [Google Scholar]
- 6.Chennamsetty I, Claudel T, Kostner KM, Baghdasaryan A, Kratky D, Levak-Frank S, Frank S, Gonzalez FJ, Trauner M, Kostner GM. Farnesoid X receptor represses hepatic human APOA gene expression. J Clin Invest. 2011;121:3724–3734. doi: 10.1172/JCI45277. [DOI] [PMC free article] [PubMed] [Google Scholar]
- 7.Yang XP, Amar MJ, Vaisman B, Bocharov AV, Vishnyakova TG, Freeman LA, Kurlander RJ, Patterson AP, Becker LC, Remaley AT. Scavenger receptor-BI is a receptor for lipoprotein(a) J Lipid Res. 2013;54:2450–2457. doi: 10.1194/jlr.M038877. [DOI] [PMC free article] [PubMed] [Google Scholar]
- 8.Romagnuolo R, Scipione CA, Boffa MB, Marcovina SM, Seidah NG, Koschinsky ML. Lipoprotein(a) catabolism is regulated by proprotein convertase subtilisin/kexin type 9 through the low density lipoprotein receptor. J Biol Chem. 2015;290:11649–11662. doi: 10.1074/jbc.M114.611988. [DOI] [PMC free article] [PubMed] [Google Scholar]
- 9.Mahley RW. Apolipoprotein E: from cardiovascular disease to neurodegenerative disorders. J Mol Med (Berl) 2016;94:739–746. doi: 10.1007/s00109-016-1427-y. [DOI] [PMC free article] [PubMed] [Google Scholar]
- 10.Li J, Kanekiyo T, Shinohara M, Zhang Y, LaDu MJ, Xu H, Bu G. Differential regulation of amyloid-beta endocytic trafficking and lysosomal degradation by apolipoprotein E isoforms. J Biol Chem. 2012;287:44593–44601. doi: 10.1074/jbc.M112.420224. [DOI] [PMC free article] [PubMed] [Google Scholar]
- 11.Gonzales JC, Gordts PL, Foley EM, Esko JD. Apolipoproteins E and AV mediate lipoprotein clearance by hepatic proteoglycans. J Clin Invest. 2013;123:2742–2751. doi: 10.1172/JCI67398. [DOI] [PMC free article] [PubMed] [Google Scholar]
- 12.Huang Y. Mechanisms linking apolipoprotein E isoforms with cardiovascular and neurological diseases. Curr Opin Lipidol. 2010;21:337–345. doi: 10.1097/MOL.0b013e32833af368. [DOI] [PubMed] [Google Scholar]
- 13.de Knijff P, Kaptein A, Boomsma D, Princen HM, Frants RR, Havekes LM. Apolipoprotein E polymorphism affects plasma levels of lipoprotein(a) Atherosclerosis. 1991;90:169–174. doi: 10.1016/0021-9150(91)90111-f. [DOI] [PubMed] [Google Scholar]
- 14.Horita K, Eto M, Saito M, Nakata H, Iwashima Y, Ito H, Takahashi M, Kondo A, Morikawa A, Makino I. Effects of apolipoprotein E polymorphism on plasma lipoprotein(a) levels. Artery. 1993;20:324–336. [PubMed] [Google Scholar]
- 15.Rader DJ, Mann WA, Cain W, Kraft HG, Usher D, Zech LA, Hoeg JM, Davignon J, Lupien P, Grossman M, Wilson JM, Brewer HB. The low density lipoprotein receptor is not required for normal catabolism of Lp(a) in humans. J Clin Invest. 1995;95:1403–1408. doi: 10.1172/JCI117794. [DOI] [PMC free article] [PubMed] [Google Scholar]
- 16.Baudhuin LM, Hartman SJ, O'Brien JF, Meissner I, Galen RS, Ward JN, Hogen SM, Branum EL, McConnell JP. Electrophoretic measurement of lipoprotein(a) cholesterol in plasma with and without ultracentrifugation: comparison with an immunoturbidimetric lipoprotein(a) method. Clin Biochem. 2004;37:481–488. doi: 10.1016/j.clinbiochem.2004.02.001. [DOI] [PubMed] [Google Scholar]
- 17.Kraft HG, Lingenhel A, Raal FJ, Hohenegger M, Utermann G. Lipoprotein(a) in homozygous familial hypercholesterolemia. Arterioscler Thromb Vasc Biol. 2000;20:522–528. doi: 10.1161/01.atv.20.2.522. [DOI] [PubMed] [Google Scholar]
- 18.Alonso R, Andres E, Mata N, Fuentes-Jimenez F, Badimon L, Lopez-Miranda J, Padro T, Muniz O, Diaz-Diaz JL, Mauri M, Ordovas JM, Mata P, Investigators S. Lipoprotein(a) levels in familial hypercholesterolemia: an important predictor of cardiovascular disease independent of the type of LDL receptor mutation. J Am Coll Cardiol. 2014;63:1982–1989. doi: 10.1016/j.jacc.2014.01.063. [DOI] [PubMed] [Google Scholar]
- 19.Tsimikas S, Witztum JL, Miller ER, Sasiela WJ, Szarek M, Olsson AG, Schwartz GG. High-dose atorvastatin reduces total plasma levels of oxidized phospholipids and immune complexes present on apolipoprotein B-100 in patients with acute coronary syndromes in the MIRACL trial. Circulation. 2004;110:1406–1412. doi: 10.1161/01.CIR.0000141728.23033.B5. [DOI] [PubMed] [Google Scholar]
- 20.Tsimikas S, Clopton P, Brilakis ES, Marcovina SM, Khera A, Miller ER, de Lemos JA, Witztum JL. Relationship of oxidized phospholipids on apolipoprotein B-100 particles to race/ethnicity, apolipoprotein(a) isoform size, and cardiovascular risk factors: Results from the Dallas Heart Study. Circulation. 2009;119:1711–1719. doi: 10.1161/CIRCULATIONAHA.108.836940. [DOI] [PMC free article] [PubMed] [Google Scholar]
- 21.Toops KA, Tan LX, Lakkaraju A. Apolipoprotein E isoforms and AMD. Adv Exp Med Biol. 2016;854:3–9. doi: 10.1007/978-3-319-17121-0_1. [DOI] [PubMed] [Google Scholar]
- 22.Mahley RW. Apolipoprotein E: cholesterol transport protein with expanding role in cell biology. Science. 1988;240:622–630. doi: 10.1126/science.3283935. [DOI] [PubMed] [Google Scholar]
- 23.Kowal RC, Herz J, Weisgraber KH, Mahley RW, Brown MS, Goldstein JL. Opposing effects of apolipoproteins E and C on lipoprotein binding to low density lipoprotein receptor-related protein. J Biol Chem. 1990;265:10771–10779. [PubMed] [Google Scholar]
- 24.Wu G, Yuan J, Hunninghake DB. Effect of human apolipoprotein E isoforms on plasma lipids, lipoproteins and apolipoproteins in apolipoprotein E-deficient mice. Atherosclerosis. 1998;141:287–296. doi: 10.1016/s0021-9150(98)00182-8. [DOI] [PubMed] [Google Scholar]
- 25.Phillips MC. Apolipoprotein E isoforms and lipoprotein metabolism. IUBMB Life. 2014;66:616–623. doi: 10.1002/iub.1314. [DOI] [PubMed] [Google Scholar]
- 26.Knouff C, Hinsdale ME, Mezdour H, Altenburg MK, Watanabe M, Quarfordt SH, Sullivan PM, Maeda N. Apo E structure determines VLDL clearance and atherosclerosis risk in mice. J Clin Invest. 1999;103:1579–1586. doi: 10.1172/JCI6172. [DOI] [PMC free article] [PubMed] [Google Scholar]
- 27.Mamotte CD, Sturm M, Foo JI, van Bockxmeer FM, Taylor RR. Comparison of the LDL-receptor binding of VLDL and LDL from apoE4 and apoE3 homozygotes. Am J Physiol. 1999;276:E553–557. doi: 10.1152/ajpendo.1999.276.3.E553. [DOI] [PubMed] [Google Scholar]
- 28.Martins IJ, Hone E, Chi C, Seydel U, Martins RN, Redgrave TG. Relative roles of LDLr and LRP in the metabolism of chylomicron remnants in genetically manipulated mice. J Lipid Res. 2000;41:205–213. [PubMed] [Google Scholar]
- 29.van Dijk KW, van Vlijmen BJ, de Winther MP, van 't Hof B, van der Zee A, van der Boom H, Havekes LM, Hofker MH. Hyperlipidemia of ApoE2(Arg(158)-Cys) and ApoE3-Leiden transgenic mice is modulated predominantly by LDL receptor expression. Arterioscler Thromb Vasc Biol. 1999;19:2945–2951. doi: 10.1161/01.atv.19.12.2945. [DOI] [PubMed] [Google Scholar]
- 30.Mahley RW, Huang Y. Atherogenic remnant lipoproteins: role for proteoglycans in trapping, transferring, and internalizing. J Clin Invest. 2007;117:94–98. doi: 10.1172/JCI30889. [DOI] [PMC free article] [PubMed] [Google Scholar]
- 31.Steinmetz A, Jakobs C, Motzny S, Kaffarnik H. Differential distribution of apolipoprotein E isoforms in human plasma lipoproteins. Arteriosclerosis. 1989;9:405–411. doi: 10.1161/01.atv.9.3.405. [DOI] [PubMed] [Google Scholar]
- 32.Weisgraber KH. Apolipoprotein E distribution among human plasma lipoproteins: role of the cysteine-arginine interchange at residue 112. J Lipid Res. 1990;31:1503–1511. [PubMed] [Google Scholar]
- 33.Pitas RE, Innerarity TL, Arnold KS, Mahley RW. Rate and equilibrium constants for binding of apo-E HDLc (a cholesterol-induced lipoprotein) and low density lipoproteins to human fibroblasts: evidence for multiple receptor binding of apo-E HDLc. Proc Natl Acad Sci U S A. 1979;76:2311–2315. doi: 10.1073/pnas.76.5.2311. [DOI] [PMC free article] [PubMed] [Google Scholar]
- 34.Cain WJ, Millar JS, Himebauch AS, Tietge UJF, Maugeais C, Usher D, Rader DJ. Lipoprotein [a] is cleared from the plasma primarily by the liver in a process mediated by apolipoprotein [a] J Lipid Res. 2005;46:2681–2691. doi: 10.1194/jlr.M500249-JLR200. [DOI] [PubMed] [Google Scholar]
- 35.Yeang C, Hung MY, Byun YS, Clopton P, Yang X, Witztum JL, Tsimikas S. Effect of therapeutic interventions on oxidized phospholipids on apolipoprotein B100 and lipoprotein(a) J Clin Lipidol. 2016;10:594–603. doi: 10.1016/j.jacl.2016.01.005. [DOI] [PubMed] [Google Scholar]
- 36.Hofmann SL, Eaton DL, Brown MS, McConathy WJ, Goldstein JL, Hammer RE. Overexpression of human low density lipoprotein receptors leads to accelerated catabolism of Lp(a) lipoprotein in transgenic mice. J Clin Invest. 1990;85:1542–1547. doi: 10.1172/JCI114602. [DOI] [PMC free article] [PubMed] [Google Scholar]
- 37.Villard EF, Thedrez A, Blankenstein J, Croyal M, Tran TTT, Poirier B, Le Bail JC, Illiano S, Nobécourt E, Krempf M, Blom DJ, Marais AD, Janiak P, Muslin AJ, Guillot E, Lambert G. PCSK9 Modulates the Secretion But Not the Cellular Uptake of Lipoprotein(a) Ex Vivo. JACC: Basic to Translational Science. 2016;1:419. doi: 10.1016/j.jacbts.2016.06.006. [DOI] [PMC free article] [PubMed] [Google Scholar]
- 38.Jenner JL, Seman LJ, Millar JS, Lamon-Fava S, Welty FK, Dolnikowski GG, Marcovina SM, Lichtenstein AH, Barrett PH, deLuca C, Schaefer EJ. The metabolism of apolipoproteins (a) and B-100 within plasma lipoprotein (a) in human beings. Metabolism. 2005;54:361–369. doi: 10.1016/j.metabol.2004.10.001. [DOI] [PubMed] [Google Scholar]
- 39.Kesaniemi YA, Witztum JL, Steinbrecher UP. Receptor-mediated catabolism of low density lipoprotein in man. Quantitation using glucosylated low density lipoprotein. J Clin Invest. 1983;71:950–959. doi: 10.1172/JCI110849. [DOI] [PMC free article] [PubMed] [Google Scholar]
- 40.Viney NJ, van Capelleveen JC, Geary RS, Xia S, Tami JA, Yu RZ, Marcovina SM, Hughes SG, Graham MJ, Crooke RM, Crooke ST, Witztum JL, Stroes ES, Tsimikas S. Antisense oligonucleotides targeting apolipoprotein(a) in people with raised lipoprotein(a): two randomised, double-blind, placebo-controlled, dose-ranging trials. Lancet. 2016;388:2239–2253. doi: 10.1016/S0140-6736(16)31009-1. [DOI] [PubMed] [Google Scholar]
- 41.Graham MJ, Viney N, Crooke RM, Tsimikas S. Antisense inhibition of apolipoprotein (a) to lower plasma lipoprotein (a) levels in humans. J Lipid Res. 2016;57:340–351. doi: 10.1194/jlr.R052258. [DOI] [PMC free article] [PubMed] [Google Scholar]
- 42.Frischmann ME, Ikewaki K, Trenkwalder E, Lamina C, Dieplinger B, Soufi M, Schweer H, Schaefer JR, Konig P, Kronenberg F, Dieplinger H. In vivo stable-isotope kinetic study suggests intracellular assembly of lipoprotein(a) Atherosclerosis. 2012;225:322–327. doi: 10.1016/j.atherosclerosis.2012.09.031. [DOI] [PubMed] [Google Scholar]
- 43.Tsimikas S, Viney NJ, Hughes SG, Singleton W, Graham MJ, Baker BF, Burkey JL, Yang Q, Marcovina SM, Geary RS, Crooke RM, Witztum JL. Antisense therapy targeting apolipoprotein(a): a randomised, double-blind, placebo-controlled phase 1 study. Lancet. 2015;386:1472–1483. doi: 10.1016/S0140-6736(15)61252-1. [DOI] [PubMed] [Google Scholar]
Associated Data
This section collects any data citations, data availability statements, or supplementary materials included in this article.