Abstract
Objectives
Management of abdominal aortic aneurysms (AAAs) is based on diameter. CT angiography (CTA) is commonly used, but requires radiation and iodinated contrast. Non-contrast MRI is an appealing alternative that may allow better characterization of intraluminal thrombus (ILT). This study aims to 1) validate non-contrast MRI for measuring AAA diameter, and 2) to assess ILT with CTA and MRI.
Method
28 patients with AAAs (diameter 50.7 ± 12.3 mm) underwent CTA and non-contrast MRI. MRI was acquired at 3 T using 1) a conventional 3D gradient echo (GRE) sequence and 2) a 3D T1-weighted black blood fast-spin-echo sequence. Two radiologists independently measured the AAA diameter. The ratio of signal of ILT and adjacent psoas muscle (ILTr = signalILT/signalMuscle) was quantified.
Results
Strong agreement between CTA and non-contrast MRI was shown for AAA diameter (intra-class coefficient > 0.99). Both approaches had excellent inter-observer reproducibility (ICC > 0.99). ILT appeared homogenous on CTA, whereas MRI revealed compositional variations. Patients with AAAs ≥5.5 cm and <5.5 cm had a variety of distributions of old/fresh ILT types.
Conclusions
Non-contrast 3D black blood MRI provides accurate and reproducible AAA diameter measurements as validated by CTA. It also provides unique information about ILT composition, which may be linked with elevated risk for disease progression.
Keywords: Abdominal aortic aneurysm surveillance, CT angiography, Non-contrast MRI, Intraluminal thrombus composition, Diameter measurement
Introduction
In individuals > 65 years of age, abdominal aortic aneurysms (AAAs) have a prevalence of roughly 5 % in men and 1 % in women, and result in up to 14,000 deaths per year in the United States [1, 2]. Rupture risk increases with aneurysm size [3]. The threshold for intervention is a diameter of 5.5 cm, or if rapid growth is seen (>1 cm/year) [3]. Consequently, management of small AAAs (3–5.5 cm) requires regular imaging surveillance of the vessel diameter. The majority of patients with AAAs are followed with surveillance programs [3].
Ultrasound (US) is the most common surveillance modality for small AAAs because it is cheap, non-invasive and widely available. It is limited, however, by significant inter-operator variability [4]. Computed tomography angiography (CTA) is the gold standard for AAA imaging due to its high resolution and excellent image quality, but requires ionizing radiation and iodinated contrast, which may carry risk in prolonged surveillance and in the setting of chronic renal insufficiency. Non-contrast MRI is a promising alternative as it does not require radiation or iodinated contrast, and has excellent soft tissue contrast that allows characterization of the aortic wall and intra-luminal thrombus (ILT) [5]. ILT is a common feature in AAAs and has been studied as a potential marker of progressive AAA disease [5–10]. Thick ILT can induce localized hypoxia and inflammation, and weaken the arterial wall [11, 12], and biochemical mechanisms of permanent thrombolysis of ILT can also induce AAA progression [13, 14]. A recent study used gradient echo (GRE) MRI to identify fresh ILT (hyper-intense signal), and showed AAAs with fresh ILT grow two times faster compared to those without [5]. As the composition of ILT is poorly visualized on CT, MRI could provide unique insight by better characterizing ILT. Most publications that describe the use of MRI for AAA evaluation have limited coverage and coarse through-plane resolution (4–5 mm) [5, 15, 16] We recently developed a 3D black blood non-contrast MRI technique that allows high-resolution (1.3 mm) isotropic imaging of the lumen and wall with evaluation of ILT composition within a clinically acceptable time (7 minutes) [17]
This study aims to 1) validate the accuracy of 3D black blood MRI for quantifying AAA diameter, using CTA as a reference standard, and 2) to evaluate the ability of black blood MRI to characterize ILT composition using a GRE sequence as a reference, and preliminarily investigate ILT composition in patients with large (≥5.5 cm) versus small (<5.5 cm) AAAs.
Materials and methods
Study population
From August 2014 to November 2015, patients with AAA disease (>3 cm in diameter as identified on either ultrasound or CT) were recruited at two centres, one in the United States, the other in China. Patients were included in the analysis if they underwent both MRI and CTA examination within 3 months. Patient studies were conducted following human subjects’ approval of the IRB of the University of California San Francisco or the Ethics Committee of Changhai Hospital. All subjects gave informed written consent for study participation.
Magnetic resonance imaging
All MRI examinations were performed on 3 T whole-body systems (MAGNETOM Skyra, Siemens Healthcare, Erlangen, Germany) using a 32-channel body coil and a spine array coil. A 3D T1 weighted black blood sequence (fast-spin-echo with variable refocusing flip angle train, SPACE) with blood suppression preparation (DANTE) [18] as developed by our group was acquired in the coronal plane covering the abdominal aorta from the renal arteries to the aortic bifurcation [17]. Acquisition parameters were as follows: TR/TE = 800 ms/20 ms; 32 × 32-cm2 field of view (FOV); 52 coronal slices; echo train length 60; resolution was 1.3 mm isotropic with a scan time of 7 minutes (during free breathing). As a reference, a clinical 3D T1 weighted fast gradient-echo (GRE) sequence (volumetric interpolated breath-hold examination, VIBE) was also acquired with the following parameters: 80 coronal slices with 2.6-mm slice thickness (interpolated to 1.3 mm by k-space zero filling); 24 × 40-cm2 FOV and 1.3-mm in-plane resolution; TR/TE = 2.5 ms/1.2 ms; flip angle 9°; scan time 17 seconds (one breath-hold). Reconstructed resolution was identical to that of the black blood sequence (1.3 mm isotropic) with two-fold interpolation in the slice direction.
CT angiography
CTA images were acquired on clinical 128- to 320-slice CT scanners: GE Discovery CT750 HD (GE Healthcare, Cleveland, OH, USA), Toshiba Aquilion One (Toshiba Healthcare, Otawara, Japan) or Philips Brilliance 16P (Philips Medical Systems, Best, The Netherlands). All images were acquired with standard clinical protocols with 1.0- to 2.5-mm axial slice thickness (0.8- to 2.5-mm gap) and inplane resolution of 0.7–1.0 mm.
AAA diameter measurement
Two radiologists independently measured the maximal diameter of the AAAs using a multi-planar reconstruction (MPR) method on both the black blood MRI images and the CTA images. Before measurement, the MRI and CTA images were anonymized into numbers and were randomly sorted. Both reviewers were blinded to the patient information. MPR was used to generate slices perpendicular to the central line of the aorta, and the readers made measurements on several of these transverse images to determine the maximal aneurysm diameter (from outer wall to outer wall).
ILT characterization using MRI
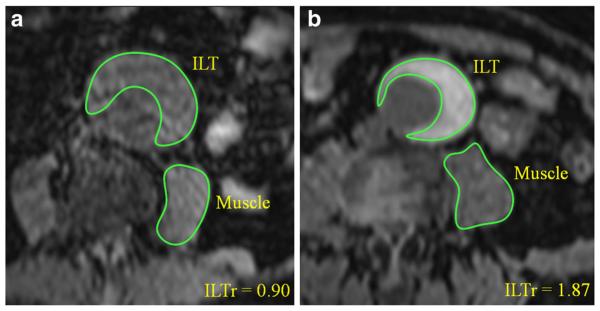
ILT and psoas muscle signal intensities were quantified at the location of the maximal AAA diameter on both black blood and GRE images. ILT signal ratio (ILTr) was calculated as signalILT/signalmuscle. Figure 1 shows how the signal intensities of ILT and psoas muscle were measured. ILT was characterized as fresh (hyper-intense, ILTr > 1.2) or old (iso-intense, ILTr < 1.2) as reported in the literature [5]. The detection of fresh ILT and quantitative ILTr measurements were compared between black blood and GRE methods.
Fig. 1.
Measurement of ILT and psoas muscle signal intensities (on GRE images). a A patient with old ILT (ILTr < 1.2) and b) with fresh ILT (ILTr > 1.2)
Based on the volume distribution of ILT on the black blood MRI, four types of ILT categories were defined: Type 1: Dominantly fresh ILT (old ILT < 25 %); Type 2: Mixture of both fresh and old ILT (fresh ILT was present and old ILT > 25 %); Type 3: Old ILT (only old ILT was present); Type 4: No ILT. The percentage of ILT covering the AAA wall was also classified in four categories: 0–25 %, 25–50 %, 50–75 % and 75–100 %. Patients were divided into two groups by AAA diameter: Group 1: AAAs < 5.5 cm; Group 2: AAAs > = 5.5 cm (intervention needed). ILT characteristics in these two patient groups were analysed.
Statistics
Normality assumptions were formally assessed using the Shapiro–Wilk’s test. Distributions were summarized using the median [inter-quartile range (IQR)] or the mean ± standard deviation (SD). Differences between the diameter measurements using black blood MRI and CTA and between the two observers were assessed using the Bland–Altman analysis [19]. The mean of the pair wise differences was reported as bias and the 95 % limits of agreement (LOA = bias ± 1.96 × SD). The intra-class correlation coefficient (ICC) was used to quantify the agreement. Measurement error was quantified by coefficient of variance (CV; CV = SD between measurements/mean × 100 %). Cohen’s kappa (k) was used to determine the agreement of fresh ILT detection using black blood and GRE sequences. Pearson’s r was used to evaluate the ILTr quantification using different MRI methods. Fisher’s exact test was used to evaluate the ILT character differences between patient groups. A p value of less than 0.05 was considered significant. All p values were two-sided. GraphPad Prism 5 (GraphPad Software Inc., CA, USA) and R Statistics (version 3.1.3, www.r-project.org) were used for data analysis.
Results
28 AAA patients (24 male, age 71.8 ± 7.6) who underwent MRI and CTA within 3 months (average interval of 11 days) were selected in the analysis from the Veteran Affairs Medical Center in San Francisco, USA (n = 8) and Changhai Hospital of Shanghai, China (n = 20). The interval between MRI and CTA ranged 0 to 77 days, with intervals greater than one month in only 3 patients scans (44, 49 and 77 days). As the majority of our study cohort were asymptomatic patients with small AAAs who had low progression rates [20], we assumed that there would not be significant change of diameter/ILT over this relatively short interval. Patient demographics are summarized in Table 1.
Table 1.
Patient demographics
| All (n = 28) | <5.5 cm (n = 20) | >5.5 cm (n= 8) | p value | |
|---|---|---|---|---|
| Age, mean ± SD | 71.8±7.6 | 73.4±9.3 | 71.2 ± 6.9 | 0.58 |
| Male, n, % | 24 (85.7) | 16 (80) | 8 (100) | 0.29 |
| Hypertensiona, n, % | 21 (75) | 14 (70) | 7 (87.5) | 0.63 |
| DMb, n, % | 5 (17.9) | 5 (25) | 0 (0) | 0.28 |
| Hyperlipidemia, n, % | 10 (35.7) | 7 (35) | 3 (37.5) | 1.00 |
| Smoking, n, % | 12 (42.9) | 10 (50) | 2 (25) | 0.40 |
| CADc, n, % | 8 (28.6) | 6 (30) | 2 (25) | 1.00 |
Hypertension is defined as resting blood pressure >140/90 mmHg;
Diabetes mellitus;
Coronary artery disease.
AAA diameter measurement
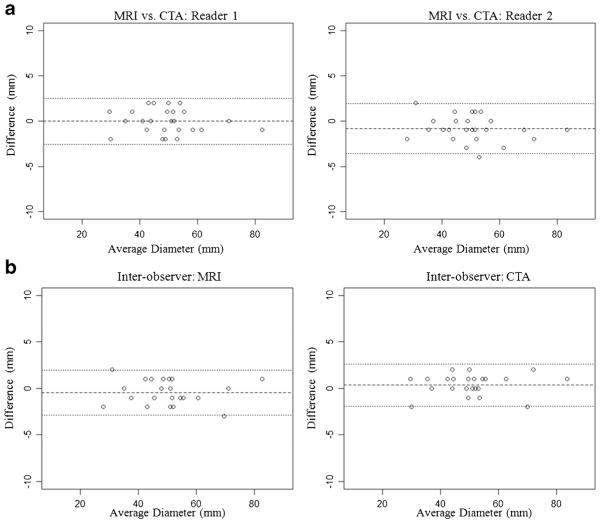
Diameter measurements using black blood MRI and CTA are summarized in Table 2, and the Bland–Altman plots are shown in Fig. 2. There was excellent agreement between MRI and CTA with ICCs > 0.99 and CVs < 2.8 %. Both modalities had excellent inter-observer reproducibility with ICCs > 0.99 and CVs < 2.5 %.
Table 2.
Summary of the inter-modality (a) and inter-observer (b) agreement for AAA diameter measurements
| a) Inter-modality agreement | |||||||
| Diameter on MRI (mm) | Diameter on CTA (mm) | SDa (between methods) | CVb | Bias | LOAc | ICCd | |
| Reader 1 | 49.8± 12.0 | 50.7 ± 12.3 | 1.4 | 2.8 % | −0.8 | (−3.6, 1.9) | 0.991 |
| Reader 2 | 50.3± 12.1 | 50.3 ± 12.2 | 1.3 | 2.6 % | −0.04 | (−2.6, 2.5) | 0.994 |
| b) Inter-observer agreement | |||||||
| Reader 1 (mm) | Reader 2 (mm) | SDa (between readers) | CVb | Bias | LOAc | ICCd | |
| MRI | 49.8± 12.0 | 50.3 ± 12.1 | 1.2 | 2.5 % | 0.5 | (−2.0, 2.9) | 0.994 |
| CTA | 50.7± 12.3 | 50.3 ± 12.2 | 1.2 | 2.3 % | −0.3 | (−2.6, 1.9) | 0.995 |
standard deviation;
coefficient of variance;
limit of agreement;
intra-class coefficient.
Fig. 2.
a Comparison between MRI and CTA for the diameter measurements of AAA. b Interobserver agreement of diameter measurements using MRI and CTA
ILT characterization
26/28 patients were found to have ILT (Figs. 3, 4 and 5). ILT attenuation was homogeneous at CTA in all cases, precluding further characterization. Excluding the 2 patients without ILT, and 6 patients who were not scanned with GRE imaging, there were 20 pairs of black blood and GRE datasets available for comparison. Both black blood and GRE MRI allowed differentiation of fresh from old ILT. There was excellent agreement (90 %, 18/20) between the two MRI methods for fresh ILT detection (k = 0.69). Only two patients showed disagreements: two AAAs with isointense signals (old ILT) on black blood images appeared brighter on GRE images (fresh ILT). There was moderate agreement between the ILTr quantification (r = 0.31). ILT characteristics are summarized in Table 3.
Fig. 3.
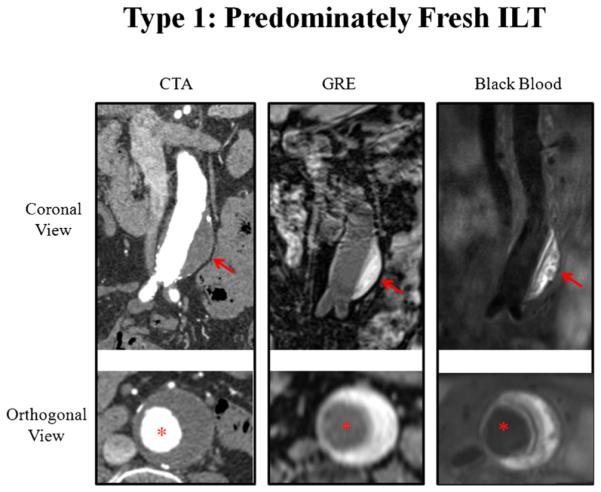
A patient with type 1 intra-luminal thrombus (predominately fresh ILT). Hyperintense signal (compared with muscle) of the ILT is shown on black blood and GRE images, while CTA shows homogenous attenuation. Red arrows show the ILT. Red asterisks show the aorta lumen
Fig. 4.
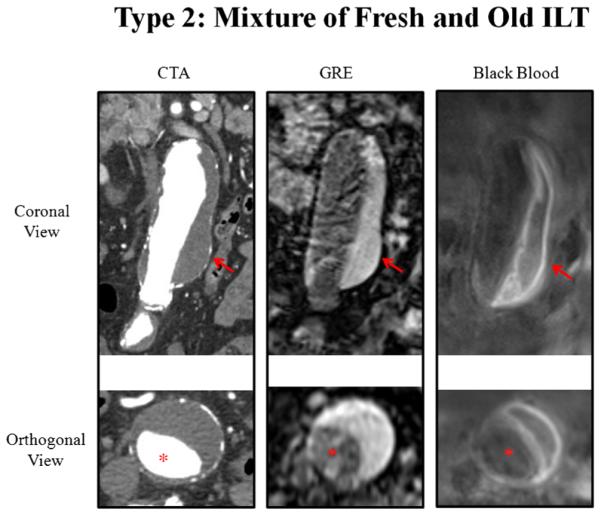
A patient with type 2 intra-luminal thrombus (mixture of fresh and old ILT). Hyperintense and hypointense signals of the ILT are exhibited with black blood MRI; only a bright signal is evident by GRE; homogenous attenuation is seen with CTA. Red arrows show the ILT. Red asterisks show the aorta lumen
Fig. 5.
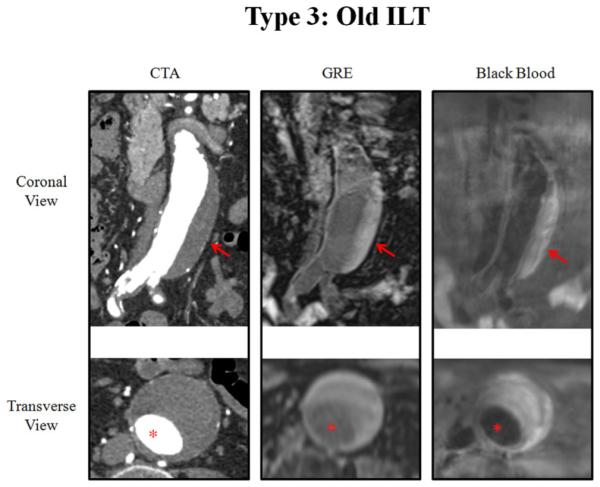
A patient with type 3 intra-luminal thrombus (only old ILT). An iso-intense signal of the ILT is shown by MRI, and homogenous attenuation is shown by CTA. Red arrows show the ILT. Red asterisks show the aorta lumen
Table 3.
Intra-luminal thrombus (ILT) type distributions
| All (n = 28) | <5.5 cm (n = 20) | >5.5 cm (n = 8) | p value | ||
|---|---|---|---|---|---|
| ILT composition type | Type 1: Fresh , n, % | 10 (35.7) | 8 (40) | 2 (25) | 0.67 |
| Type 2: Mixture, n, % | 9 (32.1) | 4 (20) | 5 (62.5) | 0.07 | |
| Sum of types 1 and 2, n, % | 19 (67.9) | 12 (60) | 7 (87.5) | 0.21 | |
| Type 3: Old, n, % | 7 (25) | 6 (30) | 1 (12.5) | 0.63 | |
| Type 4: No, n, % | 2 (7.1) | 2 (10) | 0 (0) | 1.00 | |
| Sum of types 3 and 4, n, % | 9 (32.1) | 8 (40) | 1 (12.5) | 0.21 | |
| ILT coverage percentage (%) | 0–25 | 7 (25) | 7 (35) | 0 (0) | 0.07 |
| 25–50 | 3 (10.7) | 3 (15) | 0 (0) | 0.54 | |
| Sum of 0–50 | 10 (35.7) | 10 (50) | 0 (0) | 0.03* | |
| 50–75 | 8 (28.6) | 6 (30) | 2 (25) | 1.00 | |
| 75–100 | 10 (35.7) | 4 (20) | 6 (75) | 0.01* | |
| Sum of 50–100 | 18 (64.3) | 10 (50) | 8 (100) | 0.03* |
significant difference.
In our preliminary investigation of ILT types in patients with AAAs ≥ 5.5 versus < 5.5 cm, we found a range of ILT distributions (Table 3); due to the limited number of patients in each category, the statistical significances of these findings were borderline at best. All AAAs ≥ 5.5 cm contained > 50 % ILT ( 8/8), whereas only half of AAAs < 5 .5 cm contained > 50 % ILT (10/20; p = 0.03).
Discussion
Non-contrast MRI was accurate and reproducible for AAA dimension measurements, using CTA as a reference standard. A high-resolution 3D black blood MRI sequence was shown to be reliable for ILT characterization compared to an established GRE method. The advantage of MRI over CTA is that 1) it does not require radiation or contrast administration and 2) it can differentiate between different intraluminal thrombus (ILT) components, which may be useful for improved risk stratification of patients [5].
AAA diameter is currently the primary metric used for clinical management decisions. Patients with small AAAs (<5.5 cm) are routinely monitored with ultrasound or CTA. Ultrasound can be problematic because of large measurement variations (up to 5–10 mm) and operator dependence [4]. CTA requires ionizing radiation and iodinated contrast. MRI is an attractive alternative for serial AAA monitoring because it provides the same cross-sectional analysis as CTA without requiring radiation or the use of contrast agents. Non-contrast MRI is especially useful in patients with poor renal function who may not tolerate iodinated or gadolinium-based contrast agents [21]. Studies have shown good agreement between non-contrast MRI and CTA for AAA diameters, but have used relatively coarse, 2D gradient-recalled echo (GRE) sequences [22].
Although the use of diameter for the management of AAA is established and straightforward to use clinically, it has some limitations. A large fraction of AAAs ≥ 5.5 cm never rupture, while some AAAs < 5.5 cm do rupture [23]. Considerable research effort has been devoted to finding markers of progressive AAA disease other than diameter, including ILT area/volume [7, 24], ILT distribution and coverage over the wall [8, 10], ILT age [5], vascular inflammation [15, 25], biochemical mechanisms of permanent thrombolysis of ILT [13, 14] and mechanical stress within the AAA wall [9, 26].
A recent study used a 3D T1-weighted GRE MRI sequence to identify fresh ILT (hyper-intense signal) with histological validation, and found AAAs with fresh ILT grew two times as fast as AAAs without fresh ILT [5].
Whereas ILT appeared homogenous in all cases on CTA, MRI revealed a more complex architecture. High-resolution black blood and conventional GRE MRI of ILT composition was evaluated in this study. Fresh ILT was found to be focal in some cases, and diffuse in others; in some patients it was peripheral, juxta-luminal or at the thrombus centre (Figs. 3–5). How these features may correlate with the progression of AAA disease is unknown. We found the ILT composition types had a variety of distributions in small and large aneurysms (Table 3). Similarly, we found increased coverage of the AAA wall by ILT (>50 %) in aneurysms ≥ 5.5 cm. Increased wall coverage may correlate with faster AAA growth [8], possibly because of hypoxia of the underlying AAA wall [11]. Previous preliminary studies suggest that ILT characterization may be useful for risk stratification [5]. The unique ILT structures revealed in this study need to be tested in longitudinal studies to determine any relationship with disease progression.
Non-contrast CT may better characterize ILT than CTA, which was used in this study. Specifically, hyperdense thrombus best seen with non-contrast CT is associated with AAA rupture [27], but the cohort we studied were asymptomatic patients undergoing routine surveillance, so we assumed this finding would be very uncommon. As we have demonstrated, MRI clearly reveals more about thrombus architecture than CT.
The black blood MRI sequence used here has four times the resolution of conventional GRE (1.3 mm isotropic versus 1.5 × 1.1 × 5 mm3) [5] and twice the resolution of the 3D GRE sequence used in this study (1.3 × 1.3 × 2.6 mm3). Black blood MRI had excellent contrast between the ILT and lumen, while the lumen boundaries in GRE images were often not clear when old ILT (iso-intense signal) was present near the lumen (Fig. 5). Compared with the GRE sequence, our T1-weighted black blood sequence had sufficient T1 contrast to characterize the fresh ILT (Fig. 3). However, only a moderate correlation was found between the ILT ratio measurements. Possible explanations for this lack of strong correlation include 1) the long echo train (>100 ms) of our fast spin echo (FSE)-based black blood sequence may induce some T2 contrast [28], and 2) the partial volume effect of the GRE sequence may alter signal intensities. ILT, as a consequence, may have relatively reduced signal intensity on FSE images [29, 30]. The disadvantage of our black blood MRI sequence compared with GRE is the longer scan time (~7 minutes); however, it did not affect current study, as all patients finished the scans successfully. Technical development with advanced acceleration techniques such as parallel imaging and compressed sensing should be investigated and validated in future studies. They have the potential to reduce scan time and improve patient comfort, while maintaining good image quality.
Mechanical stress simulation of AAAs may be improved by the analysis of ILT architecture provided by MRI. Wall stress within the AAA has been studied as a potential marker of AAA growth or rupture [9, 26]. Previous studies have used geometry reconstructed from CTA images, and assigned uniform material properties to ILT, which is likely incorrect. Results from ex vivo material testing of AAA specimens showed that material properties of ILTs differ depending on their composition [31, 32]. A previous study on carotid atherosclerotic plaque showed the age of intraplaque haemorrhage can influence the structural stress within a plaque by 30 % [33]. These findings strongly suggest that the use of spatially resolved ILT material properties in computational mechanics simulations may improve the accuracy of AAA wall stress estimates.
Our study has several limitations. First, although the sample size is sufficient for diameter quantification given the small measurement errors of both CTA and MRI, the number of patients studied for ILT type classification is small. Our preliminary observations regarding the ILT types need to be validated in larger studies. Second, no histologic validation was possible in our current population, as all patients with AA As ≥ 5.5 cm u nderwent endovascular therapy. Nevertheless, GRE sequences have been validated by histology in prior work [5], and our black blood method showed good agreement with the GRE method. Third, we do not report outcomes data. Longitudinal studies should be undertaken to determine the relationship between ILT composition and progressive AAA disease, and how ILT features may change over time.
In conclusion, non-contrast black blood MRI provides accurate and reproducible AAA diameter measurements as validated by CTA. It also provides unique information about ILT composition, which may be linked with disease progression.
Key Points.
Non-contrast MRI is an appealing alternative to CTA for AAA management.
Non-contrast MRI can accurately measure AAA diameters compared to CTA.
MRI affords unique characterization of intraluminal thrombus composition.
Acknowledgments
The scientific guarantor of this publication is Michael D. Hope. The authors of this manuscript declare no relationships with any companies whose products or services may be related to the subject matter of the article. This study has received funding by United States National Institutes of Health (NIH) grants R01HL114118 and R01HL123759. No complex statistical methods were necessary for this paper. Institutional Review Board approval was obtained. Written informed consent was obtained from all subjects (patients) in this study.
Methodology: retrospective, observational, multicenter study
Abbreviations and acronyms
- AAA
Abdominal aortic aneurysm
- CTA
Computed tomography angiography
- ILT
Intra-luminal thrombus
- GRE
Gradient echo
- FOV
Field of view
- MPR
Multi-planar reconstruction
- ICC
Intra-class correlation coefficient
- CV
Coefficient of variance
- LOA
Limits of agreement FSE Fast spin echo
References
- 1.Kent KC, Zwolak RM, Egorova NN, et al. Analysis of risk factors for abdominal aortic aneurysm in a cohort of more than 3 million individuals. J Vasc Surg. 2010;52:539–548. doi: 10.1016/j.jvs.2010.05.090. [DOI] [PubMed] [Google Scholar]
- 2.Derubertis BG, Trocciola SM, Ryer EJ, et al. Abdominal aortic aneurysm in women: prevalence, risk factors, and implications for screening. J Vasc Surg. 2007;46:630–635. doi: 10.1016/j.jvs.2007.06.024. [DOI] [PubMed] [Google Scholar]
- 3.LeFevre ML. Screening for abdominal aortic aneurysm: U.S. Preventive Services Task Force recommendation statement. Ann Intern Med. 2014;161:281–290. doi: 10.7326/M14-1204. [DOI] [PubMed] [Google Scholar]
- 4.Beales L, Wolstenhulme S, Evans JA, West R, Scott DJ. Reproducibility of ultrasound measurement of the abdominal aorta. Br J Surg. 2011;98:1517–1525. doi: 10.1002/bjs.7628. [DOI] [PubMed] [Google Scholar]
- 5.Nguyen VL, Leiner T, Hellenthal FA, et al. Abdominal aortic aneurysms with high thrombus signal intensity on magnetic resonance imaging are associated with high growth rate. Eur J Vasc Endovasc Surg. 2014;48:676–684. doi: 10.1016/j.ejvs.2014.04.025. [DOI] [PubMed] [Google Scholar]
- 6.Behr-Rasmussen C, Grondal N, Bramsen MB, Thomsen MD, Lindholt JS. Mural thrombus and the progression of abdominal aortic aneurysms: a large population-based prospective cohort study. Eur J Vasc Endovasc Surg. 2014;48:301–307. doi: 10.1016/j.ejvs.2014.05.014. [DOI] [PubMed] [Google Scholar]
- 7.Stenbaek J, Kalin B, Swedenborg J. Growth of thrombus may be a better predictor of rupture than diameter in patients with abdominal aortic aneurysms. Eur J Vasc Endovasc Surg. 2000;20:466–469. doi: 10.1053/ejvs.2000.1217. [DOI] [PubMed] [Google Scholar]
- 8.Wolf YG, Thomas WS, Brennan FJ, Goff WG, Sise MJ, Bernstein EF. Computed tomography scanning findings associated with rapid expansion of abdominal aortic aneurysms. J Vasc Surg. 1994;20:529–535. doi: 10.1016/0741-5214(94)90277-1. discussion 535–528. [DOI] [PubMed] [Google Scholar]
- 9.Speelman L, Schurink GW, Bosboom EM, et al. The mechanical role of thrombus on the growth rate of an abdominal aortic aneurysm. J Vasc Surg. 2010;51:19–26. doi: 10.1016/j.jvs.2009.08.075. [DOI] [PubMed] [Google Scholar]
- 10.Metaxa E, Kontopodis N, Tzirakis K, Ioannou CV, Papaharilaou Y. Effect of intraluminal thrombus asymmetrical deposition on abdominal aortic aneurysm growth rate. J Endovasc Ther. 2015;22:406–412. doi: 10.1177/1526602815584018. [DOI] [PubMed] [Google Scholar]
- 11.Vorp DA, Lee PC, Wang DH, et al. Association of intraluminal thrombus in abdominal aortic aneurysm with local hypoxia and wall weakening. J Vasc Surg. 2001;34:291–299. doi: 10.1067/mva.2001.114813. [DOI] [PubMed] [Google Scholar]
- 12.Kazi M, Thyberg J, Religa P, et al. Influence of intraluminal thrombus on structural and cellular composition of abdominal aortic aneurysm wall. J Vasc Surg. 2003;38:1283–1292. doi: 10.1016/s0741-5214(03)00791-2. [DOI] [PubMed] [Google Scholar]
- 13.Martinez-Pinna R, Madrigal-Matute J, Tarin C, et al. Proteomic analysis of intraluminal thrombus highlights complement activation in human abdominal aortic aneurysms. Arterioscler Thromb Vasc Biol. 2013;33:2013–2020. doi: 10.1161/ATVBAHA.112.301191. [DOI] [PubMed] [Google Scholar]
- 14.Nchimi A, Courtois A, El Hachemi M, et al. Multimodality imaging assessment of the deleterious role of the intraluminal thrombus on the growth of abdominal aortic aneurysm in a rat model. Eur Radiol. 2016;26:2378–2386. doi: 10.1007/s00330-015-4010-y. [DOI] [PubMed] [Google Scholar]
- 15.Richards JM, Semple SI, MacGillivray TJ, et al. Abdominal aortic aneurysm growth predicted by uptake of ultrasmall superparamagnetic particles of iron oxide: a pilot study. Circ Cardiovasc Imaging. 2011;4:274–281. doi: 10.1161/CIRCIMAGING.110.959866. [DOI] [PubMed] [Google Scholar]
- 16.Veldhoen S, Behzadi C, Derlin T, et al. Exact monitoring of aortic diameters in Marfan patients without gadolinium contrast: intraindividual comparison of 2D SSFP imaging with 3D CE-MRA and echocardiography. Eur Radiol. 2015;25:872–882. doi: 10.1007/s00330-014-3457-6. [DOI] [PubMed] [Google Scholar]
- 17.Zhu C, Haraldsson H, Faraji F, et al. Isotropic 3D black blood MRI of abdominal aortic aneurysm wall and intraluminal thrombus. Magn Reson Imaging. 2016;34:18–25. doi: 10.1016/j.mri.2015.10.002. [DOI] [PMC free article] [PubMed] [Google Scholar]
- 18.Li L, Miller KL, Jezzard P. DANTE-prepared pulse trains: a novel approach to motion-sensitized and motion-suppressed quantitative magnetic resonance imaging. Magn Reson Med. 2012;68:1423–1438. doi: 10.1002/mrm.24142. [DOI] [PubMed] [Google Scholar]
- 19.Bland JM, Altman DG. Statistical methods for assessing agreement between two methods of clinical measurement. Lancet. 1986;1:307–310. [PubMed] [Google Scholar]
- 20.Brady AR, Thompson SG, Fowkes FG, Greenhalgh RM, Powell JT. Abdominal aortic aneurysm expansion: risk factors and time intervals for surveillance. Circulation. 2004;110:16–21. doi: 10.1161/01.CIR.0000133279.07468.9F. [DOI] [PubMed] [Google Scholar]
- 21.Kuo PH, Kanal E, Abu-Alfa AK, Cowper SE. Gadolinium-based MR contrast agents and nephrogenic systemic fibrosis. Radiology. 2007;242:647–649. doi: 10.1148/radiol.2423061640. [DOI] [PubMed] [Google Scholar]
- 22.Goshima S, Kanematsu M, Kondo H, et al. Preoperative planning for endovascular aortic repair of abdominal aortic aneurysms: feasibility of nonenhanced MR angiography versus contrast-enhanced CT angiography. Radiology. 2013;267:948–955. doi: 10.1148/radiol.13121557. [DOI] [PubMed] [Google Scholar]
- 23.Guirguis-Blake JM, Beil TL, Senger CA, Whitlock EP. Ultrasonography screening for abdominal aortic aneurysms: a systematic evidence review for the U.S. Preventive Services Task Force. Ann Intern Med. 2014;160:321–329. doi: 10.7326/M13-1844. [DOI] [PubMed] [Google Scholar]
- 24.den Hartog AW, Franken R, de Witte P, et al. Aortic disease in patients with Marfan syndrome: aortic volume assessment for surveillance. Radiology. 2013;269:370–377. doi: 10.1148/radiology.13122310. [DOI] [PubMed] [Google Scholar]
- 25.Hope MD, Hope TA, Zhu C, et al. Vascular imaging with ferumoxytol as a contrast agent. AJR Am J Roentgenol. 2015;205:W366–W373. doi: 10.2214/AJR.15.14534. [DOI] [PMC free article] [PubMed] [Google Scholar]
- 26.Li ZY, Sadat U, et al. Association between aneurysm shoulder stress and abdominal aortic aneurysm expansion: a longitudinal follow-up study. Circulation. 2010;122:1815–1822. doi: 10.1161/CIRCULATIONAHA.110.939819. J UK-I. [DOI] [PubMed] [Google Scholar]
- 27.Roy J, Labruto F, Beckman MO, Danielson J, Johansson G, Swedenborg J. Bleeding into the intraluminal thrombus in abdominal aortic aneurysms is associated with rupture. J Vasc Surg. 2008;48:1108–1113. doi: 10.1016/j.jvs.2008.06.063. [DOI] [PubMed] [Google Scholar]
- 28.Zhu C, Haraldsson H, Tian B, et al. High resolution imaging of the intracranial vessel wall at 3 and 7 T using 3D fast spin echo MRI. MAGMA. 2016;29:559–570. doi: 10.1007/s10334-016-0531-x. [DOI] [PubMed] [Google Scholar]
- 29.Chu B, Kampschulte A, Ferguson MS, et al. Hemorrhage in the atherosclerotic carotid plaque: a high-resolution MRI study. Stroke. 2004;35:1079–1084. doi: 10.1161/01.STR.0000125856.25309.86. [DOI] [PubMed] [Google Scholar]
- 30.Zhu C, Sadat U, Patterson AJ, Teng Z, Gillard JH, Graves MJ. 3D high-resolution contrast enhanced MRI of carotid atheroma–a technical update. Magn Reson Imaging. 2014;32:594–597. doi: 10.1016/j.mri.2014.01.019. [DOI] [PubMed] [Google Scholar]
- 31.Teng Z, Feng J, Zhang Y, et al. Layer- and direction-specific material properties, extreme extensibility and ultimate material strength of human abdominal aorta and aneurysm: a uniaxial extension study. Ann Biomed Eng. 2015;43:2745–2759. doi: 10.1007/s10439-015-1323-6. [DOI] [PMC free article] [PubMed] [Google Scholar]
- 32.O'Leary SA, Kavanagh EG, Grace PA, McGloughlin TM, Doyle BJ. The biaxial mechanical behaviour of abdominal aortic aneurysm intraluminal thrombus: classification of morphology and the determination of layer and region specific properties. J Biomech. 2014;47:1430–1437. doi: 10.1016/j.jbiomech.2014.01.041. [DOI] [PubMed] [Google Scholar]
- 33.Sadat U, Teng Z, Young VE, et al. Impact of plaque haemorrhage and its age on structural stresses in atherosclerotic plaques of patients with carotid artery disease: an MR imaging-based finite element simulation study. Int J Cardiovasc Imaging. 2011;27:397–402. doi: 10.1007/s10554-010-9679-z. [DOI] [PubMed] [Google Scholar]


