Abstract
This paper presents high temperature measurements using a Brillouin scattering-based fiber optic sensor and the application of the measured temperatures and building code recommended material parameters into enhanced thermomechanical analysis of simply supported steel beams subjected to combined thermal and mechanical loading. The distributed temperature sensor captures detailed, nonuniform temperature distributions that are compared locally with thermocouple measurements with less than 4.7% average difference at 95% confidence level. The simulated strains and deflections are validated using measurements from a second distributed fiber optic (strain) sensor and two linear potentiometers, respectively. The results demonstrate that the temperature-dependent material properties specified in the four investigated building codes lead to strain predictions with less than 13% average error at 95% confidence level and that the Europe building code provided the best predictions. However, the implicit consideration of creep in Europe is insufficient when the beam temperature exceeds 800°C.
Keywords: Steel beams, Thermo-mechanical analysis, Nonuniform temperature distribution, Distributed fiber optic sensors, Fire, Structural safety and reliability
Introduction
When a steel structural component is subjected to elevated temperatures, both its material properties and geometry change. The Young’s modulus and yield strength of steel degrade quickly with increasing temperature for temperatures greater than 400°C (Usmani et al. 2003). The degradation of mechanical properties directly reduces the load carrying capacity of a structure. Additionally, thermal expansion can cause changes in connection conditions leading to structural instability and collapse (Sunder et al. 2005). Restraint of thermal expansion can result in large stresses that can cause buckling or yielding of structural members. Therefore, thermal effects can substantially influence the performance of steel structures in fire (Huang and Tan 2003; Tan et al. 2007).
To improve the safety of buildings in a fire, extensive experimental investigations of large-scale steel structures have been carried out in the past. Typical measurements in these investigations included temperature, strain, displacement, and load. With the exception of temperature, almost all measurements were obtained from locations outside of the heated zone. For example, Tan et al. (2007) and Dwaikat et al. (2011) investigated the behavior of steel columns in a furnace with displacements and loads measured using transducers placed outside of the heated zone. Dwaikat et al. (2011) applied strain gauges to a section of each steel test specimen located outside of a test furnace to measure localized strains. Li and Guo (2008) subjected steel beams to heating in fire and subsequent cooling and measured loads and deformations outside of the high-temperature zone. Strain gauges were installed on auxiliary members to indirectly determine forces based on force equilibrium. High-temperature resistance-based strain gauges have been reported to be unreliable in structural applications with fire (McAllister et al. 2012).
Fiber Bragg grating (FBG) sensors were used by Zhang and Kahrizi (2007) to measure strain and temperature; however, the sensors began to degrade when heated over 300°C, and the fiber gratings were erased completely around 600°C. Similarly, Huang et al. (2010) used long-period fiber grating sensors inscribed in optical fibers for strain and temperature measurement up to 700°C. Both types of gratings had limited thermal stability for fire applications (Venugopalan et al. 2010; Huang et al. 2013). Regenerated FBG sensors with enhanced thermal stability were used to successfully monitor temperature changes in fire by Rinaudo et al. (2015). Nevertheless, grating sensors provide measurements only at discrete points. Therefore, fully distributed fiber optic sensors that utilize Brillouin optical time domain analysis (BOTDA) or Brillouin optical time domain reflectometer (BOTDR) technology (Bao and Chen 2011) and provide multiple measurements along a fiber have recently attracted attention in the research community. The application of BOTDR and BOTDA, however, is limited because of low spatial resolution of the measurements, often as large as 15 cm (Bao and Chen 2011). Recently, a pulse prepumped BOTDA (PPP-BOTDA) technology has been commercialized for simultaneous strain and temperature measurement with 2-cm spatial resolution over a measurement distance of 0.5 km (Kishida and Li 2006; Bao et al. 2015). However, implementation of distributed fiber optic sensors for structural fire research has not been fully explored.
Based on experimental investigations, analytical (Usmani et al. 2001; Huang and Tan 2003) and numerical (Choi 2008; Zhang et al. 2012, 2013) studies were carried out, and various computational models were proposed to predict the thermal and mechanical responses of steel beams and columns in fire, including the spatial and temporal temperature distributions and structural deflections.
Thermomechanical analysis procedures for structures or structural components in the literature can be categorized as sequentially coupled or fully coupled. When the thermal responses can be considered independent of the mechanical responses, a sequentially coupled thermomechanical analysis (Jeffers and Sotelino 2012) can be performed. In this case, thermodynamic and heat transfer analyses are first conducted to predict the temperature distributions. Then, the predicted temperature distributions are applied to determine the thermal expansion and temperature-dependent material properties. Finally, mechanical analysis is carried out to predict the structural performance.
When the mechanical response can significantly influence the thermal response, a fully coupled thermomechanical analysis must be performed. In a fully coupled analysis, the incremental results of the structural model are used to incrementally update the boundary conditions in the thermodynamic model.
Both sequentially coupled and fully coupled thermomechanical analysis require the prediction of temperature distributions. Even though zone models (Cadorin and Franssen 2003; Li and Zhang 2012), computational fluid dynamics models [e.g., the Fire Dynamics Simulator (McGrattan et al. 2010)], and stochastic models (Bertola and Cafaro 2009) for fire have been developed, it is difficult to accurately predict the resulting temperature distributions. The error in the predicted temperature distribution can result in inaccurate mechanical response of the structure. Most importantly, the error in temperature distribution and the inaccuracy in mechanical response cannot be quantified without properly measured data, which is difficult to obtain when test objects and sensors are engulfed in flames.
In this study, the authors directly measure temperatures using a distributed fiber optic temperature sensor under fire conditions. The measured temperature distributions are then applied for enhanced thermal-mechanical analysis of steel beams under combined fire and static loading to assess building-code-specified relations for temperature-dependent mechanical properties of the steel. The measured temperatures from the distributed temperature sensor are compared to results obtained using thermocouples. The simulated strains and deflections from the structural analysis are validated using a distributed strain sensor that uses Brillouin scattering and two linear potentiometers, respectively.
Experimental Program
Test Specimen and Setup
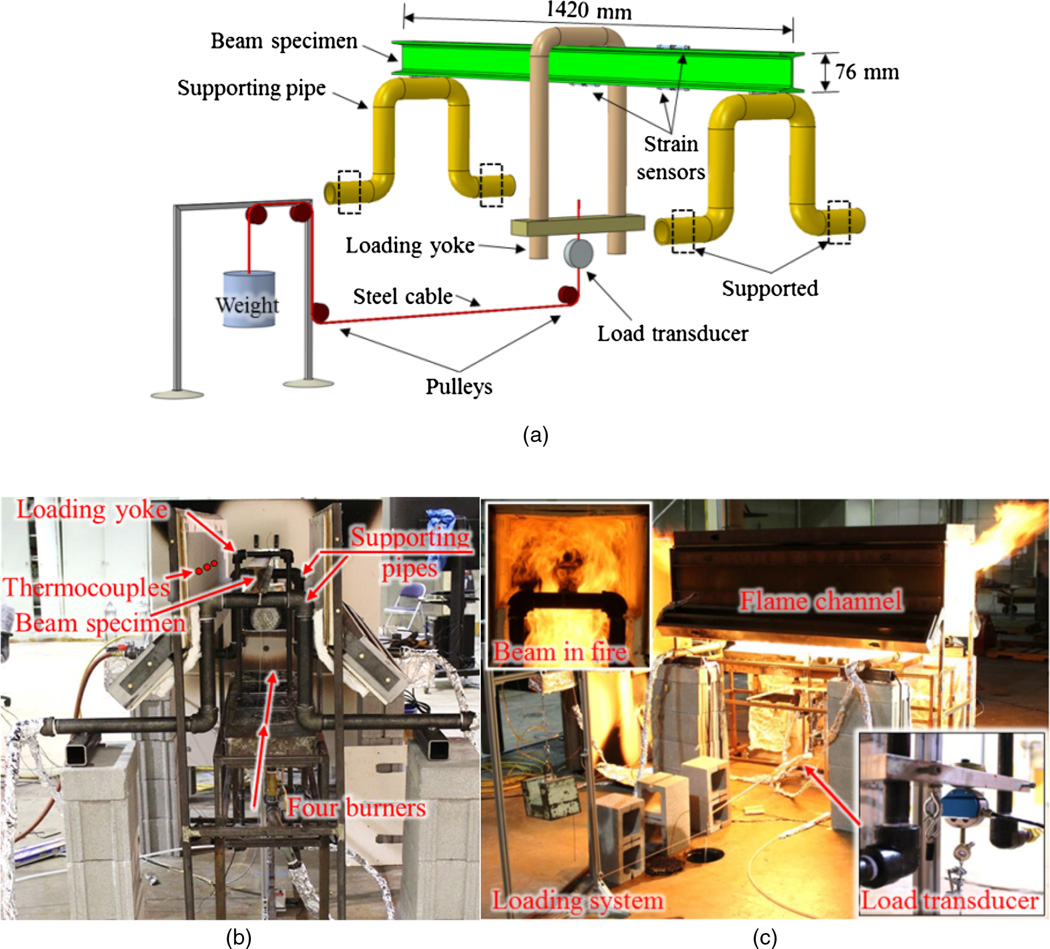
Three S3 × 5.7 ASTM A36 low carbon steel “I-shaped” sections (AISC 2011), designated as Beams #1, #2, and #3, were tested under three-point loading in a reconfigurable compartment fire setup (flame channel), as shown in Figs. 1(a–c). Each beam was 76 mm deep, 59 mm wide, and 1,420 mm long. The cross-sectional area and moment of inertia about the strong axis were 1,077 mm2 and 106 mm4, respectively.
Fig. 1.
Test setup: (a) illustration of specimen loading system; (b) schematic of burners and specimen supports; (c) schematic of specimen loading system
The flame channel, which was located under a 6 × 6 m (plan) exhaust hood, included three subassemblies: a burner rack, an enclosure, and a specimen loading system. The burner rack [Fig. 1(b)] had four independent natural gas diffusion burners made of sheet metal, 300 × 300 × 140 mm (length × width × height) in dimension. After the natural gas entered a burner from the bottom, it filled the burner cavity and passed through a 20-mm thick ceramic fiber blanket to distribute the gas. The burners were manually regulated using a needle valve on the gas line, and the energy content of the supplied gas was measured with an expanded uncertainty of less than 2.4% (Bundy et al. 2007).
An enclosure constructed of square tube steel, cold-formed steel C-profiles and gypsum board lined with thermal ceramic fiber enclosed the space above the burner rack. The enclosure was open at three faces: the bottom and the two ends in longitudinal direction of the beam, creating the compartment flame dynamics depicted in Fig. 1(c). The heated compartment created by the enclosure was approximately 380 × 400 × 1,830 mm (height × width × length) in size and reduced radiative heat losses.
Each beam was simply supported at a clear-span of 1,250 mm on two supports constructed of 1−1/2 in. Schedule 40 pipe (outer diameter: 48 mm), which were supported on concrete blocks. The specimen was loaded by a U-shape 1/2 in. Schedule 40 pipe (outer diameter: 21 mm) loading yoke at the midspan [Fig. 1(a)]. Both the supporting and the loading pipes were water-cooled, with the exiting water temperature controlled to less than 50°C, which limited undesired thermal movement of the boundary conditions. Load was transferred to the yoke with the pulley system depicted in Figs. 1(a and c).
Instrumentation
Data from the fuel delivery system, thermocouples, displacement sensors, and a load transducer were measured continuously using a National Instruments data acquisition system (NI PXIe-1082). Thermocouple data were recorded using 24-bit Thermocouple Input Modules (NI PXIe-4353), and load and displacement data were recorded using a high-speed, 16-bit multifunction module (NI PXIe-6363). Data were sampled at 90 Hz with average values and standard deviations recorded in the output file at a rate of 1 Hz.
A Neubrescope data acquisition system (NBX-7020) for the distributed fiber optic sensors was used to perform PPP-BOTDA measurements (Kishida and Li 2006; Bao and Chen 2015, 2016a). Using a pulse bandwidth of 0.2 ns, 2 cm spatial resolution was obtainable with accuracies of 0.75°C and 15με for temperature and strain at an average count of 214 (Neubrex 2013). In this test, the sampling and spatial resolutions were set at 1 and 2 cm, respectively, meaning that data points were sampled at every 1 cm, and the Brillouin frequency shifts of two points spaced at no less than 2 cm could be distinguished. The measurement distance was set to 50 m. The scanning frequency ranged from 10.82 to 11.67 GHz, which approximately corresponded to a target temperature range from 20 to 1,100°C (Bao and Chen 2015). The reading time varied from 15 to 40 s depending on the scanning frequency range.
Distributed Fiber Optic Sensors (DFOSs)
Two single-mode optical fibers with dual-layer coating were used as a distributed temperature sensor (DFOS-T) and a distributed temperature and strain sensor (DFOS-ST) with the PPP-BOTDA, respectively. The single-mode fiber had a glass core (diameter: 8.2 µm), a glass cladding (outer diameter: 125 µm), a soft inner coating (outer diameter: 190 µm), and a stiff outer coating (outer diameter: 242 µm). The soft and stiff layers protect the glass from mechanical impact and from abrasion and environmental exposure, respectively. Both layers are composed of monomers, oligomers, photoinitiators, and additives (Kouzmina et al. 2010). The distributed sensors measure Brillouin frequency shifts due to temperature and/or strain changes (Bao et al. 2015). Once calibrated, the sensors can be used to evaluate the temperature and strain changes from the measured Brillouin frequency shifts (Bao and Chen 2015, 2016b).
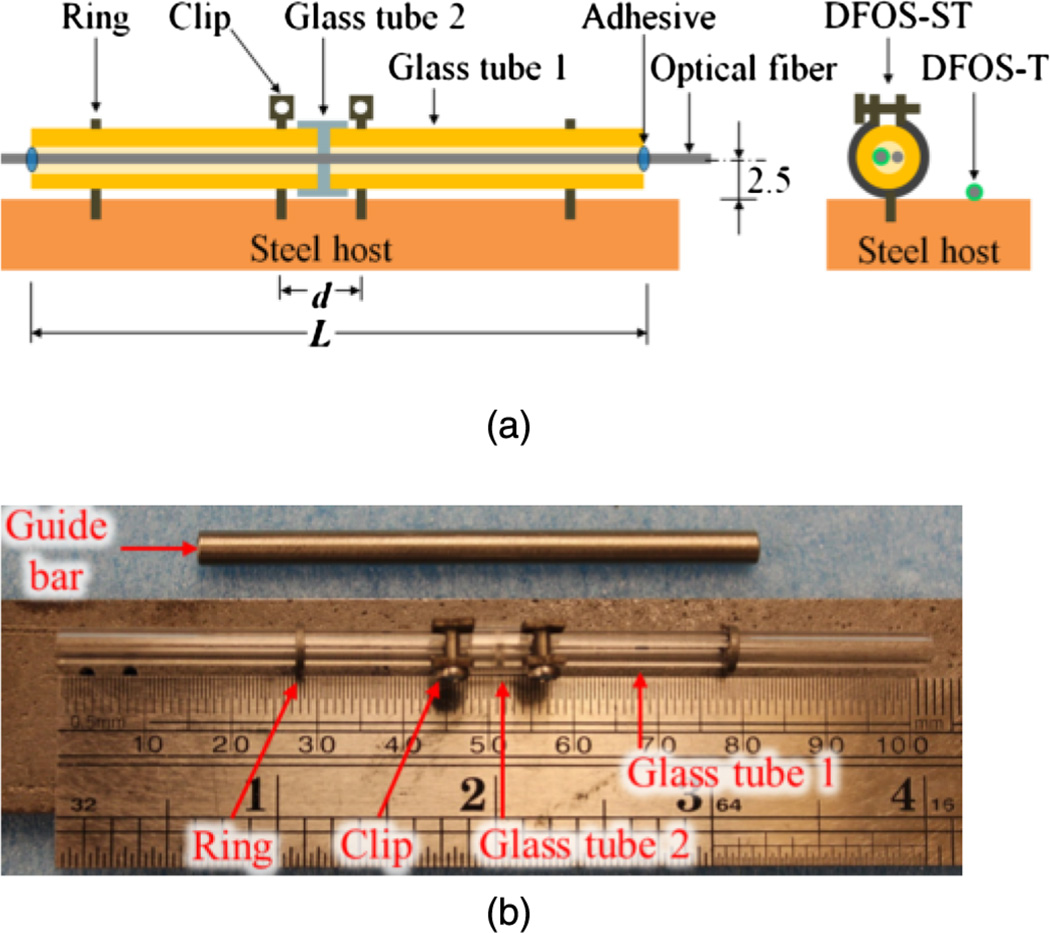
For strain measurement, the coatings must be removed before the optical fiber is attached to a specimen to ensure effective strain transfer at high temperature. Figs. 2(a and b) show the schematic and prototype of a strain sensor package. The bare optical fiber was passed through two glass tubes (Glass tube 1 in Fig. 2) in series with a small gap between them and fixed to the tubes at their far ends using a two-part high-temperature adhesive. The gap between the two tubes was covered with a third tube (Glass tube 2 in Fig. 2) for additional protection of the fiber. Each Glass tube 1 was fixed near the gap on the steel beam with a clip and laterally constrained at the far end with a ring. The leg of each ring or clip was tightly inserted into a small hole (≈1.4 mm in diameter) predrilled on the steel beam. When installed, the two rings and the two clips were aligned using a steel guide bar, as depicted in Fig. 2(b).
Fig. 2.
Fiber optic strain sensor: (a) illustration (units in mm); (b) prototype attached to a steel substrate
The strain sensor measures the elongation of steel between the two clips over a base length denoted by d. To enable large strain measurements, the steel elongation is averaged over a gage length of the sensor, denoted by L. A gage length factor α of the sensor can thus be defined as the ratio of the gage length and the base length, or α = L/d (Huang et al. 2010). Because the optical fiber has limited strain capacity before rupture, increasing α allows for an increased strain measurement range but leads to reduced sensitivity and spatial resolution. In this study, α was designed to be 10, providing a maximum strain capacity of approximately 10,000 με (1%). As shown in Fig. 2(a), the optical fiber for strain sensing had a stand-off distance of 2.5 ± 0.5 mm from the surface of the specimen.
For temperature measurement, the coatings of the optical fiber were left in place to provide protection during installation. The protective coatings burn off at 300–400°C with negligible influence on the temperature measurement, whereas the glass core and cladding can survive to temperatures above 1,000°C.
Each beam was instrumented with three strain-temperature sensors, as shown in Fig. 3: DFOS-ST1 and DFOS-ST2 on the bottom flange at midspan and quarter-span of the beam, respectively, and DFOS-ST3 on the top flange at quarter-span. The optical fiber as a light transmission cable of DFOS-ST1, DFOS-ST2, and DFOS-ST3 or as a distributed temperature sensor (DFOS-T in Fig. 3) was passed along the top and bottom flanges of each beam to form a closed loop with the Neubrescope for PPP-BOTDA measurements. It was intermittently and loosely attached to the surface of the beam using a two-part high temperature adhesive. The transmission cable and the temperature sensor were closely spaced and thus subjected to approximately the same temperatures. Therefore, the strain at the location of DFOS can be determined from the Brillouin frequency shift with temperature compensation as described by Bao et al. (2015).
Fig. 3.
Deployment of fiber optic sensors (DFOS-T, DFOS-ST) and thermocouples (TC)
Thermocouple, Load, and Displacement Sensors
Each beam was instrumented with four glass-sheathed, K-type, bare-bead thermocouples (24 gage wire) peened into small (diameter < 2 mm) holes drilled into the bottom and top flanges, as indicated in Fig. 3: TC1 and TC3 at midspan and TC2 and TC4 at quarter-span. Additional thermocouples were located throughout the test setup to characterize the test environment and monitor safety-relevant temperatures. The thermocouples have a manufacturer-specified temperature standard limit of error of 2.2°C or 0.75% (whichever value is greater) over a measurement range of 0–1,250°C.
A calibrated (linearity: ±0.03%, repeatability: ±0.01%) load transducer by Omegadyn (LCR-100), placed on a spanning bar at the bottom of the loading yoke, was used to measure the applied load, as illustrated in Figs. 1(a and c).
The midspan vertical deflection at the bottom surface of the beam was measured using two linear potentiometers (Novotechnik TR-0050) located below the burner rack and connected to the beam via high-temperature ceramic fibers. The use of two fibers provided compensation for the unwanted influence of gas temperature on displacement measurements with an estimated expanded uncertainty of 0.2 mm (95% confidence).
Test Protocol
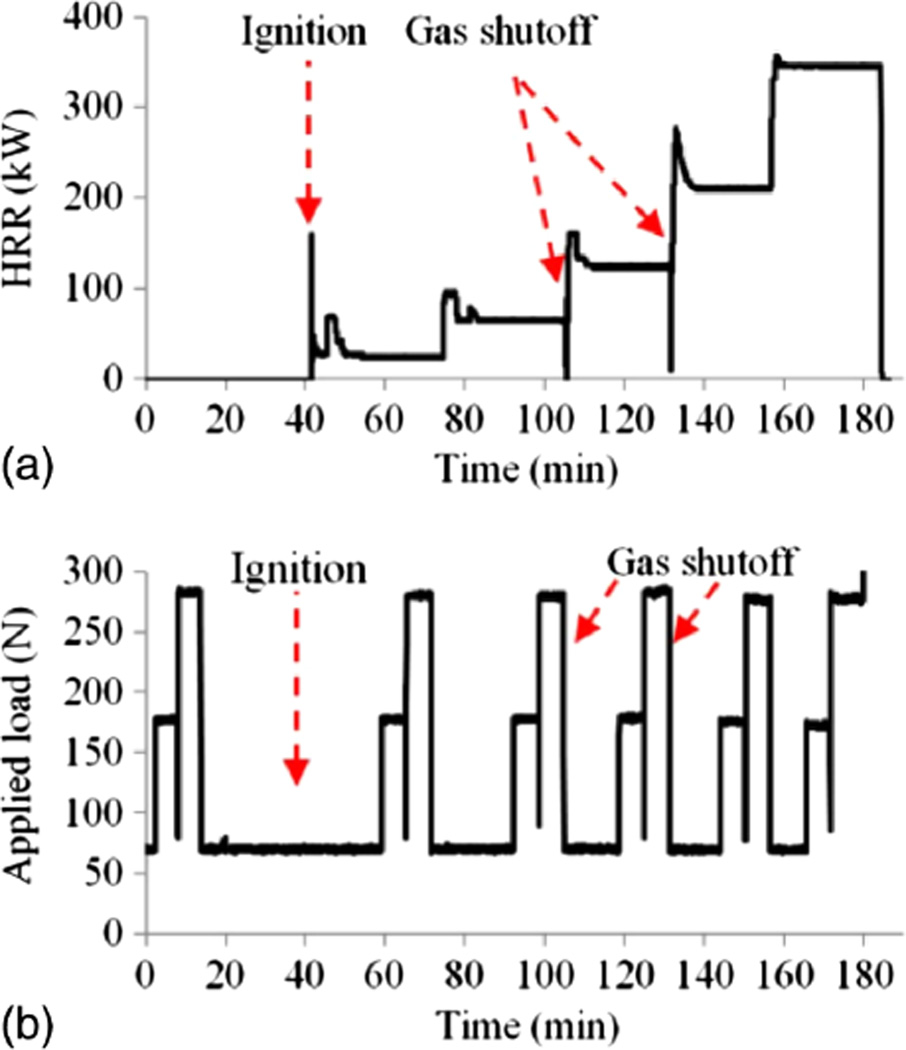
Each beam was subjected to both fire and mechanical loading. Fig. 4 illustrates the fire test protocol. The heat release rate (HRR) was held approximately constant at five target levels: 25, 65, 120, 195, and 350 kW, which corresponded to beam temperatures at TC1 of approximately 200, 400, 600, 850, and 1,050°C, respectively. During the test of Beam #2, the gas was turned off for approximately 20 s before the HRR was increased to 120 and 195 kW, respectively, to allow for visual observation. When the HRR was increased to a higher level, the target value was overshot and then quickly regulated down to the expected value. At each HRR level, in addition to the self-weight, the beam was subjected to three levels of loads at the midspan. For Beam #1, the three loads were approximately 68, 98, and 126 N, and sustained for 7, 4, and 4 minutes, respectively. For Beams #2 and #3, the three loads were approximately 68, 176, and 285 N, each sustained for 6 minutes.
Fig. 4.
Test protocols: (a) heat release rate (HRR) versus time; (b) applied load versus time
Thermomechanical Analysis
Traditionally, thermomechanical analysis of a structure subjected to fire is a multistep process that starts with prediction of the fire behavior. Distributions of heat flux to member surfaces are calculated to provide boundary conditions to the thermomechanical analysis. Temperature distributions in members are then determined by solving heat conduction equations with the boundary conditions. Finally, the calculated temperature distributions are applied to determine material properties, and thermally induced strain and the structural response can be analyzed. This is a complex process, and accumulated errors can be significant.
In this study, temperature distributions near the beam surface were directly measured with the distributed fiber optic sensor (DFOS-T), eliminating the need for prediction of the thermal boundary conditions. Researchers have previously investigated the relationship between the temperatures on a beam surface and within the beam. A so-called section factor, the ratio of the fire-exposed perimeter to the cross-sectional area, determines the heat transfer rate within the beam. Larger section factors lead to higher heat transfer rates. When the section factor of an unprotected steel section is larger than 300 m−1, the temperature within steel can be considered to be the same as the surface temperature (Li et al. 2006; Li and Wang 2012). Because the small test beams (S3 × 5.7 section) had a section factor of 353 m−1, the measured surface temperatures at the top or bottom flange were approximately equal to those within the steel. Furthermore, because of the small beam height, the vertical distributions of temperature over the beam height can be approximated as linearly distributed between the upper and lower surface temperatures (Choi 2008).
High-Temperature Steel Properties
Temperature-dependent material properties governing structural behaviors include thermal, mechanical, and deformation properties (Kodur et al. 2010). The thermal properties include thermal conductivity, specific heat, and density. The mechanical properties include yield strength, elastic modulus, and postyielding stress-strain relationship. The deformation properties include thermal expansion and creep.
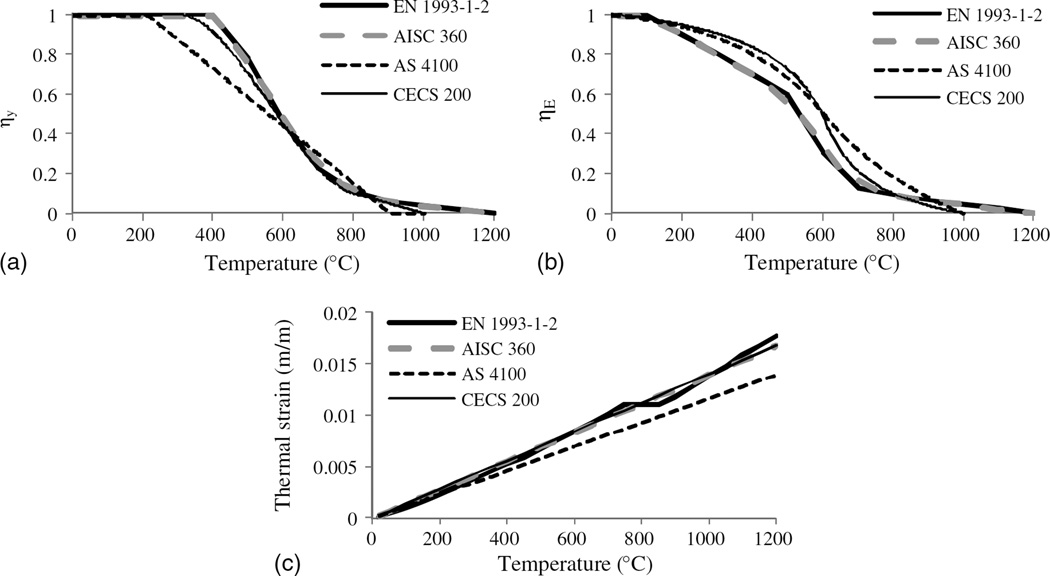
Various models of temperature-dependent mechanical properties were compared by Li and Wang (2012). In their study, four degradation laws of yield strength and elastic modulus of steel at elevated temperatures and their corresponding thermal strains, as shown in Fig. 5, were taken from four standards: EN 1993-1-2 (CEN 2005), AS 4100 (SA 1998), CECS 200 (CECS 2006), and ANSI/AISC 360-10 (AISC 2010). The reduction factors for yield strength and elastic modulus are denoted by ηy and ηE, respectively. ηy = fyT/fy20, and ηE = ET/E20, where fy20 and fyT represent the yielding strengths at 20°C and arbitrary temperature T, respectively; E20 and ET represent the elastic moduli at 20°C and arbitrary temperature T, respectively.
Fig. 5.
Comparison of material models: (a) yield strength; (b) elastic modulus; (c) thermal strain
Mechanical Analysis
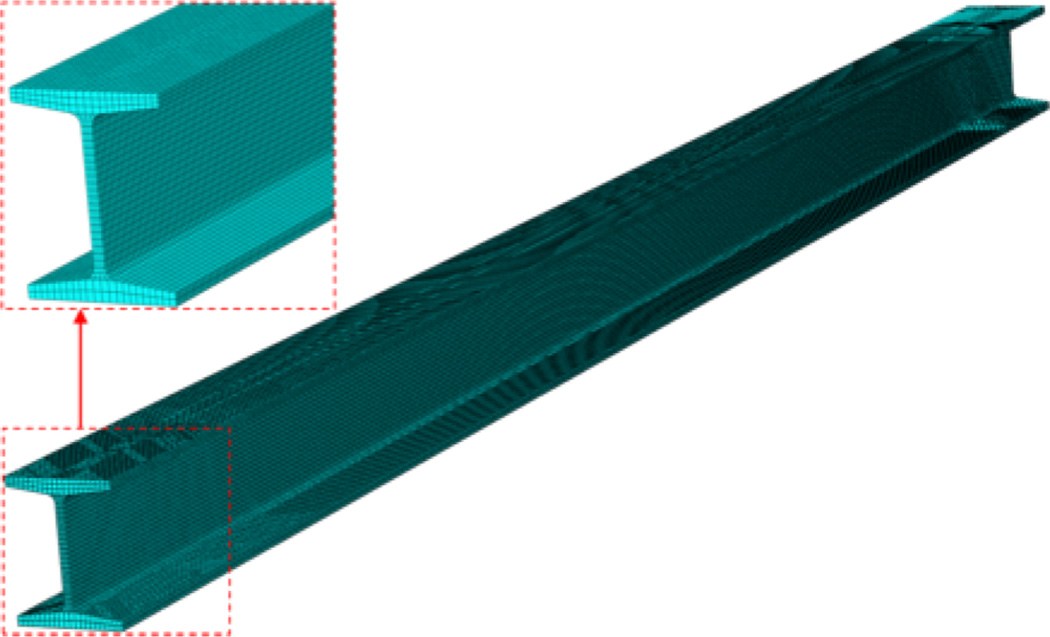
With the measured temperature distributions and the temperature-dependent properties of the steel, a finite-element model of the beam was created using ABAQUS. Three-dimensional 8-node brick elements (2.5 mm mesh size) with reduced integration (C3D8 R) were used to model the simply supported beam, as shown in Fig. 6. Based on the measured temperature distributions and high-temperature steel properties, user subroutines “UMAT” and “UTEMP” (SIMULIA 2014) were applied to define the temperature-dependent nonlinear plasticity of the steel and the nonuniform temperature distributions, respectively.
Fig. 6.
Finite-element model of steel beam specimen
Results and Discussion
Temperature Distributions
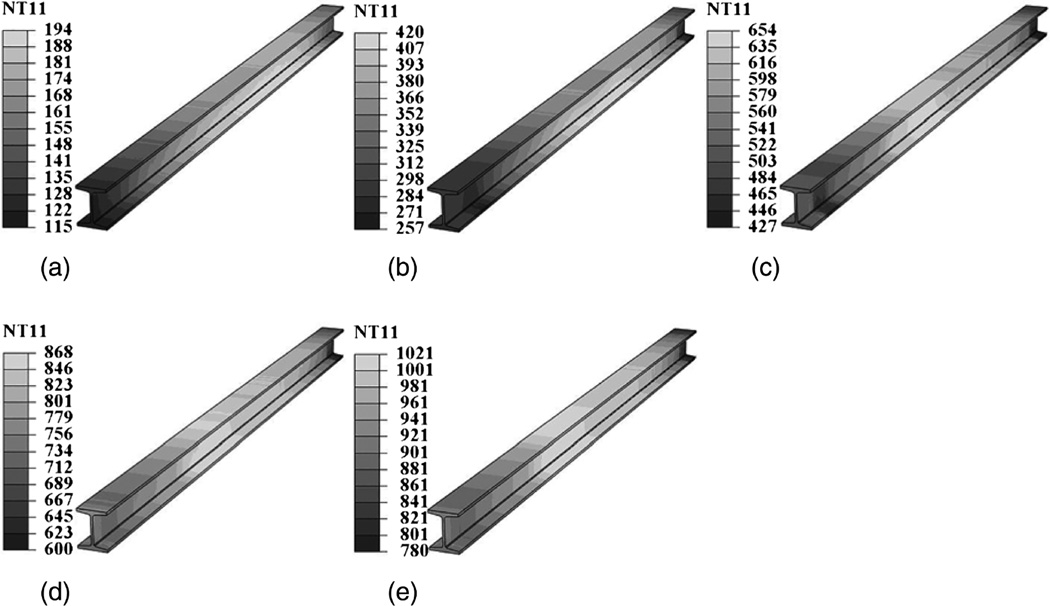
Temperature distributions in steel Beam #2 are presented in Fig. 7 at the five investigated HRR values ranging from 25 to 350 kW. At each HRR, the temperature distribution along the beam was not symmetric about the midspan. The overall temperature distribution pattern varied as the HRR increased. These results generally agree with the visual observation that the flames were somewhat asymmetrical during the tests. The asymmetry is attributed to variations in the ventilation of the flame channel compartment and in the gas distribution among the four burners. These results illustrate the complex behavior of fire that can cause predicted temperature distributions to differ significantly from actual conditions (Cadorin and Franssen 2003; McGrattan et al. 2010; Li and Zhang 2012).
Fig. 7.
Temperature distributions of Beam #2 at various heat release rates (HRR) measured using the DFOS-T sensor (temperatures in °C): (a) HRR=25 kW; (b) HRR=65 kW; (c) HRR=120 kW; (d) HRR=195 kW; (e) HRR=350 kW
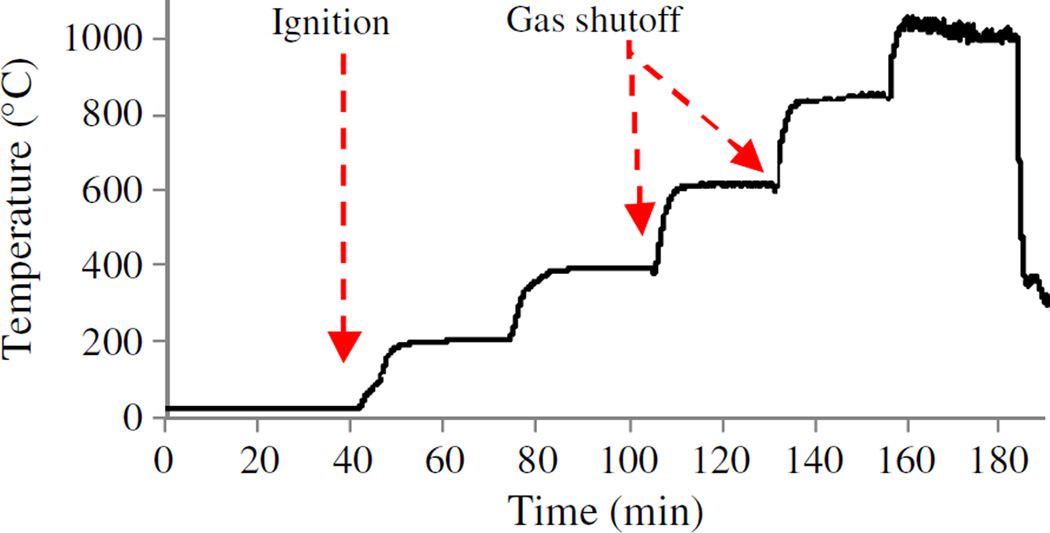
Fig. 8 shows a representative temperature-time history measured from TC1 in Beam #2. The five plateaus corresponded to the five HRR levels in Fig. 4(a). At each sustained HRR level, the beam temperature gradually stabilized to a temperature with some variation. The variations were relatively small at low HRR values and became larger as the HRR was increased. To quantify the temperature variations, the mean values and standard deviations were calculated over 15 minutes for Beam #1 and over 18 minutes for Beams #2 and #3 when the mechanical loads were applied at each temperature level. The means and standard deviations are presented in Table 1. The coefficient of variation for all the thermocouple readings is less than 3.6%.
Fig. 8.
Temperature-time history measured by thermocouple TC1 in Beam #2
Table 1.
Beam Temperatures Measured by Thermocouples (TC) and Fiber Optic Sensors (DFOS-T) at Five Heat Release Rates
| Temperature (°C) | |||||||
|---|---|---|---|---|---|---|---|
| Sensor location | Method | 25 kW | 65 kW | 120 kW | 195 kW | 350 kW | |
| Beam #1 | 1 | TC1 | 210 (1)a | 405 (1) | 634 (8) | 927 (23) | 1,016 (12) |
| DFOS-T | 205 (4) | 394 (8) | 641 (17) | 877 (35) | 1,032 (29) | ||
| Difference (%) | −2.4b | −2.8 | 1.1 | −5.7 | 1.6 | ||
| 2 | TC2 | 197 (1) | 374 (1) | 611 (4) | 928 (20) | 998 (22) | |
| DFOS-T | 198 (4) | 385 (10) | 603 (14) | 876 (27) | 1,025 (13) | ||
| Difference (%) | 0.5 | 2.9 | −1.3 | −5.9 | 2.6 | ||
| 3 | TC3 | 180 (1) | 347 (2) | 557 (8) | 747 (5) | 1,018 (11) | |
| DFOS-T | 185 (4) | 358 (6) | 594 (15) | 812 (17) | 1,038 (23) | ||
| Difference (%) | 2.7 | 3.1 | 6.2 | 8.0 | 1.9 | ||
| 4 | TC4 | 190 (1) | 370 (1) | 631 (2) | 959 (7) | 1,015 (28) | |
| DFOS-T | 193 (3) | 351 (7) | 650 (13) | 872 (18) | 1,004 (25) | ||
| Difference (%) | 1.6 | −5.4 | 2.9 | −10.0 | −1.1 | ||
| Beam #2 | 1 | TC1 | 203 (2) | 396 (1) | 617 (2) | 844 (7) | 1,022 (15) |
| DFOS-T | 197 (4) | 412 (3) | 631 (4) | 847 (5) | 1,033 (11) | ||
| Difference (%) | −3.0 | 3.9 | 2.2 | 0.4 | 1.1 | ||
| 2 | TC2 | 183 (1) | 363 (3) | 575 (6) | 790 (7) | 1,018 (21) | |
| DFOS-T | 174 (3) | 366 (6) | 593 (16) | 816 (19) | 1,028 (19) | ||
| Difference (%) | −5.2 | 0.8 | 3.0 | 3.2 | 1.0 | ||
| 3 | TC3 | —c | — | — | — | — | |
| DFOS-T | 175 (3) | 360 (3) | 603 (2) | 828 (6) | 1,027 (16) | ||
| Difference | — | — | — | — | — | ||
| 4 | TC4 | 175 (2) | 356 (2) | 597 (6) | 832 (9) | 1,008 (10) | |
| DFOS-T | 165 (3) | 354 (3) | 614 (7) | 839 (7) | 1,015 (14) | ||
| Difference (%) | −6.1 | −0.6 | 2.8 | 0.8 | 0.7 | ||
| Beam #3 | 1 | TC1 | 205 (3) | 403 (3) | 623 (8) | 830 (8) | 1,021 (24) |
| DFOS-T | 197 (5) | 399 (4) | 610 (10) | 822 (10) | 1,030 (17) | ||
| Difference (%) | −4.1 | −1.0 | −2.1 | −1.0 | 0.9 | ||
| 2 | TC2 | 177 (3) | 351 (2) | 559 (5) | 779 (4) | 1,013 (36) | |
| DFOS-T | 173 (4) | 368 (4) | 607 (6) | 808 (7) | 1,023 (19) | ||
| Difference (%) | −2.3 | 4.6 | 7.9 | 3.6 | 1.0 | ||
| 3 | TC3 | 182 (4) | 358 (3) | 563 (8) | 759 (7) | 991 (36) | |
| DFOS-T | 175 (5) | 351 (6) | 580 (9) | 777 (12) | 1,026 (26) | ||
| Difference (%) | −4.0 | −2.0 | 2.9 | 2.3 | 3.4 | ||
| 4 | TC4 | 172 (3) | 349 (2) | 572 (5) | 801 (4) | 1,000 (31) | |
| DFOS-T | 162 (4) | 338 (3) | 586 (6) | 810 (10) | 1,020 (29) | ||
| Difference (%) | −6.2 | −3.3 | 2.4 | 1.1 | 2.0 | ||
The value in parentheses is the standard deviation.
Relative difference of the mean temperature of the DFOS and the TC.
”—” denotes a failed thermocouple.
Similarly, to average out the effects of temperature fluctuation, five measurements were made using the DFOS-Tat each sustained temperature level. Each measurement was an implicit average over 15–40 s. The mean values and the standard deviations of five measurements were calculated and compared with the thermocouple results listed in Table 1. The DFOS-T readings have a maximum coefficient of variation of 4%, which was similar to that of the thermocouples.
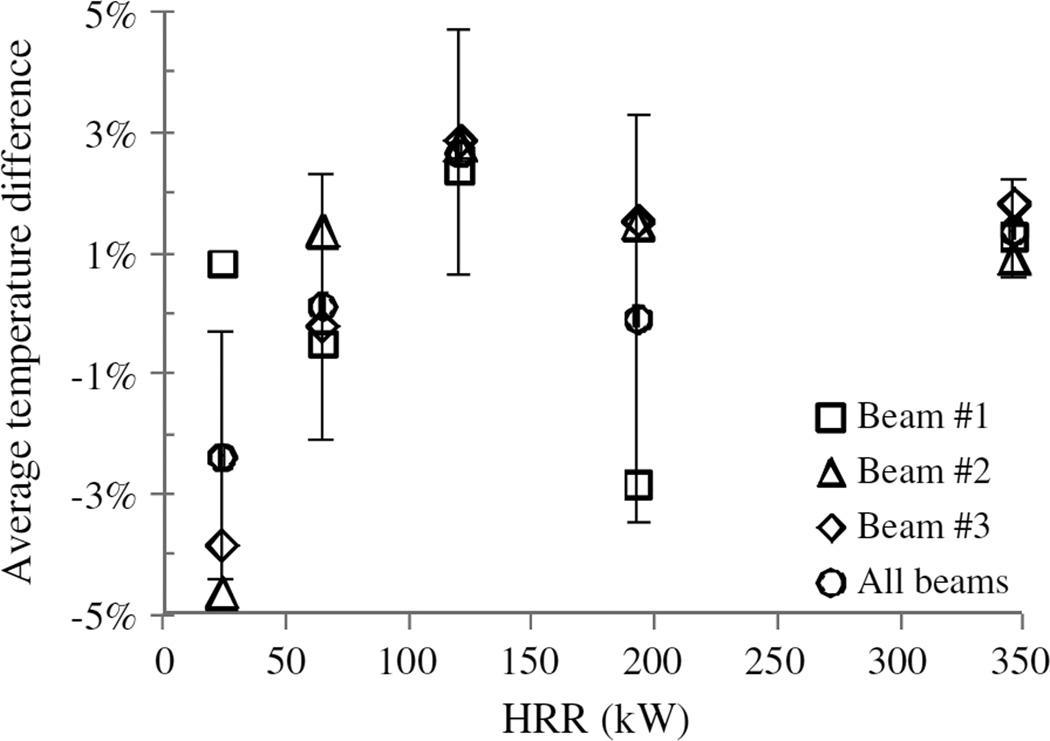
Table 1 also shows that the relative difference between the mean temperatures from the DFOS-T and the thermocouple ranges from −10 to 8%. To understand the statistical significance of the measurement differences, the average of mean temperature differences (four for Beam #1, three for Beam #2, and four for Beam #3) was calculated at each HRR level and presented in Fig. 9 as an average temperature difference. In addition, the range of the mean differences at 95% confidence level is represented by the error bar in Fig. 9. It can be observed from Fig. 9 that the mean difference at 95% confidence level is less than 4.7%, which is acceptable in most engineering applications. The discrepancies may be attributed to several factors. First, the DFOS-T sensor was installed in a slightly different location than the thermocouples. Second, the thermocouple beads were located slightly below the surface of the beam and the DFOS-T slightly above the surface, and thus, the influence of gas temperature variation on the measurements varied. Additionally, the thermocouples were not corrected for radiation losses.
Fig. 9.
Average relative difference between the fiber optic sensor (DFOS-T) and thermocouple (TC) temperature readings
Strains
The simulated strains of Beam #2 under fire and 285 N loading using the mechanical properties specified in the EN1993-1-2 code are presented in Fig. 10 for the first three HRR levels. They include the effects of thermal elongation due to uniform temperature change, thermal bending due to temperature gradient over the cross section, and mechanical bending due to the applied load. At the applied load of 285 N, the mechanical bending caused elastic strain only. Creep strain (time dependent) was not explicitly modeled in the thermomechanical analysis, although creep was implicitly included in the stress-strain relationship and the measured temperature distributions that were input into the model. Furthermore, the beam changes its position with respect to the heat source when deflected significantly, altering the temperature distribution in beam (Baum 2011). As deflection increases, the influence of deflection on the temperature distribution was taken into account in thermal analysis through the DFOS-T measurement.
Fig. 10.
Total strain distributions of Beam #2 under 285 N loading and fire: (a) HRR=25 kW; (b) HRR=65 kW; (c) HRR=120 kW
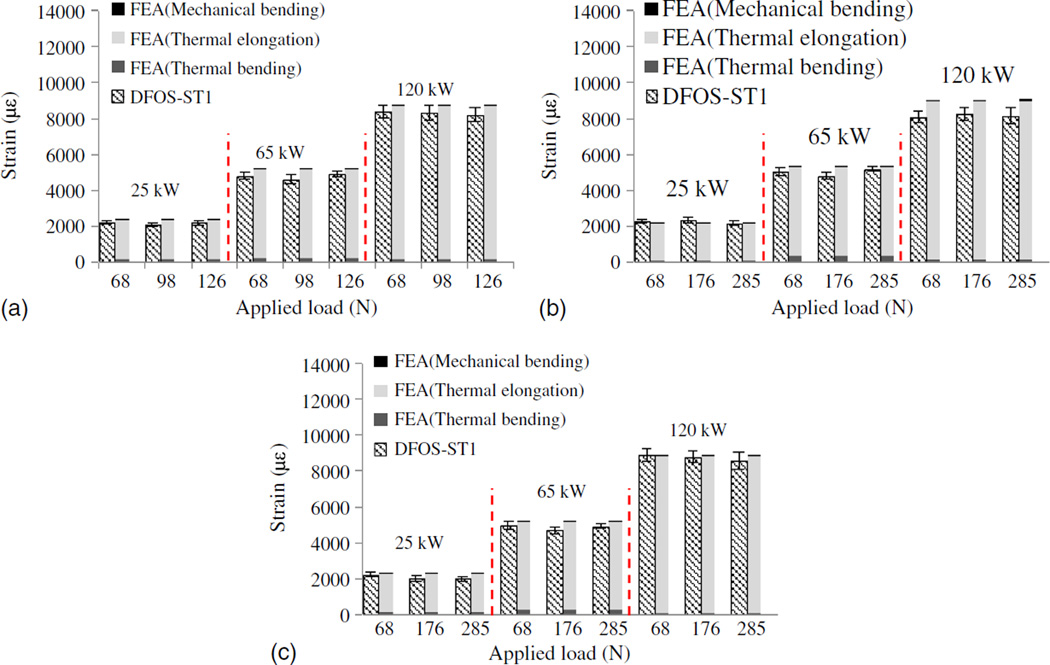
The strains at the bottom flange and midspan of Beam #2 due to thermal elongation, thermal bending, and mechanical bending are presented in Fig. 11 for the first three HRRs and all loading conditions. Fig. 11 shows that the thermal elongation accounted for over 95% of thermal induced strain, and the thermal strain accounted for over 95% of total strain. The observation that thermal elongation effects dominated the response is supported by the fact that the top flange of the beam is always subjected to positive strains, as illustrated by Fig. 10.
Fig. 11.
Longitudinal strain on the bottom flange at midspan of S3 × 5.7 steel beams under three-point bending with a 1,250 mm clear span: (a) Beam #1; (b) Beam #2; (c) Beam #3
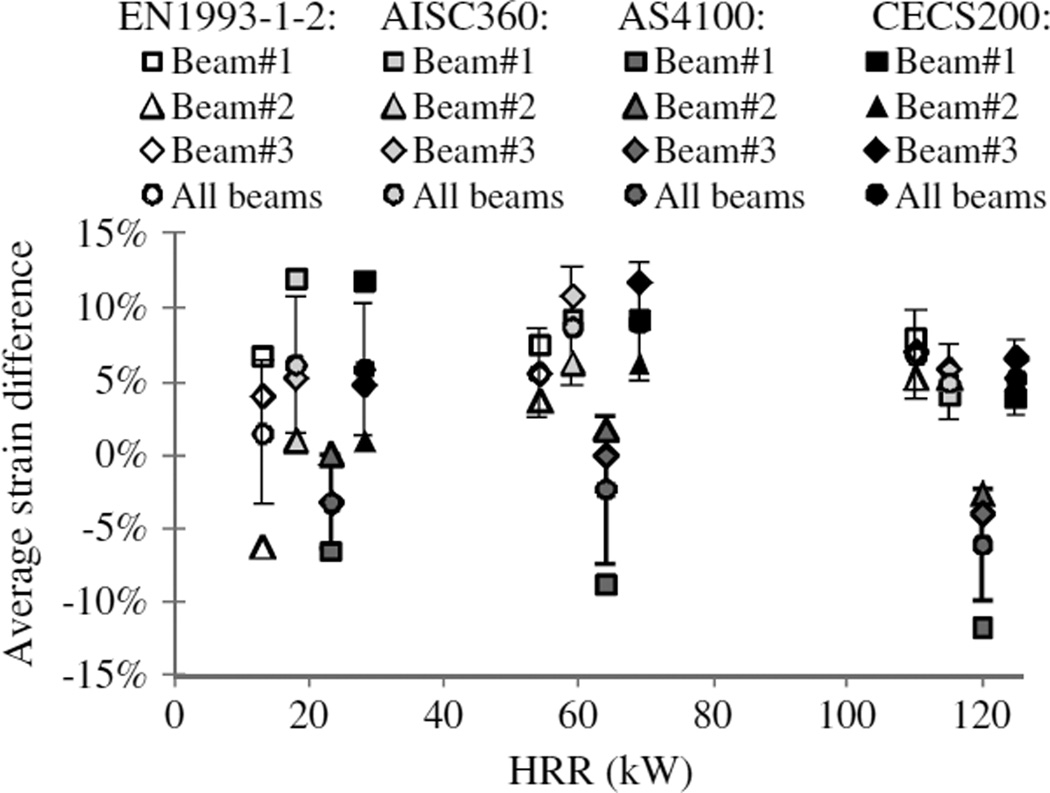
The simulated strains are also compared in Fig. 11 with the strains measured by the DFOS-ST1 sensors (average ± onestandard deviation of five readings). The variations of the strain measurements, mainly because of temperature fluctuation, are small compared to their average amplitudes. The simulated strains at HRR of 195 and 350 kW are not included in Fig. 11 because the DFOS-ST sensors failed because of excessive fiber deformation. In general, the simulated strains under the investigated heating and loading conditions compared well with their corresponding measured strains. To quantify the difference, the strains simulated by finite-element analysis using the temperature-dependent properties specified in Fig. 5 and the measured strains at the three DFOS-ST locations are compared under the highest load applied and HRR up to 120 kW. Similar to Fig. 9, Fig. 12 shows the average of relative strain differences at the DFOS-ST locations (three for each beam) at each HRR level and the margin of error (represented by the error bar) of the data for all beams at 95% confidence level. For the four temperature-dependent material property models, the overall average strain difference ranges from 9.7 (EN 1993-1-2) to 13% (CECS 200) at 95% confidence level. The EN 1993-1-2 code gives the smallest margin of error.
Fig. 12.
Average relative difference between the simulated and measured strains under the highest load
The differences between the simulated and measured strains can be attributed to two main physical phenomena. First, the temperature distribution selected in simulations from five readings could be different from that at the moment of strain measurement. Second, the adopted temperature-dependent properties in simulations may not accurately represent those of the test beam. For example, the temperature-dependent properties suggested in the EN 1993-1-2 code (CEN 2005) are based on the average values from a small number of steel types (Luecke et al. 2011). The second point can be further substantiated by the fact that the average strain differences in Fig. 12 are mostly negative when the material properties specified in AS 4100 code are used because the thermal strain is the smallest as shown in Fig. 5(c).
Midspan Deflection
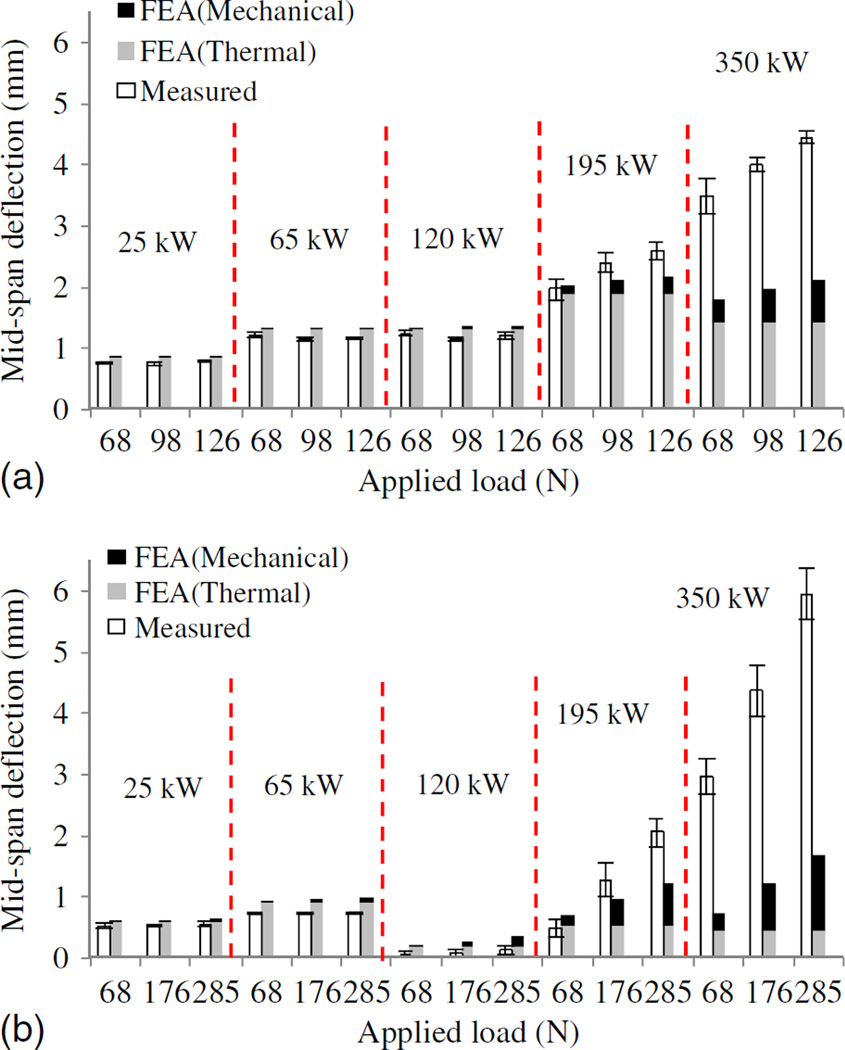
Figs. 13(a and b) compare the simulated and the measured midspan deflections for Beam #1 and Beam #2 at all investigated HRRs and applied loads. Beam #3 is not reported because the displacement sensor failed at the start of the test. The measurements from the displacement sensors were corrected for the settlement of supports and thermal elongation of the sensor attachments. The simulated midspan deflection used the temperature-dependent material properties specified in EN1993-1-2 (CEN 2005). Fig. 13 indicates that the simulated and measured results are in good agreement up through 120 kW (approximately 600°C beam temperature). The discrepancies at higher temperatures result primarily from not modeling creep. Additional sources of error could come from a mismatch between the adopted temperature-dependent properties and those of the test specimens as well as uncertainties in the displacement and fiber optic sensor measurements. At elevated temperatures, the temperature-corrected displacement measurements are within ±0.2 mm of the manufacturer-specified accuracy of the linear potentiometers.
Fig. 13.
Midspan deflections of S3 × 5.7 steel beams under three-point bending with a 1,250 mm clear span: (a) Beam #1; (b) Beam #2
According to the finite-element analysis, 80–95% of midspan deflection was due to thermal bending when the HRR was at 120 kW. Because the thermal gradient of Beam #2 at HRR = 120 kW was smaller than that at HRR = 65 kW, the deflections at HRR = 120 kW were smaller, as indicated in Fig. 13(b). This seemingly surprising result suggests that the temperature distribution in the beam largely depended on the fire dynamics and air circulation in this specific test setup and that prediction of structure response could be quite inaccurate of uniform heating assumed. The significant difference in deflection trend between Beams #1 and #2 at HRR = 120 kW was likely because of the gas shutoff during the test of Beam #2.
At beam temperatures below 600°C (HRR < 120 kW in these tests), even the largest applied load of 285 N was insufficient to cause significant deformation of the beam. This was a limitation of the present tests. At beam temperatures above 600°C, the applied loads were sufficient to cause extensive mechanical deformation through creep and allow for a more differentiated assessment of thermal and mechanical contributions to beam response.
Conclusions
In this study, Brillouin scattering-based fiber optic sensors were used to measure temperatures and strains in steel beams exposed to fire. The measured temperatures along the top and bottom flanges of the beams and their linearly interpolated temperatures in the webs of the I-shaped sections were input to a finite-element model of the beam with building-code-specified temperature-dependent material properties. The following conclusions can be drawn based on the experimental and computational results:
Distributed fiber optic temperature sensors can operate up to at least 1,050°C in fire with adequate sensitivity and accuracy for typical structural engineering applications. The measured temperatures were validated by thermocouple measurements resulting in an average relative difference of less than 4.7% at 95% confidence level.
When HRR ≤ 120 kW, the maximum beam temperature was approximately 600°C. The computational model provided an acceptable prediction of strains (average relative difference <13%) and midspan deflections (0.31 mm maximum difference), when compared to direct strain measurements by distributed fiber optic strain sensors and temperature compensated potentiometers measurements, respectively. The material properties specified in EN 1993-1-2 resulted in the smallest margin of error among the four considered building codes. In these tests, the thermal elongation (not thermal bending) accounted for over 95% of thermal strain, and the thermal strain accounted for over 95% of total strain. At beam temperatures below 600°C, approximately 80–95% of midspan deflection was due to the effects of thermal bending.
When HRR ≥ 195 kW, the mechanical loads had a greater influence on the midspan deflection because of substantial reduction of the mechanical properties of steel and the resulting creep. Without explicitly considering creep effects in the simulations, the deformation was significantly underestimated.
With a gage length factor of approximately 10, the distributed fiber optic strain sensors captured large strains and maintained the fiber integrity until the beam temperatures reached approximately 600°C. For large strain measurements at higher temperatures, a gage length factor of at least 20 is suggested.
Acknowledgments
This work was funded by the National Institute of Standards and Technology (NIST) under Award No. 70NANB13H183. The contents of this paper reflect the views of the authors and do not necessarily reflect the official views or policies of NIST. Certain commercial equipment, instruments, or materials are identified in this paper to specify the experimental procedure. Such identification is not intended to imply recommendation or endorsement by NIST nor to imply the materials or equipment are necessarily the best available for the purpose.
References
- ABAQUS [Computer software] Dassault Systèmes. Waltham, MA: [Google Scholar]
- AISC. ANSI/AISC 360-10. Chicago, IL: 2010. Specifications for structural steel buildings. [Google Scholar]
- AISC. Steel construction manual. 14th. Chicago, IL: 2011. [Google Scholar]
- Bao X, Chen L. Recent progress in Brillouin scattering based fiber sensors. Sensors. 2011;11(12):4152–4187. doi: 10.3390/s110404152. [DOI] [PMC free article] [PubMed] [Google Scholar]
- Bao Y, Chen G. Proc., 10th Int. Workshop Struct. Health. Monit. Lancaster, PA: DEStech Publications; 2015. Fully-distributed fiber optic sensor for strain measurement at high temperature. [Google Scholar]
- Bao Y, Chen G. Strain distribution and crack detection in thin unbonded concrete pavement overlays with fully distributed fiber optic sensors. Opt. Eng. 2016a;55(1):011008. [Google Scholar]
- Bao Y, Chen G. Temperature-dependent strain and temperature sensitivities of fused silica single mode fiber sensors with pulse pre-pump Brillouin optical time domain analysis. Meas. Sci. Technol. 2016b;27(6):065101. [Google Scholar]
- Bao Y, Meng W, Chen Y, Chen G, Khayat KH. Measuring mortar shrinkage and cracking by pulse pre-pump Brillouin optical time domain analysis with a single optical fiber. Mater. Lett. 2015;145:344–346. [Google Scholar]
- Baum HR. Simulating fire effects on complex building structures. Mech. Res. Commun. 2011;38(1):1–11. [Google Scholar]
- Bertola V, Cafaro E. Deterministic-stochastic approach to compartment fire modeling. Proc. R. Soc. London, Ser. A. 2009;465:1029–1041. [Google Scholar]
- Bundy M, Hamins A, Johnsson EL, Kim SC, Ko GH, Lenhert DB. Gaithersburg, MD: NIST; 2007. Measurements of heat and combustion products in reduced-scale ventilation-limited compartment fires. [Google Scholar]
- Cadorin JF, Franssen JM. A tool to design steel elements submitted to compartment fires OZone V2. Part 1: Pre- and post-flashover compartment fire model. Fire Saf. J. 2003;38(5):395–427. [Google Scholar]
- CECS (China Association for Engineering Construction Standardization) CECS200-2006. Beijing: 2006. Technical code for fire safety of steel structures in buildings. [Google Scholar]
- CEN (European Committee for Standardization) EN 1993-1-2. London: 2005. Eurocode 3: Design of steel structures. Part 1–2: General rules—Structural fire design. [Google Scholar]
- Choi J. Ph.D. dissertation, Graduate Faculty of Georgia Institute of Technology. Atlanta, GA: 2008. Concurrent fire dynamics models and thermomechanical analysis of steel and concrete structures. [Google Scholar]
- Dwaikat M, Kodur V, Quiel S, Garlock M. Experimental behavior of steel beam-columns subjected to fire-induced thermal gradients. J. Constr. Steel Res. 2011;67(1):30–38. [Google Scholar]
- Huang Y, Fang X, Zhou Z, Chen G, Xiao H. Large-strain optical fiber sensing and real-time FEM updating of steel structures under the high temperature effect. Smart Mater. Struct. 2013;22(1):015016. [Google Scholar]
- Huang Y, Zhou Z, Zhang Y, Chen G, Xiao H. A temperature self-compensated LPFG sensor for large strain measurements at high temperature. IEEE Trans. Instrum. Meas. 2010;59(11):2997–3004. [Google Scholar]
- Huang ZF, Tan KH. Analytical fire resistance of axially restrained steel columns. J. Struct. Eng. 2003;11(1531):1531–1537. 10.1061/(ASCE)0733-9445(2003)129: [Google Scholar]
- Jeffers AE, Sotelino ED. An efficient fiber element approach for the thermo-structural simulation of non-uniformly heated frames. Fire Saf. J. 2012;51:18–26. [Google Scholar]
- Kishida K, Li CH. Proc., Structural Health Monitoring and Intelligent Infrastructure. London: Taylor & Francis Group; 2006. Pulse pre-pump-BOTDA technology for new generation of distributed strain measuring system; pp. 471–477. [Google Scholar]
- Kodur V, Dwaikat M, Fike R. High-temperature properties of steel for fire resistance modeling of structures. J. Mater. Civ. Eng. 2010:423–434. 10.1061/(ASCE)MT.1943-5533.0000041. [Google Scholar]
- Kouzmina I, Chien CK, Bell P, Fewkes E. Rep. No. WP3703. Corning, NY: Corning Inc.; 2010. Corning CPC protective coating—An overview. [Google Scholar]
- Li G, Guo S. Experiment on restrained steel beams subjected to heating and cooling. J. Constr. Steel. Res. 2008;64(3):268–274. [Google Scholar]
- Li G, Han L, Lou G, Jiang S. Steel and steel-concrete composite structures fire resistance design. China: China Architecture and Building Press; 2006. (in Chinese) [Google Scholar]
- Li G, Wang P. Advanced analysis and design for fire safety of steel structures. Hangzhou, China: Zhejiang University Press; 2012. [Google Scholar]
- Li G, Zhang C. Simple approach for calculating maximum temperature of insulated steel members in natural-fires. J. Constr. Steel. Res. 2012;71:104–110. [Google Scholar]
- Luecke W, Banovic S, McColskey J. Gaithersburg, MD: NIST; 2011. High-temperature tensile constitutive data and models for structural steels in fire. [Google Scholar]
- McAllister T, Luecke W, Iadicola M, Bundy M. Gaithersburg, MD: NIST; 2012. Measurement of temperature, displacement, and strain in structural components subject to fire effects: Concepts and candidate approaches. [Google Scholar]
- McGrattan K, McDermott R, Hostikka S, Floyd J. Gaithersburg, MD: NIST; 2010. Fire dynamics simulator (Version 5) user’s guide. [Google Scholar]
- Neubrex. User’s manual of neubrescope NBX-7020. Japan: Kobe; 2013. [Google Scholar]
- Rinaudo P, Torres B, Paya-Zaforteza I, Calderón PA, Sales S. Evaluation of new regenerated fiber Bragg grating high-temperature sensors in an ISO834 fire test. Fire Saf. J. 2015;71:332–339. [Google Scholar]
- SA (Standards Association of Australian) AS 4100-1998. NSW: Homebush; 1998. Steel structures. [Google Scholar]
- SIMULIA. Abaqus user subroutines reference manual version 6.14. Providence, RI: 2014. [Google Scholar]
- Sunder SS, et al. Gaithersburg, MD: NIST; 2005. Federal building and fire safety investigation of the world trade center disaster: Final Report of the National Construction Safety Team on the Collapses of the World Trade Center Towers. [Google Scholar]
- Tan KH, Toh WS, Huang ZF, Phng GH. Structural responses of restrained steel columns at elevated temperatures. Part 1: Experiments. Eng. Struct. 2007;29(8):1641–1652. [Google Scholar]
- Usmani A, Rotter JM, Lamont S, Gillie M. Fundamental principles of structural behavior under thermal effects. Fire Saf. J. 2001;36(8):721–744. [Google Scholar]
- Usmani AS, Chung YC, Torero JL. How did the WTC towers collapse: A new theory. Fire Saf. J. 2003;38(6):501–533. [Google Scholar]
- Venugopalan T, Sun T, Grattan KTV. Temperature characterization of long period gratings written in three different types of optical fibre for potential high temperature measurements. Sens. Actuators. A: Phys. 2010;160(1–2):29–34. [Google Scholar]
- Zhang B, Kahrizi M. High-temperature resistance fiber Bragg grating temperature sensor fabrication. IEEE Sens. J. 2007;7(4):586–591. [Google Scholar]
- Zhang C, Gross J, McAllister T. Lateral torsional buckling of steel W-beams to localized fires. J. Constr. Steel Res. 2013;88:330–338. [Google Scholar]
- Zhang C, Li G, Wang Y. Sensitivity study on using different formulae for calculating the temperature of insulated steel members in natural fires. Fire Technol. 2012;48(2):343–366. [Google Scholar]


