

Abstract
Red blood cell distribution width (RDW) is the coefficient of variation of red blood cell size, considered to be associated with cardiovascular disease (CVD). This study aimed to comprehensively synthesize previous studies on RDW and CVD outcomes through an overall and dose-response meta-analysis. PubMed, Embase and Web of Science were searched systematically for English and Chinese language publications up to November 30, 2015. We extracted data from publications matching our inclusion criteria for calculating pooled hazard ratio (HR), which was used to assess prognostic impact of RDW on CVD. Twenty-seven articles, consisting of 28 studies and 102,689 participants (mean age 63.9 years, 63,703 males/36,846 females, 2,140 gender-unmentioned subjects) were included in the present meta-analysis. The pooled HRs are 1.12 (95% CI = 1.09–1.15) for the association of all-cause mortality (ACM) per 1% increase of RDW, 1.12(95% CI = 1.08–1.17) for major adverse cardiac events (MACEs) per 1% increase of RDW. A dose-response curve relating RDW increase to its effect on CVD outcomes was established (pcurve < 0.001). For every 1-unit increase of RDW, there is an increased risk of occurrence of ACM (pooled HR = 1.03, 95% CI = 1.02–1.04) and MACEs (pooled HR = 1.04, 95% CI = 1.01–1.06). This study indicates RDW may be a prognostic indicator for CVD outcomes.
Red blood cell distribution width (RDW) is a quantitative parameter in routine hematologic analysis for representing the variation of red blood cell size. RDW is numerically expressed as the coefficient of variation for red blood cell size (equal to standard deviation divided by mean) and has been used to differentiate the causes of anemia for a long time1,2. Recently, the clinical significance of higher RDW has been considered in relation to cardiovascular disease (CVD), autoimmune disease and respiratory disease3,4,5,6. In these non-hematologic disorders, RDW is one of significant indicators of morbidity and mortality7,8. Clinical studies conducted among CVD patients have reported that RDW is a novel, independent predictor for all-cause mortality (ACM), and major adverse cardiac events (MACEs) as well5,9,10,11,12,13, which is the most important outcomes of CVD. In particular, MACEs include cardiovascular death, nonfatal myocardial infarction (MI) and heart failure (HF). Whereas the results are inconsistent and the underlying mechanism is unclear14,15. Even though some meta-analyses have combined the findings of RDW on predicting cardiovascular risk14,15, no dose-response meta-analysis has been performed16. Thus, we conducted the first overall and dose-response meta-analysis to offer new evidence on the association of RDW with CVD outcomes. The prognostic value of RDW for ACM and MACEs were then comprehensively reviewed among CVD (e.g. coronary artery disease, HF, MI) patients.
Results
Search results and study characteristics
As shown in flowchart (Fig. 1), our literature search returned 1,498 publications. After screening the title and abstract of these articles, we kept 126 ones for full-text review. Consequently, this meta-analysis included 27 articles with 28 independent studies and 102,689 participants (mean age 63.9 years, 63,703 male/36,846 female, 2,140 gender-unmentioned subjects), the characteristics of which were provided in Table 1.
Figure 1. Flow chart of the study selection.
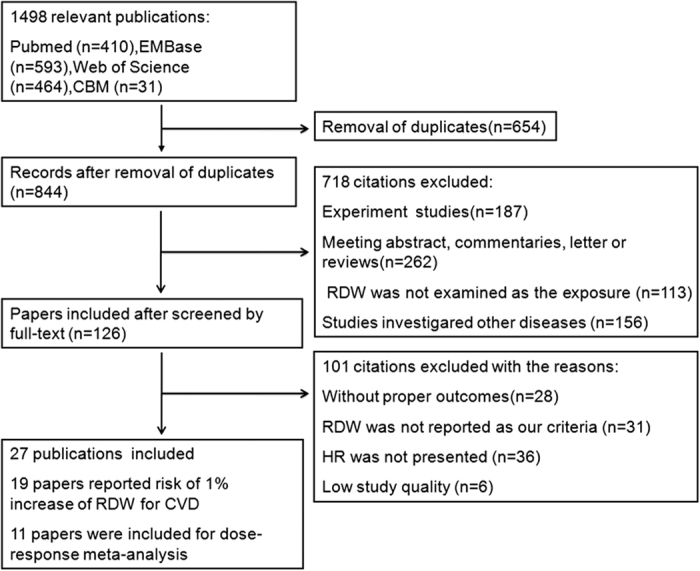
Table 1. Characteristics of included studies on association of RDW with outcomes of CAD.
| Author | Year | Country | Disease | outcome | Sample size | Baseline | Follow up duration | Hazard Ratio (95% CI) |
|---|---|---|---|---|---|---|---|---|
| Allen LA | 2010 | USA | HF | ACM/MACE | 1012 | Age: 64 ± 14, 58% male | 1.0 ± 0.3 y | HR (a) = 1.07 (1.01–1.13)* |
| HR (m) = 1.05 (1.01–1.10)* | ||||||||
| Al-Najjar Y | 2009 | UK | HF | ACM | 1087 | Age: 60 ± 78, 74.3% male | 52 m | HR (a) = 1.12 (1.05–1.16)* |
| Anderson JL | 2007 | USA | CAD | ACM | 29526 | Age: 61.1 ± 14.7, 62% male | 4.9 y | RDW ≤ 12.6, HR (a) = 1 |
| RDW = 12.7–13.2, HR (a) = 1.2 (0.8–1.8) | ||||||||
| RDW = 13.3–14.0, HR (a) = 1.3 (0.9–1.8) | ||||||||
| RDW ≥ 14.1, HR (a) = 1.8 (1.2–2.5) | ||||||||
| Arbel Y (a) | 2014 | Israel | MI | ACM | 535 | Age: 60.5 ± 13.0, 80.1% male | 5 y | HR (a) = 1.17 (1.025–1.34)* |
| Arbel Y (b) | 2014 | Israel | CAD | MACE | 3222 | Age: 65.6 ± ± 12.0, 72.7% male | 415 d | HR (m) = 1.12 (1.07–1.18)* |
| Azab B | 2011 | USA | MI | ACM | 619 | Age: 64.1 ± 10.8, 69.7% male | 4 y | HR (a) = 1.104 (1.004–1.213)* |
| Benedetto U | 2013 | Italy & UK | CAD | ACM | 8340 | Age: 66 ± 13, 85% male | 4485 d | RDW ≤ 12.9, HR (a) = 1 |
| RDW = 12.9–13.4, HR (a) = 1.47 (1.09–3.78) | ||||||||
| RDW = 13.4–14.0, HR (a) = 2.47 (1.31–4.23) | ||||||||
| RDW > 14, HR (a) = 3.44 (2.5–4.7) | ||||||||
| Bonaque JC | 2012 | Spain | HF | ACM/MACE | 698 | Age: 71 (62–77), 63% male | 2.5 y | HR (a) = 1.15 (1.07–1.22)* |
| HR (m) = 1.13 (1.06–1.21)* | ||||||||
| RDW<13.8, HR (a) = 1 | ||||||||
| RDW = 13.8–14.8, HR (a) = 1.31 (0.83–2.06) | ||||||||
| RDW = 14.8–16, HR (a) = 2.05 (1.33–3.16) | ||||||||
| RDW > 16 = 3, HR (a) = 1.47 (2.29–3.16) | ||||||||
| RDW<13.8, HR (m) = 1 | ||||||||
| RDW = 13.8–14.8, | ||||||||
| HR (m) = 1.32 (0.86–2.02) | ||||||||
| RDW = 14.8–16, HR (m) = = 1.55 (1.02–2.37) | ||||||||
| RDW > 16, HR (m) = 2.72 (1.83–4.05) | ||||||||
| Cauthen CA | 2012 | USA | HF | ACM | 6052 | Age: 65 ± 14, 64.6% male | 4.4 ± 2.4 y | HR (a) = 1.09 (1.01–1.17)* |
| Dabbah S | 2010 | Israel | MI | ACM | 1709 | Age: 61 ± 12, 78.2% male | 27 m | RDW ≤ 12.8, HR (a) = 1 |
| RDW = 12.9–13.2, HR ((a) = 1.1 (0.6–2.1) | ||||||||
| RDW = 13.3–13.7, HR (a)1.8 (1–3.2) | ||||||||
| RDW = 13.8–14.3, HR (a) = 2 (1.1–3.4) | ||||||||
| RDW ≥ 14.4, HR (a) = 2.8 (1.6–4.7) | ||||||||
| Ephrem G | 2013 | US | MI | MACE | 543 | Age: 65 ± 13, 56% male | 3.8 y | HR (m) = 1.35 (1.02–1.79)* |
| Felker GM (1) CHARM Cohort | 2007 | USA | HF | ACM/MACE | 2679 | Age: 64.1 ± 11.5, 66.6% male | 34 m | RDW ≤ 13.3, HR (a) = 1 |
| RDW = 13.3–14.0, HR (a) = 1.2 (1–1.7) | ||||||||
| RDW = 14.0–14.7, HR (a) = 1.1 (0.9–1.6) | ||||||||
| RDW = 14.7–15.8, HR (a) = 1.5 (1.1–2) | ||||||||
| RDW > 15.8, HR (a) = 1.7 (1.3–2.3) | ||||||||
| RDW<13.3 = 1 | ||||||||
| RDW = 13.3–14, HR (m) = 1.1 (0.8–1.5) | ||||||||
| RDW = 14–14.7, HR (m) = 1.2 (1–1.6) | ||||||||
| RDW = 14.7–15.8, HR (m) = 1.5 (1.2–2) | ||||||||
| RDW > 15.8, HR (m) = 1.9 (1.5–2.4) | ||||||||
| Felker GM (2) Duke Databank | 2007 | USA | HF | ACM | 2140 | NA | 4y | RDW ≤ 13.0, HR (a) = 1 |
| RDW = 13.1–13.6, HR (a) = 1.6 (1.1–2.5) | ||||||||
| RDW = 13.7–14.2, HR (a) = 1.2 (0.8–1.8) | ||||||||
| RDW = 14.3–15.3, HR (a) = 1.5 (1–2.2) | ||||||||
| RDW > 15.3, HR (a) = 2.2 (1.5–3.3) | ||||||||
| Gijsberts | 2015 | Netherla nd | MI | ACM/MACE | 1760 | Age: 66.2 ± 10.9, 72.7% male | 42 m | HR (a) = 1.25 (1.04–1.49)* |
| HR (m) = 1.19 (1.08–1.32)* | ||||||||
| Jackson CE | 2009 | UK | HF | ACM | 707 | Age: 73 (67–80), 52% male | 421 d | HR (a) = 1.06 (1.01–1.11)* |
| Jung C | 2011 | Geramny | HF | MACE | 354 | Age: 49 (median), 75.7% male | 2579 d | HR (m) = 1.527 (1.274–1.831)* |
| Lappe J (a) | 2013 | USA | HF | ACM/MACE | 6616 | Age: 71.4 ± 14.6, 37.7% male | 1 m | HR (a) = 1.111 (1.06–1.16)* |
| HR (m) = 1.047 (1.01–1.08)* | ||||||||
| Lappe JM (b) | 2011 | USA | CAD | ACM | 1489 | Age: 65.5 ± 11.3, 74.4% male | 8.4–15.2 y | RDW<12.5, HR (a) = 1 |
| RDW = 12.5–12.8, HR (a) = 1.46 (1.05–1.86) | ||||||||
| RDW = 12.9–13.3, HR (a) = 1.64 (1.3–1.98) | ||||||||
| RDW = 13.4–14.2, HR (a) = 1.71 (1.53–1.88) | ||||||||
| RDW > 14.2, HR (a) = 3.02 (2.12–3.92) | ||||||||
| Lee JH | 2013 | Korea | MI | MACE | 1596 | Age: 64.5 ± 11.9, 67.0% male | 12 m | HR (m) = 1.19 (1.03–1.37)* |
| RDW<12.6, HR (m) = 1 | ||||||||
| RDW = 12.7–13.1, HR (m) = 4.24 (1.41–12.75) | ||||||||
| RDW = 13.2–13.9, HR (m) = 4.36 (1.47–12.91) | ||||||||
| RDW > 13.9, HR (m) = 6.18 (2.1–18.21) | ||||||||
| Makhoul BF | 2013 | Israel | HF | ACM | 614 | Age: 77 ± 10, 45.9% male | 1 y | HR (a) = 1.15 (1.08–1.21)* |
| RDW ≤ 14.3, HR (a) = 1 | ||||||||
| RDW = 14.4–15.2, HR (a) = 0.9 (0.6–1.3) | ||||||||
| RDW = 15.3–16.5, HR (a) = 1.2 (0.8–1.7) | ||||||||
| RDW ≥ 16.6, HR (a) = 1.9 (1.3–2.6) | ||||||||
| Oh J | 2012 | Korea | HF | MACE | 261 | Age: 62.6 ± 14.2, 54.8% male | 1 m | HR (m) = 1.14 (1.042–1.247)* |
| Osadnik T | 2013 | Poland | CAD | ACM | 2550 | Age: 64.4 ± 9.3, 70.5% male | 2.5 y | HR (a) = 1.23 (1.13–1.35)* |
| Pascual-Figal DA | 2009 | Spain | HF | ACM | 628 | Age: 71 (61–77), 68% male | 38.1 m | HR (a) = 1.074 (1.021–1.127)* |
| Poludasu S | 2009 | USA | CAD | ACM | 859 | Age: 62.3 ± 10.3, 49.4% male | 4 y | RDW<13.3, HR (a) = 1 |
| RDW = 13.3–15.7, HR (a) = 0.91 (0.41–2) | ||||||||
| RDW ≥ 15.7, HR (a) = 3.48 (1.36–8.9) | ||||||||
| Rickard J | 2012 | USA | HF | ACM | 217 | Age: 64.1 ± 11.8, 73.3% male | 4.4 ± 1.8 y | HR (a) = 1.19 (1.06–1.33) |
| RDW<13.6, HR (a) = 1 | ||||||||
| RDW = 13.6–16.1, HR (a) = 1.19 (1.06–1.33) | ||||||||
| RDW ≥ 16.1, HR (a) = 2.49 (1.13–5.44) | ||||||||
| Sahin O | 2014 | Turkey | MI | ACM | 335 | Age: 63 ± 13, 66.0% male | 18 m | HR (a) = 0.97 (0.83–1.12)* |
| Tonelli M | 2008 | CARE study | CAD | ACM/MACE | 4111 | Age: 57.9 ± 9.2, 86.4% male | 59.7 m | HR (a) = 1.14 (1.05–1.24)* |
| HR (m) = 1.08 (1.00–1.17)* | ||||||||
| RDW ≤ 12.6, HR (a) = 1 | ||||||||
| RDW = 12.6–13.1, HR (a) = 1.29 (0.92–1.82) | ||||||||
| RDW = 13.1–13.7, HR (a) = 1.35 (0.97–1.88) | ||||||||
| RDW ≥ 13.7, HR (a) = 1.78 (1.28–2.47) | ||||||||
| RDW = 10.9–12.6, HR (m) = 1 | ||||||||
| RDW = 12.6–13.1, HR (m) = 1.19 (0.9–1.59) | ||||||||
| RDW = 13.1–13.7, HR (m) = 1.39 (1.05–1.83) | ||||||||
| RDW = 13.8–23.2, HR (m) = 1.56 (1.17–2.08) | ||||||||
| Tseliou E | 2014 | Greece | HF | ACM/MACE | 80 | Age: 57.8 ± 12.4, 97.6% male | 6 m | HR (a) = 1.15 (1.05–1.27)* |
| HR (m) = 1.15 (1.05–1.27)* | ||||||||
| Uyarel H | 2011 | Turkey | MI | MACE | 2506 | Age: 56.6 ± 11.8, 82.8% male | 21 m | RDW<14.8, HR (m) = 1 |
| RDW > 14.8, HR (m) = 1.831 (1.034–3.24) | ||||||||
| van Kimmenade | 2009 | USA | HF | ACM | 205 | Age: 73.1 ± 13, 51.2% male | 1 y | HR (a) = 1.03 (1.02–1.07)* |
| Yao HM | 2014 | China | CAD | ACM/MACE | 2169 | Age: 60.2 ± 10.9, 67.7% male | 2 y | HR (a) = 1.37 (1.15–1.62)* |
| HR (m) = 1.21 (1.04–1.39)* | ||||||||
| Yu SB | 2012 | China | HF | ACM | 16681 | Age: 66 (54–74), 49.3% male | 3 y | RDW ≤ 13.2, HR (a) = 1 |
| RDW = 13.3–14.1, HR (a) = 0.892 (0.818–0.973) | ||||||||
| RDW = 14.2–14.8, HR (a) = 0.859 (0.793–0.931) | ||||||||
| RDW ≥ 14.9, HR (a) = 1.034 (0.961–1.111) | ||||||||
| Zalawadiya SK | 2011 | USA | HF | ACM | 789 | Age: 62.7 ± 15.1, 50% male | 573 d | HR (a) = 1.20 (1.11–1.29)* |
| RDW ≤ 14, HR (a) = 1 | ||||||||
| RDW = 14.01–15.20, HR (a) = 1.73 (0.94–3.19) | ||||||||
| RDW = 15.21–16.50, HR (a) = 2.44 (1.34–4.47) | ||||||||
| RDW > 16.5, HR (a) = 3.21 (1.77–5.83) |
*Analysis for risk of per 1% increase of RDW; HR (a): hazard ratio for ACM; HR (m): hazard ratio for MACE; ACM: all-cause mortality; MACE: major adverse cardiac event; HF: heart failure; MI: myocardial infarction; CAD: coronary artery disease; 95% CI: 95% confidence intervals; d: days; m: months; y: years.
Overall meta-analyses of prognostic value of RDW for ACM among CVD patients
As shown in Fig. 2 and Supplementary Table 3, 19 original studies1,6,9,11,17,18,19,20,21,22,23,24,25,26,27,28,29,30,31 reported the prognostic risk of per 1% increase of baseline RDW for all-cause mortality in CVD patients. After combining adjusted hazard ratios (HRs) and 95% confidence interval (CI) of the 19 studies, we found that the ACM risk of CVD patients significantly increased by 12% (pooled HR = 1.12, 95% CI = 1.09–1.15, p = 0.000) per 1% increase of RDW among CVD patients. The heterogeneity test showed that statistical significance existed across all the studies (I2 = 69.3%, Q = 58.55, p = 0.000). The subgroup analysis was conducted based on specific disease category. The pooled HRs (and 95% CIs) of ACM were 1.11(1.07–1.14), 1.11(1.00–1.21), 1.21(1.11–1.32) among HF, MI and CAD patients, respectively. In addition, the results of subgroup analyses stratified by subject ethnicity, study design and follow-up duration were presented in Supplementary Table 3.
Figure 2. Forest plot of the pooled adjusted HR of per 1% RDW increase for the risk of all-cause mortality in overall meta-analysis.
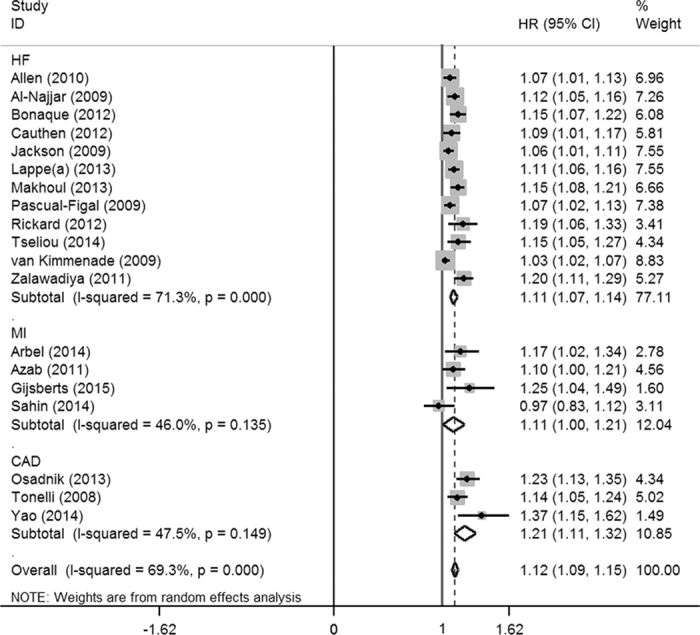
The size of each grey square is proportional to the study’s weight calculated in the meta-analysis. HR: hazard ratio; 95% CI: 95% confidence interval; HF: heart failure; MI: myocardial infarction; CAD: coronary artery disease.
Overall meta-analyses of prognostic value of RDW for MACEs among CVD patients
Eleven studies5,17,20,22,26,28,29,31,32,33,34 addressed the relationship between per 1% increase of RDW and MACEs. The pooled HR (1.12, 95% CI = 1.08–1.17, p = 0.000) indicated that increased RDW also facilitated MACEs among CVD populations (Fig. 3). The heterogeneity was significant across the 11 studies (I2 = 63.4%, Q = 30.09, p = 0.003). Then, we performed subgroup analyses based on disease classification, subject ethnicity, study design and follow-up duration. As shown in Supplementary Table 4, the pooled HRs (95% CIs) were 1.11(1.05–1.17) among HF patients, 1.14(1.08–1.21) among MI patients, and 1.12(1.08–1.17) among CAD patients, respectively.
Figure 3. Forest plot of the pooled adjusted HR of per 1% RDW increase for the risk of MACEs in overall meta-analysis.
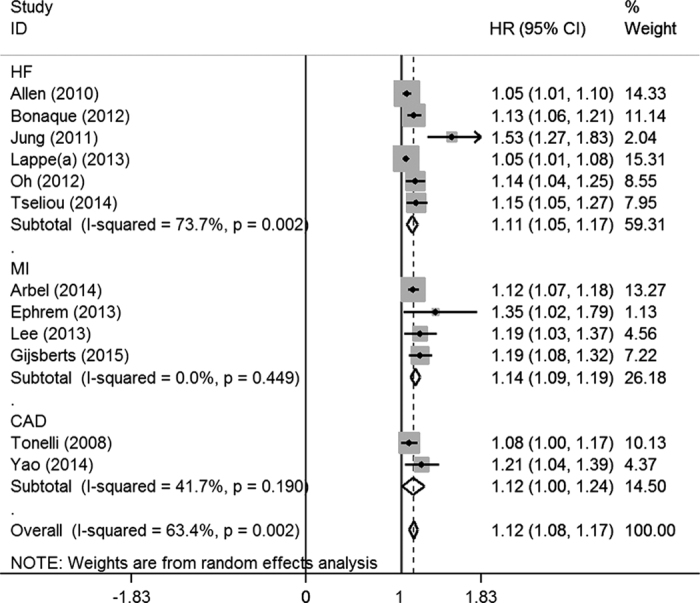
The size of each grey square is proportional to the study’s weight calculated in the meta-analysis. HR: hazard ratio; 95% CI: 95% confidence interval; HF: heart failure; MI: myocardial infarction; CAD: coronary artery disease.
Dose-response meta-analysis on relationship between RDW and ACM among CVD patients
Twelve original studies within 11 articles2,8,20,23,27,28,35,36,37,38,39 were included in the dose-response meta-analysis on prognostic value of RDW for all-cause mortality, in which the HRs of RDW classification (e.g. tertile, quartile or quintile) for CVD risk were published. As the curve showed (Fig. 4A), the dose-response relationship between RDW and ACM was significant (χ2 = 48.57, p = 0.000). The pooled HR was 1.03(95% CI = 1.02–1.04) for every 1-unit increase of RDW among CVD patients.
Figure 4. Dose-response relationship between RDW (per 1-unit increase) and CVD outcomes.
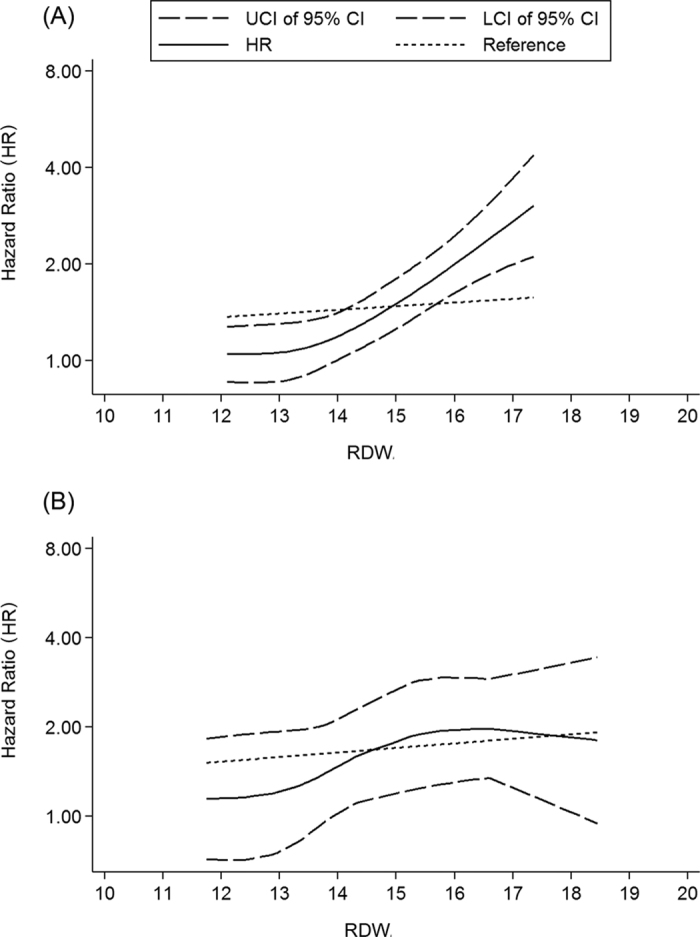
(A) Relationship between RDW and all-cause mortality. (B) Relationship between RDW and MACEs. Dotted lines represent the 95% CI for the fitted trend. LCI: lower limit of confidence interval; UCI upper limit of confidence interval; 95% CI: 95% confidence interval; RDW: red blood cell distribution width.
Dose-response meta-analysis on relationship between RDW and MACEs among CVD patients
Five studies2,12,20,28,40 were combined in the dose-response meta-analysis of association between RDW level and MACEs. All studies provided the risks of RDW classification for MACEs. As shown in Fig. 4B, a significant curve of dose-response relationship existed (χ2 = 10.25, p = 0.001), with the pooled HR being 1.04 (95% CI = 1.01–1.06) for every 1-unit increase of RDW.
Dose-response meta-analysis on relationship between RDW/Hb and outcomes of CVD
In seven studies12,20,23,28,36,37,41 that reported mean hemoglobin(Hb) of subjects, the differences of Hb level between all RDW classifications were significant. To adjust the confounding of anemia status for CVD patients, we normalized RDW with Hb through calculating the ratio of RDW to Hb. Furthermore, we performed a dose-response meta-analysis to evaluate the prognostic value of RDW/Hb for ACM. As shown in Fig. 5A the curve of dose-response relationship between RDW and ACM was obvious (χ2 = 34.87, p = 0.000). The pooled HR was 2.03(95% CI = 1.60–2.57) for every 1-unit increase of the RDW/Hb ratio. For the relationship between RDW/Hb and MACEs, a significant curve of dose-response relationship exists (χ2 = 7.91, p = 0.048), with the pooled HR being 1.58(95% CI = 1.09–2.29) for every 1-unit increase of RDW/Hb (Fig. 5B).
Figure 5. Dose-response relationship between RDW/Hb (per 1-unit increase) and adverse cardiovascular event risk.
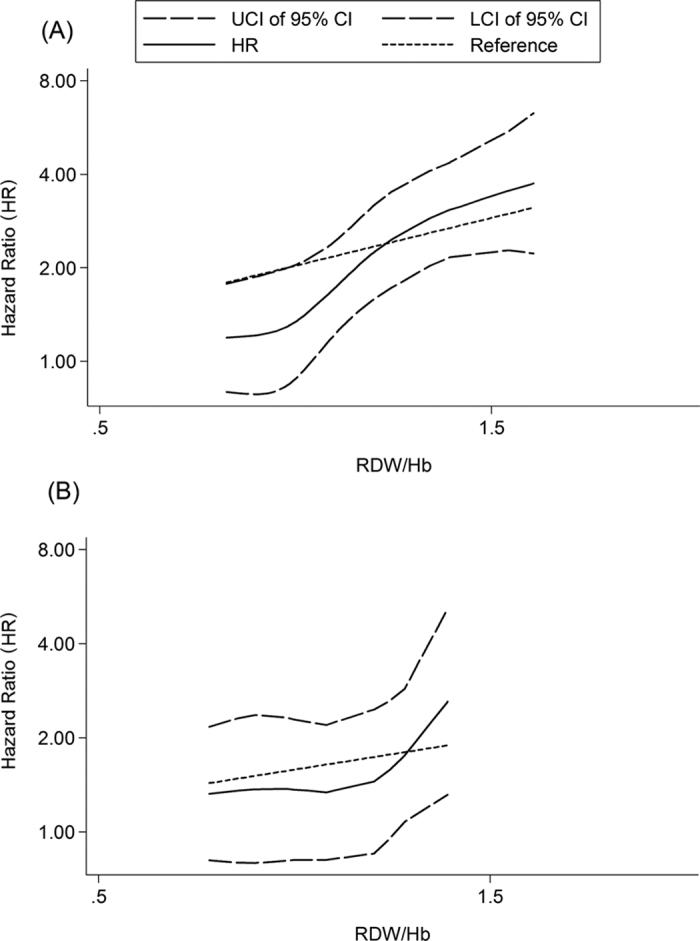
(A) Relationship between RDW and all-cause mortality. (B) Relationship between RDW and MACEs. Dotted lines represent the 95% CI for the fitted trend. LCI: lower limit of confidence interval; UCI upper limit of confidence interval; 95% CI: 95% confidence interval; RDW: red blood cell distribution width; Hb: hemoglobin.
Sensitivity analysis
Anemia, resulting from percutaneous coronary intervention (PCI) in clinical settings, may be a confounder in this study. Therefore we conducted a sensitivity analysis by excluding the original studies of Poludasu et al.38 and Uyarel et al.12, as these CVD patients were recruited undergoing PCI. The results indicated that curve relationship between every 1-unit increase of RDW and adverse outcomes of CVD was significant, with a HR of 1.03(95% CI = 1.14–1.04, p = 0.000) for ACM and 1.04(95% CI = 1.01–1.06, p = 0.012) for MACEs (Supplementary Figures 1–2). Further sensitivity analysis was performed to detect the stability of this meta-analysis by removing each study sequentially. Consequently, no obvious change was generated for omission of each study except van Kimmenade’s research6. The detailed results of sensitivity analysis were described in Supplementary Figures 3–4.
Publication bias
The funnel plot is used to explore potential publication bias of the current meta-analysis. Supplementary Figures 5–6 demonstrates that publication bias was statistically significant.
Discussion
In this systematic review, we included 27 articles consisting of 28 original studies and 102,689 subjects. The pooled results demonstrated that baseline RDW level was remarkably associated with CVD outcomes. We found a 0.12-fold elevation for all-cause mortality risk in CVD patients per 1% increase of RDW. Increased RDW is also an effective predictor for MACEs with a HR of 1.12. The novel approach of dose-response meta-analysis identified the curve of dose-response relationship between RDW and CVD outcomes.
Red blood cell distribution width (RDW) is a parameter of the heterogeneity of circulating erythrocytes size, which was reported to be associated with CVD1,2,6,12,28,37,38. Although the mechanism of this association is not fully understood, RDW is considered to be an indicator of inflammation, and is implicated in several inflammatory markers, such as C-reactive protein (CRP), interleukin-6 (IL-6), and tumor necrosis factor-α (TNF-α)19,42. Inflammatory stress leads to dysfunctional bone marrow with ineffective production of red blood cells18, disturbs the red cell membrane and effectively causes the migration of reticulocytes into the peripheral circulation. This induces an increase in the proportion of immature RBCs in the circulation, resulting in higher RDW levels42. Moreover, inflammation up-regulates the expressions of complement protein receptors (C1qRs) and toll-like receptors (TLRs) in platelets. This contributes to platelet activation, accelerating the progression of inflammatory diseases, such as CVD18. It is clear that the inflammatory process is a principal pathophysiologic pathway in the development of CVD and CVD events43,44,45,46. In addition, an increase in RDW is related to increased oxidative damage in blood circulation, which associates with exacerbation of CVD47.
Hemodynamic status, reported by Salvagno et al., may play a role in association of RDW with CVD48. RBCs may become entrapped in atherosclerotic plaque by the occurrences of fibrous cap damage, thrombus formation or plaque hemorrhage resulting from injury of intraplaque microvessels. In these instances, RBCs accelerate atherogenesis locally in the damaged area. The high anisocytosis of RBCs, exhibited as increased RDW, causes decreased erythrocyte deformability. This may increase blood viscosity, disturb blood flow through the microcirculation, and promote the adverse consequences of a pre-existing vascular occlusion in CVD. Therefore, increased RWD levels may contribute to the identification of CVD patients who require more intensive therapy18.
Many clinical studies and several meta-analyses have been conducted to explore the application measures of the easily acquired routine blood index, and to study the prognostic significance of RDW among CAD or HF patients14,15. Whilst they have provided effective methods with valuable results, no authors conducted dose-response meta-analysis. Does–response meta-analysis is a new method of systematic review and meta-analysis for assessing the effect of continuous quantitative variables on diseases16. Compared to previous meta-analyses, our study found a dose-response relationship between RDW and CVD outcomes.
Although RDW is a recognized parameter associated with anemia, no study has provided an explicit baseline for anemia with exception to hemoglobin (Hb) levels in subjects. In the present study, we calculated the pooled HR, for which Hb and other confounding factors were adjusted with multiple statistical model. A recently publication verified that RDW was an independent risk factor related to mortality of post-PCI non-anemia patient49. This finding indicates that RDW is an independent predictor of CVD mortality49. To further adjust the effect of anemia on our results and explore the appropriate rheological role of related risk factors, we normalized RDW with Hb. We found that the ratio of RDW/Hb is significant for predicting CVD outcomes in a dose-response manner. This is the first report demonstrating the prognostic value of the normalized RDW (i.e. RDW/Hb) on CVD outcomes. As RBC count is also considered to be independently associated with CVD risk50, we suggest that other approaches of normalizing RDW, such as the ratio of RBC count, might be utilized in further relevant studies for the purpose of explaining rheological role of RDW on CVD outcomes.
Moreover, the treatment of PCI plays a crucial role in post-PCI anemia because of arterial vessel wall injury and further antiplatelet or antithrombotic medication during the PCI procedure. Post-PCI anemia is also reported to increase the risk of CVD in patients51. Further, our sensitivity analysis, excluding the original studies conducted among participants undergoing PCI, showed a significant dose-response relationship between RDW and CVD outcomes.
The present study has certain limitations. Firstly, the heterogeneity across individual studies was not avoided completely. Secondly, we did not conduct subgroup analyses based on gender and age stratifications because no original articles reported the detailed HRs stratified by age and gender. Thirdly, the potential publication bias might disturb the quality of meta-analysis. Publication bias is a disadvantage in systematic reviews and meta-analyses, which needs to be mitigated as much as possible at the onset of original studies. When researchers evaluate the risks of RDW and other variables on CVD outcomes, the COX proportional hazards regression model would be utilized to calculate the adjusted HRs, which then presented the independent risk degrees. However, the non-significant HRs were not included in the original publications. This is problematic for us to further systematic reviews and meta-analyses referring to these studies, as only the significant adjusted HRs were included in synthesized HRs. Undoubtedly, this induced a publication bias into our studies. In order to avoid this kind of bias in the future, the following methods should be implemented: (1) all results of statistical analysis should be reported, (2) when employing a stepwise method for COX regression analysis, the variables in the multivariate model equation and those not in the equation should be involved simultaneously; otherwise, the enter model should be applied to include each variable in multivariate statistical analysis.
In spite of the afore-mentioned limitations, this study presents new comprehensive evidence for the association between RDW and CVD outcomes. We might conclude that increased RDW is a prognostic indicator for CVD outcomes with a dose-response manner.
Methods
This meta-analysis is conducted according to the published criteria of the Preferred Reporting Items for Systematic Reviews and Meta-Analyses (PRISMA)14,15. The PRISMA Checklist form is listed in Supplementary Table 1.
Search strategy
We identified relevant studies on the association between RDW and adverse outcomes among CVD patients (i.e. coronary artery disease, MI, and HF). The search approach was performed to retrieve articles from PubMed, Embase and Web of Science databases published in English and Chinese up to November 30, 2015. The search strategy was designed with the following terms: “red cell distribution width” or “red blood cell distribution width” or “RDW”, “mortality”, “CVD events”, “cardiovascular disease” or “CVD”, “coronary artery disease” or “CAD”, “myocardial infarction” or “MI”, and “heart failure” or “HF”. Further manual collection of references attached on retrieved papers was performed to screen potential relevant studies.
Selection criteria
We included studies that fulfilled the following inclusion criteria: (1) the baseline or admission serum RDW level was reported; (2) prospective study or retrospective study that evaluated the prognostic value of RDW for CVD patients; (3) one of the following outcomes was reported: all-cause mortality (ACM), fatal CVD events (cardiovascular death), non-fatal CVD events (e.g. MI, stroke, HF and readmission for CVD); (4) studies performed in participants aged ≥18 years. We excluded studies that matched any of the following exclusion criteria: (1) duplicated data; (2) researches based on animal or cell line design; (3) no full data can be obtained.
Quality assessment and data extraction
Two authors independently reviewed relevant articles. The quality of each study was assessed with the scale for quality assessment (Supplementary Table 2) generated according to the PRISMA statement and the Meta-analysis of Observational Studies in Epidemiology (MOOSE) guidelines15. The studies labeled high quality with score ≥6 were included in the current meta-analysis. The third reviewer (D.L.) contributed to the resolution of inconsistent opinions.
The following data for eligible studies were extracted independently: year of publication, name of first author, duration of follow-up, location of study population, number of participants, characteristics of patients or controls, definition of outcome, adjusted HR for per 1% increase of RDW for CVD risk, adjusted HR for each RDW classification compared to reference level. We also checked the online Supplementary Data of published articles when necessary.
Data synthesis and statistical analysis
The STATA 14.0 software (by Stata Corp, College Station, TX, USA) was utilized to analyze data. We combined HR values to identify the prognostic risk of per 1% increase of RDW for CVD based on the original studies reporting quantitative RDW levels. For other studies which addressed ordinal classification of RDW levels, the dose-response meta-analysis was performed to synthesize pooled HRs and the curve of dose-response relationship with the method of Greenland and Longnecker16. The number of cases, person-years or numbers of all participants are required for this methodology, and the HR (and 95% CI) for at least three RDW categories are required as well. For the studies that did not publish the number of cases or person-years in each RDW level, the data were calculated approximately from total number of cases, person-years and HR in this study. The I2 and Q-test was performed to detect the heterogeneity across included studies. The fixed effects model was used to combine the original data when the heterogeneity was not statistically significant. Otherwise, the random effects model analysis was used when heterogeneity was considered to be significant (p was < 0.10 and I2 was >50%). Furthermore, subgroup analyses were performed to explore the sources of heterogeneity according to study characteristics in terms of study design, type of disease, follow-up duration and ethnicity of subject. Sensitivity analyses were conducted to evaluate the stability of results in the current meta-analysis. Funnel plot analysis was implemented to detect potential publication bias52.
Additional Information
How to cite this article: Hou, H. et al. An overall and dose-response meta-analysis of red blood cell distribution width and CVD outcomes. Sci. Rep. 7, 43420; doi: 10.1038/srep43420 (2017).
Publisher's note: Springer Nature remains neutral with regard to jurisdictional claims in published maps and institutional affiliations.
Supplementary Material
Acknowledgments
This study was supported by the National Natural Science Foundation of China (No. 81202170). We thank Monique Garcia in Edith Cowan University (Australia) for her English editing.
Footnotes
The authors declare no competing financial interests.
Author Contributions H.H., D.L. designed the research. T.S. and Y.L. reviewed the literatures. H.H. and T.S. collected the data. H.H. and Z.G. analyzed the data. H.H. and C.L. wrote the paper. W.W. contributed to revise the paper. All authors critically reviewed the manuscript for important intellectual content and approved the final version.
References
- Al-Najjar Y., Goode K. M., Zhang J., Cleland J. G. & Clark A. L. Red cell distribution width: an inexpensive and powerful prognostic marker in heart failure. Eur J. Heart Fail. 11, 1155–1162 (2009). [DOI] [PubMed] [Google Scholar]
- Felker G. M. et al. CHARM Investigators. Red cell distribution width as a novel prognostic marker in heart failure: data from the CHARM Program and the Duke Databank. J. Am Coll Cardiol. 50, 40–47 (2007). [DOI] [PubMed] [Google Scholar]
- Aung N. et al. Progressive rise in red cell distribution width is associated with poor outcome after transcatheter aortic valve implantation. Heart. 99, 1261–1266 (2013). [DOI] [PubMed] [Google Scholar]
- Skjelbakken T. et al. Red cell distribution width is associated with incident myocardial infarction in a general population: the Tromso Study. J. Am Heart Assoc. 3, pii: e001109 (2014). [DOI] [PMC free article] [PubMed] [Google Scholar]
- Jung C. et al. Red blood cell distribution width as useful tool to predict long-term mortality in patients with chronic heart failure. Int J. Cardiol. 152, 417–418 (2011). [DOI] [PubMed] [Google Scholar]
- van Kimmenade R. R. et al. Red blood cell distribution width and 1-year mortality in acute heart failure. Eur J. Heart Fail. 2, 129–136 (2010). [DOI] [PubMed] [Google Scholar]
- Forhecz Z. et al. Red cell distribution width in heart failure: prediction of clinical events and relationship with markers of ineffective erythropoiesis, inflammation, renal function, and nutritional state. Am Heart J. 4, 659–666 (2009). [DOI] [PubMed] [Google Scholar]
- Anderson J. L. et al. Intermountain Heart Collaborative (IHC) Study Group. Usefulness of a complete blood count-derived risk score to predict incident mortality in patients with suspected cardiovascular disease. Am J. Cardiol. 2, 169–174 (2007). [DOI] [PubMed] [Google Scholar]
- Jackson C. E. et al. Red cell distribution width has incremental prognostic value to B-type natriuretic peptide in acute heart failure. Eur J. Heart Fail. 12 1152–1154 (2009). [DOI] [PubMed] [Google Scholar]
- Li W. et al. Association between red cell distribution width and the risk of heart events in patients with coronary artery disease. Exp Ther Med. 4, 1508–1514 (2015). [DOI] [PMC free article] [PubMed] [Google Scholar]
- Sahin O. et al. Association of red blood cell distribution width levels with severity of coronary artery disease in patients with non-ST elevation myocardial infarction. Med Princ Pract. 2, 178–183 (2015). [DOI] [PMC free article] [PubMed] [Google Scholar]
- Uyarel H. et al. Red cell distribution width as a novel prognostic marker in patients undergoing primary angioplasty for acute myocardial infarction. Coron Artery Dis. 22 138–144 (2011). [DOI] [PubMed] [Google Scholar]
- Li Y. et al. Red blood cell distribution width is independently correlated with diurnal QTc variation in patients with coronary heart disease. Medicine (Baltimore). 23, e822 (2015). [DOI] [PMC free article] [PubMed] [Google Scholar]
- Shao Q., Li L., Li G. & Liu T. Prognostic value of red blood cell distribution width in heart failure patients: a meta-analysis. Int J. Cardiol. 179, 495–499 (2015). [DOI] [PubMed] [Google Scholar]
- Su C., Liao L. Z., Song Y., Xu Z. W. & Mei W. Y. The role of red blood cell distribution width in mortality and cardiovascular risk among patients with coronary artery diseases: a systematic review and meta-analysis. J. Thorac Dis. 6, 1429–1440 (2014). [DOI] [PMC free article] [PubMed] [Google Scholar]
- Greenland S. & Longnecker M. P. Methods for trend estimation from summarized dose-response data, with applications to meta-analysis. Am J. Epidemiol. 135, 1301–1309 (1992). [DOI] [PubMed] [Google Scholar]
- Allen L. A. et al. Validation and potential mechanisms of red cell distribution width as a prognostic marker in heart failure. J. Card Fail. 16, 230–238 (2010). [DOI] [PMC free article] [PubMed] [Google Scholar]
- Arbel Y. et al. Red blood cell distribution width (RDW) and long-term survival in patients with ST elevation myocardial infarction. Thromb Res. 134, 976–979 (2014). [DOI] [PubMed] [Google Scholar]
- Azab B. et al. Usefulness of red cell distribution width in predicting all-cause long-term mortality after non-ST-elevation myocardial infarction. Cardiology. 119, 72–80 (2011). [DOI] [PubMed] [Google Scholar]
- Bonaque J. C. et al. Red blood cell distribution width adds prognostic value for outpatients with chronic heart failure. Rev Esp Cardiol (Engl Ed). 65, 606–612 (2012). [DOI] [PubMed] [Google Scholar]
- Cauthen C. A., Tong W., Jain A. & Tang W. H. Progressive rise in red cell distribution width is associated with disease progression in ambulatory patients with chronic heart failure. J. Card Fail. 18, 146–152 (2012). [DOI] [PMC free article] [PubMed] [Google Scholar]
- Lappe J. et al. The Red Cell Distribution Width Predicts 30-Day Readmission Risk among Patients with a Primary Diagnosis of Heart Failure. J. Am Coll Cardiol. 61, E627 (2013). [Google Scholar]
- Makhoul B. F. et al. Relation between changes in red cell distribution width and clinical outcomes in acute decompensated heart failure. Int J. Cardiol. 167, 1412–1416 (2013). [DOI] [PubMed] [Google Scholar]
- Osadnik T. et al. Red cell distribution width is associated with long-term prognosis in patients with stable coronary artery disease. BMC Cardiovasc Disord. 13, 113 (2013). [DOI] [PMC free article] [PubMed] [Google Scholar]
- Pascual-Figal D. A. et al. Red blood cell distribution width predicts long-term outcome regardless of anaemia status in acute heart failure patients. Eur J. Heart. 11, 840–846 (2009). [DOI] [PubMed] [Google Scholar]
- Gijsberts C. M. et al. Hematological Parameters Improve Prediction of Mortality and Secondary Adverse Events in Coronary Angiography Patients: A Longitudinal Cohort Study. Medicine (Baltimore). 94, e1992 (2015). [DOI] [PMC free article] [PubMed] [Google Scholar]
- Rickard J. et al. Elevated red cell distribution width is associated with impaired reverse ventricular remodeling and increased mortality in patients undergoing cardiac resynchronization therapy. Congest Heart Fai. 18, 79–84 (2012). [DOI] [PubMed] [Google Scholar]
- Tonelli M. et al. Relation Between Red Blood Cell Distribution Width and Cardiovascular Event Rate in People With Coronary Disease. Circulation. 117, 163–168 (2008). [DOI] [PubMed] [Google Scholar]
- Tseliou E. et al. Red blood cell distribution width is a significant prognostic marker in advanced heart failure, independent of hemoglobin levels. Hellenic J. Cardiol. 55, 457–461 (2014). [PubMed] [Google Scholar]
- Veeranna V., Zalawadiya S. K., Panaich S., Patel K. V. & Afonso L. Comparative analysis of red cell distribution width and high sensitivity C-reactive protein for coronary heart disease mortality prediction in multi-ethnic population: findings from the 1999-2004 NHANES. Int J. Cardiol. 168, 5156–5161 (2013). [DOI] [PubMed] [Google Scholar]
- Lappé J. M. et al. Red cell distribution width, C-reactive protein, the complete blood count, and mortality in patients with coronary disease and a normal comparison population. Clin Chim Acta. 412, 2094–2099 (2011). [DOI] [PubMed] [Google Scholar]
- Yao H. M. et al. Red blood cell distribution width and long-term outcome in patients undergoing percutaneous coronary intervention in the drug-eluting stenting era: a two-year cohort study. PLoS One. 9, e94887 (2014). [DOI] [PMC free article] [PubMed] [Google Scholar]
- Ephrem G. Red blood cell distribution width is a predictor of readmission in cardiac patients. Clin Cardiol. 36, 293–299 (2013). [DOI] [PMC free article] [PubMed] [Google Scholar]
- Oh J. et al. Prognostic Value of Change in Red Cell Distribution Width 1 Month After Discharge in Acute Decompensated Heart Failure Patients. Circ J. 76, 109–116 (2012). [DOI] [PubMed] [Google Scholar]
- Arbel Y. et al. Red blood cell distribution width and 3-year outcome in patients undergoing cardiac catheterization. J. Thromb Thrombolysis. 37, 469–474 (2014). [DOI] [PubMed] [Google Scholar]
- Benedetto U. et al. Red blood cell distribution width predicts mortality after coronary artery bypass grafting. Int J. Cardiol. 165, 369–371 (2013). [DOI] [PubMed] [Google Scholar]
- Dabbah S., Hammerman H., Markiewicz W. & Aronson D. Relation between red cell distribution width and clinical outcomes after acute myocardial infarction. Am J. Cardiol. 105, 312–317 (2010). [DOI] [PubMed] [Google Scholar]
- Poludasu S., Marmur J. D., Weedon J., Khan W. & Cavusoglu E. Red cell distribution width (RDW) as a predictor of long-term mortality in patients undergoing percutaneous coronary intervention. Thromb Haemost. 102, 581–587 (2009). [DOI] [PubMed] [Google Scholar]
- Yu S. B. et al. Impact of red cell distribution width on outcome of 16 681 patients with chronic systolic heart failure. Zhonghua Xin Xue Guan Bing Za Zhi. 40, 237–242 (2012). [PubMed] [Google Scholar]
- Lee J. H. et al. Incremental predictive value of red cell distribution width for 12-month clinical outcome after acute myocardial infarction. Clin Cardiol. 36, 336–341 (2013). [DOI] [PMC free article] [PubMed] [Google Scholar]
- Zalawadiya S. K. et al. Red cell distribution width and mortality in predominantly African-American population with decompensated heart failure. J. Card Fail. 17, 292–298 (2011). [DOI] [PubMed] [Google Scholar]
- Weiss G. & Goodnough L. T. Anemia of chronic disease. N Engl J. Med. 352, 1011–1023 (2005). [DOI] [PubMed] [Google Scholar]
- Bozkurt B., Mann D. L. & Deswal A. Biomarkers of inflammation in heart failure. Heart Fail Rev. 15, 331–341 (2010). [DOI] [PubMed] [Google Scholar]
- Drakopoulou M. et al. Association of inflammatory markers with angiographic severity and extent of coronary artery disease. Atherosclerosis. 206, 335–339 (2009). [DOI] [PubMed] [Google Scholar]
- Lu L. et al. Increased glycated albumin and decreased esRAGE levels are related to angiographic severity and extent of coronary artery disease in patients with type 2 diabetes. Atherosclerosis. 206, 540–545 (2009). [DOI] [PubMed] [Google Scholar]
- Tanindi A., Sahinarslan A., Elbeg S. & Cemri M. Relationship Between MMP-1, MMP-9, TIMP-1, IL-6 and Risk Factors, Clinical Presentation, Extent and Severity of Atherosclerotic Coronary Artery Disease. Open Cardiovasc Med J. 5, 110–116 (2011). [DOI] [PMC free article] [PubMed] [Google Scholar]
- Semba R. D. et al. Serum antioxidants and inflammation predict red cell distribution width in older women: the Women’s Health and Aging Study I. Clin Nutr. 29, 600–604 (2010). [DOI] [PMC free article] [PubMed] [Google Scholar]
- Salvagno G. L., Sanchis-Gomar F., Picanza A. & Lippi G. Red blood cell distribution width: A simple parameter with multiple clinical applications. Crit Rev Clin Lab Sci. 52, 86–105 (2015). [DOI] [PubMed] [Google Scholar]
- Liu X. M. et al. The impact of red blood cell distribution width on outcome of elective percutaneous coronary intervention in non-anemia patients. Zhonghua Nei Ke Za Zhi. 55, 937–940 (2016). [DOI] [PubMed] [Google Scholar]
- Puddu P. E. et al. Red blood cell count in short-term prediction of cardiovascular disease incidence in the Gubbio population study. Acta Cardiol. 57, 177–185(2002). [DOI] [PubMed] [Google Scholar]
- Puddu P. E. et al. The role of Glycoprotein IIb/IIIa inhibitors in acute coronary syndromes and the interference with anemia. Int J. Cardiol. 222, 1091–1096 (2016). [DOI] [PubMed] [Google Scholar]
- Huang Y. L. et al. Prognostic value of red blood cell distribution width for patients with heart failure: a systematic review and meta-analysis of cohort studies. PLoS One. 9, e104861 (2014). [DOI] [PMC free article] [PubMed] [Google Scholar]
Associated Data
This section collects any data citations, data availability statements, or supplementary materials included in this article.