Abstract
Background:
Morphological changes of the vasculature system in patients with myopia have been observed by Doppler ultrasound and fundus fluorescein angiography (FFA); however, these studies have limitations. Doppler ultrasound provides low-resolution images which are mainly obtained from visualized large vessels, and FFA is an invasive examination. Optic coherence tomography (OCT) angiography is a noninvasive, high-resolution measurement for vascular density. The purpose of this study was to investigate the change of vascular density in myopic eyes using OCT angiography.
Methods:
This cross-sectional study includes a total of 91 eyes from 47 participants including control, moderate, and high myopia that were evaluated by OCT angiography. Patients with myopia were recruited from the Refractive Department, Shenzhen Aier Eye Hospital, from August 5, 2015 to April 1, 2016. Emmetropic eyes were from healthy volunteers. The vascular density at macula and optic disc regions, ganglion cell complex (GCC) thickness, and retinal nerve fiber layer (RNFL) thickness were measured. Their relationships with axial length (AL) and refractive error were analyzed. One-way analysis of variance (ANOVA), Pearson's correlation, and generalized estimating equation were used for statistical analysis.
Results:
Both superficial and deep macular vascular density were highest in control (25.64% ± 3.76% and 37.12% ± 3.66%, respectively), then in moderate myopia (21.15% ± 5.33% and 35.35% ± 5.50%, respectively), and lowest in high myopia group (19.64% ± 3.87% and 32.81% ± 6.29%, respectively) (F = 13.74 and 4.57, respectively; both P < 0.001). Both superficial (β = −0.850 and 0.460, respectively) and deep (β = −0.766 and 0.396, respectively) macular vascular density were associated with AL and spherical equivalent (all P < 0.001). Superficial macular vascular density was associated with GCC thickness (β = 0.244, P = 0.040), independent of spherical equivalent. The vascular density in optic disc region had no difference among the three groups, and it was not associated with AL, spherical equivalent, or RNFL thickness.
Conclusion:
Our results suggested that with the increase of myopia, the vascular density decreased in macular region, but not in optic disc region.
Keywords: Myopia, Optic Coherence Tomography Angiography, Vascular Density
Introduction
With the increasing dependence on smartphones, computers, and other electronic products, myopia has become the most common vision problem.[1] Recent epidemiological studies indicate an increase of myopia prevalence, especially in Asian countries.[2] It is well known that with the elongation of eyeball, highly myopic eyes show various structural changes, such as thinning of the choroid and retina, decreasing retinal nerve fiber layer (RNFL) thickness, and enlarging area of peripapillary atrophy.[3] High myopia increases the risk of developing pathologic myopia which is one of the major causes of visual impairment and blindness.[4] However, the progression into various clinical manifestations and stages of pathologic myopia is still not fully understood.
Morphological changes of the vasculature system in myopic patients have been observed. In 1977, Avetisov and Savitskaya[5] used fluorescein angiography to investigate ocular microcirculation of myopia and found delayed blood flow in high myopic eyes. Thereafter, several reports also demonstrated reduced blood flow and decreased retinal vessel diameter in myopic eyes.[6,7,8] The reduced retinal blood flow and vascular changes were thought to be involved in the degenerative changes of myopic eyes including chorioretinal atrophy, retinal thinning, and peripapillary atrophy.[6,9,10] However, these studies have been limited by low-resolution images obtained from Doppler ultrasound which mainly visualized large vessels.
Recently, a new noninvasive technique to detect retinal blood vessel by optical coherence tomography (OCT) angiography has been developed to evaluate retinal vasculature and perfusion.[11,12] The advantages of this technique include noninvasive, high-resolution, and three-dimensional (3D) demonstration of retinal vasculature.[13] It provides both morphological information of retinal vessels as well as quantitative measurement of vascular density.[14,15]
The purpose of this study was to evaluate the vascular density in macula and optic disc region of myopic eyes using OCT and to determine the factors associated with the vascular density.
Methods
Study population
This prospective study was approved by the Institutional Review Board of the Aier School of Ophthalmology, Central South University. The methods were carried out in accordance to the tenets of the Declaration of Helsinki. Patients with myopia were recruited from the Refractive Department, Shenzhen Aier Eye Hospital (Shenzhen, China), from August 5, 2015 to April 1, 2016. Emmetropic eyes were from healthy volunteers (14 eyes of seven volunteers). Written informed consent was obtained from all participants. Participants with different refractive status were divided into three groups, including high myopic group (28 eyes, spherical equivalent ≤ −6.00 Diopter [D]), moderate myopic group (33 eyes, spherical equivalent ≤−3.00 D and > −6.00D), and control group (30 eyes, spherical equivalent <3.00 D and > −3.00D).
Inclusion criteria consisted of (1) age >18 years old; (2) intraocular pressure <21 mmHg (1 mmHg = 0.133 kPa); and (3) best-corrected visual acuity (BCVA) better than 20/40. Exclusion criteria consisted of (1) a history of intraocular surgery or ocular trauma; (2) a history of posterior segment laser or scleral buckling surgery; (3) retinal detachment; (4) blurred optical media due to keratitis, cataract, or other ocular diseases; and (5) a history of hypertension and diabetes mellitus and other systemic diseases which may affect the diameter of vessels.
Study design
All participants underwent comprehensive ocular examinations, including measurements of the refractive error, BCVA, axial length (AL) using a coherence interferometry biometric measurement device (IOL Master; Carl Zeiss Meditec, Oberkochen, Germany), slit-lamp biomicroscopy, and mydriatic fundoscopic evaluation. OCT angiography was performed in all the included participants with RTVue XR OCT Avanti system (Optovue Inc., Software Version 2015.1.0, Fremont, California, USA), which uses 840 nm (bandwidth of 45 nm) light as its light source and has a scan speed of 70,000 Hz A-scans per second. The axial resolution was 8 µm and lateral resolution was 10 µm. Both eyes of each participant were examined and scanned. The following scanning protocol was used: (1) wide-field 12 mm × 9 mm scan; (2) ganglion cell complex (GCC) measurements were obtained by the MM7 protocols, which covered 7 mm × 7 mm scan area centered on the fovea; (3) 3D scan centered on the optic disc, and the peripapillary RNFL thickness was measured automatically by the previous OCT software; and (4) enface OCT angiography scans acquired over a 3 mm × 3 mm area over the macula and a 4.5 mm × 4.5 mm area over the optic disc using five repeated B-scans at 216 raster positions, with each B-scan consisting of 216 A-scans. Four volumetric raster scans including two horizontal priority (X-fast) and two vertical priority (Y-fast) scans were consecutively obtained. Best quality X- and Y-fast scans were processed by the split-spectrum amplitude decorrelation angiography algorithm, and motion artifacts were removed by 3D orthogonal registration and merging of two scans.[16] The segmentation results were reviewed, and the images with segmentation error were excluded [Figure 1a and 1c]. Images with poor signal strength (signal strength index <50) and severe motion artifact were also excluded [Figure 1b and 1d].
Figure 1.
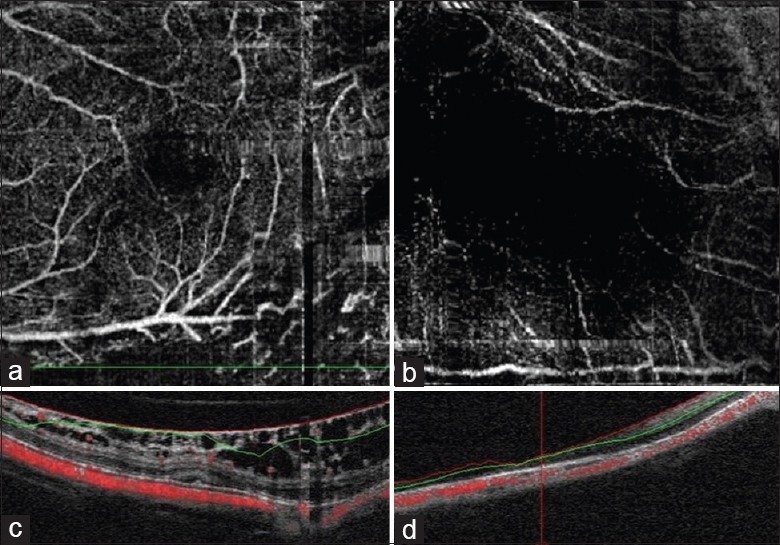
Example of the cases which were excluded because of segmentation error due to retinoschisis (a and c) and signal strength <50 (b and d).
Macular superficial, deep, and optic disc angiograms were exported and imported into a public available software, Image J (version 1.49, National Institutes of Health, Bethesda, Maryland, USA), for image processing and vascular density measurement. Superficial and deep retinal vascular density on macular and optic disc area were calculated as previously described in literature.[17] Binary images of vascular networks were created using an automated thresholding algorithm. Vascular density was defined as the percentage area occupied by blood vessels, with the blood vessels being defined as pixels having values above the threshold level [Figure 2].
Figure 2.
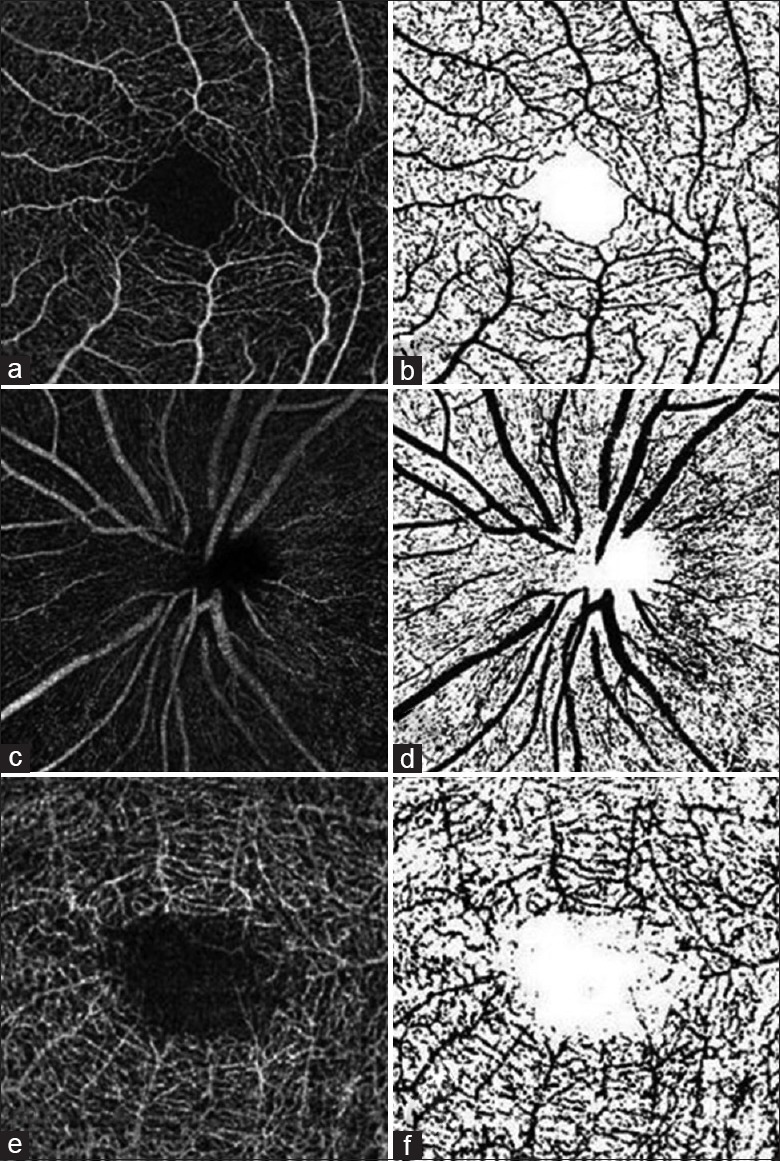
Retinal angiograms processed using Image J software. The original macula (a and e) and optic disc (c) angiograms were processed with an automated thresholding algorithm, and the binary images of vascular networks were created (b, d, and f). Vascular density was calculated automatically.
Statistical analysis
Statistical analysis was performed using a commercially available statistical software package, SPSS for Windows (version 19.0, SPSS, Inc., Chicago, IL). The distribution of age, gender, AL, spherical equivalent, superficial and deep retinal vascular density on macular and optic disc regions, peripapillary RNFL thickness, and GCC was compared between each group using one-way analysis of variance (ANOVA). Least Significant Difference was used for post hoc test. Relationship between macular vascular density, GCC thickness, spherical equivalent, AL, optic head vascular density, and RNFL thickness was assessed using Pearson's correlation. Generalized estimating equation adjusting for inter-eye correlation was used to investigate the relationship of parameters. A value of P < 0.05 was considered statistically significant.
Results
One hundred and eleven eyes of 57 participants with different refractive statuses were included in this study. Twenty eyes were excluded from the analysis due to poor signal strength and segmentation error. Finally, 91 eyes from 47 participants were evaluated and analyzed in this study. These 91 eyes were divided into three groups: control (28 eyes), moderate myopia (33 eyes), and high myopia (30 eyes) groups.
Comparisons of the parameters among the three groups were shown in Table 1. There was no significant difference in age among the three groups. The mean ALs of control, moderate myopia, and high myopia groups were 23.28 ± 0.48 mm, 24.98 ± 0.49 mm, and 29.01 ± 2.69 mm, respectively. The mean spherical equivalences of control, moderate myopia, and high myopia groups were −0.68 ± 0.68 D, −3.84 ± 1.34 D, and −11.63 ± 5.36 D, respectively. The high myopia group had worse BCVA compared to the other two groups (P < 0.001).
Table 1.
Comparison of the eyes of different refractive statuses
| Parameters | Control (n = 28) | Moderate myopia (n = 33) | High myopia (n = 30) | F | P |
|---|---|---|---|---|---|
| Age (year) | 34.14 ± 15.79 | 30.94 ± 4.10 | 36.33 ± 14.73 | 1.54 | 0.220 |
| Axial length (mm) | 23.28 ± 0.48 | 24.98 ± 0.49 | 29.01 ± 2.69 | 100.00 | <0.001 |
| Spherical equivalent (Diopter) | −0.68 ± 0.68 | −3.84 ± 1.34 | −11.63 ± 5.36 | 86.84 | <0.001 |
| Ganglion cell complex thickness (µm) | 101.96 ± 5.72 | 96.68 ± 5.03 | 94.23 ± 7.60 | 9.56 | <0.001 |
| Retinal nerve fiber layer thickness (µm) | 111.24 ± 9.34 | 101.74 ± 9.44 | 97.00 ± 10.28 | 13.54 | <0.001 |
| Visual acuity (LogMAR)* | 0 (0–0.10) | 0 (0–0.22) | 0.07 (0–1.00) | 10.17 | <0.001 |
| Superficial macular vascular density (%) | 25.64 ± 3.76 | 21.15 ± 5.33 | 19.64 ± 3.87 | 13.74 | <0.001 |
| Deep macular vascular density (%) | 37.12 ± 3.66 | 35.35 ± 5.50 | 32.81 ± 6.29 | 4.57 | 0.013 |
| Optic head vascular density (%) | 27.58 ± 4.64 | 28.54 ± 3.45 | 29.82 ± 4.97 | 1.62 | 0.200 |
Data were presented with mean ± SD or *Median (range). SD: Standard deviation.
The superficial retinal vascular density of macula in high myopia (19.64% ± 3.87%) and moderate myopia groups (21.15% ± 5.33%) was significantly less than control (25.64% ± 3.76%, all P < 0.01) group. The deep retinal vascular density in the high myopia group (32.81% ± 6.29%) was also less than that in control group (37.12% ± 3.66%, both P < 0.05), while the deep vascular density in moderate myopia (35.35% ± 5.50%) group was between these two groups [Table 1 and Figure 3]. The RNFL thickness and GCC thickness were also lowest in the high myopia group and highest in the control group [Table 1]. The superficial retinal vascular density in 4.5 mm × 4.5 mm optic area was not statistically significantly different among the three groups.
Figure 3.
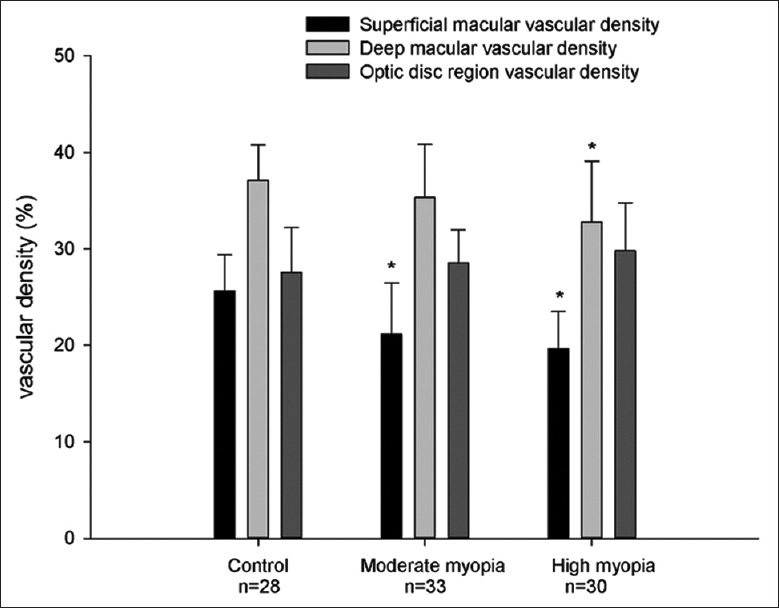
Bar charts showing the superficial macular vascular density and deep macular vascular density in control, moderate myopic, and high myopic groups. *P < 0.01 compared to control group, Least Significant Difference test.
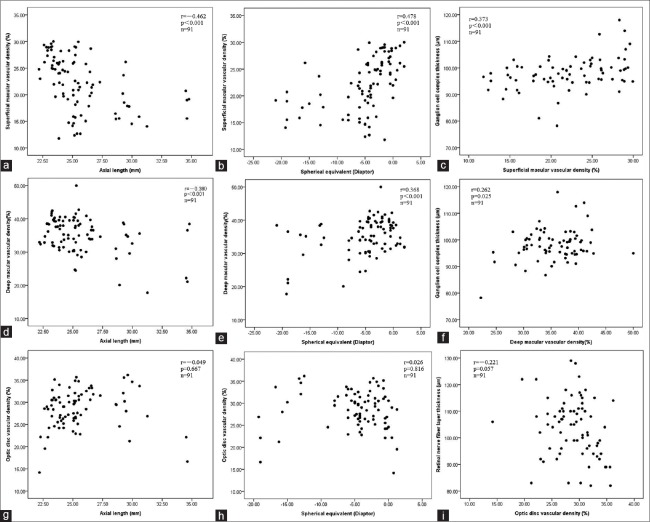
Figure 4 shows the scatter plots and Pearson's correlation coefficients of vascular density at macular and optic disc regions with AL, spherical equivalent, GCC thickness, and RNFL thickness. After adjusting for inter-eye correlation using generalized estimating equation, the superficial macular vascular density was significantly associated with AL (beta coefficient [β] = −0.850, P < 0.001), spherical equivalent (β= 0.460, P < 0.001), and GCC thickness (β= 0.308, P = 0.001). The deep vascular density was also significantly associated with AL (β= −0.766, P < 0.001), spherical equivalent (β= 0.396, P = 0.001), and GCC thickness (β= 0.230, P = 0.018). The vascular density in 4.5 mm × 4.5 mm optic disc region was not associated with AL, spherical equivalent, or RNFL thickness (β= 0.042, 0.007 and −0.092, respectively, all P > 0.05).
Figure 4.
Scatterplots showing the correlation between superficial macular vascular density and axial length (a) spherical equivalent (b) ganglion cell complex thickness (c) deep macular vascular density and axial length (d) spherical equivalent (e) ganglion cell complex thickness (f) papillary vascular density and axial length (g) spherical equivalent (h) retinal nerve fiber layer thickness (i). r is the correlation coefficient and P values were calculated by Pearson's correlation.
We further found that both spherical equivalent and superficial macular vascular density were the independent factors associated with GCC thickness (β= −0.616, P = 0.001 and β= 0.244, P = 0.040, respectively), in the multiple regression model, after adjusting for inter-eye correlation. Images of OCT angiograms in eyes with various ALs were shown in Figures 5 and 6. Eyes with longer ALs had less superficial and deep vascular density in macular region.
Figure 5.
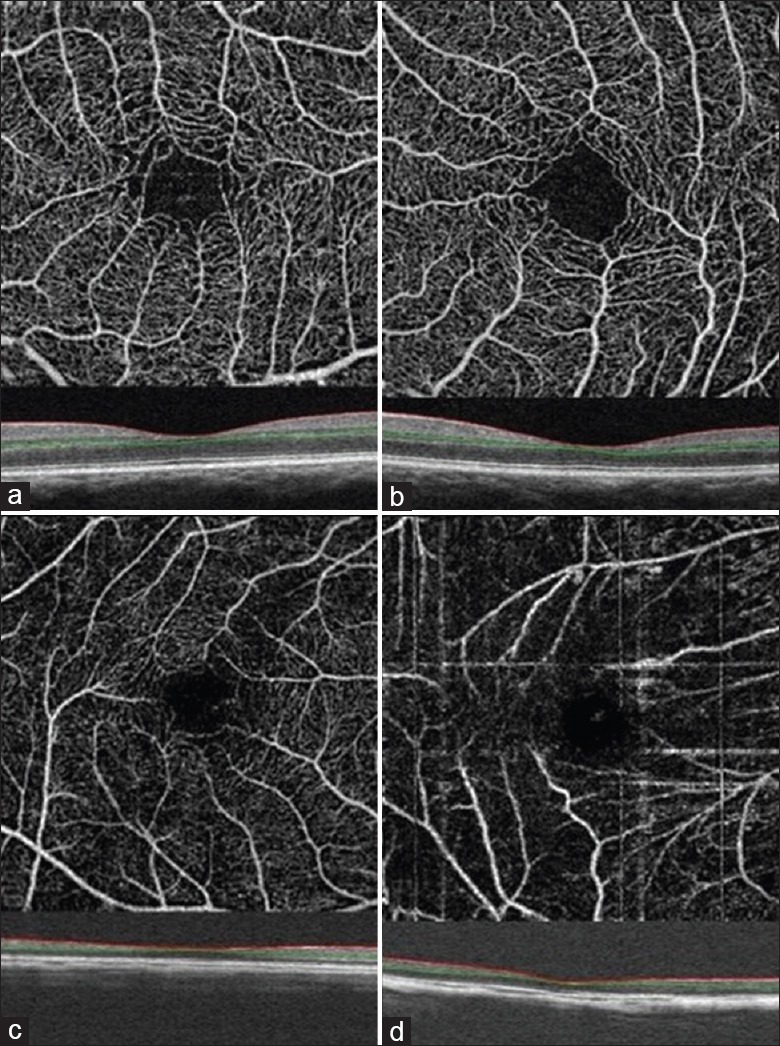
Optical coherence tomography angiography images of superficial macular vessels in eyes with various axial lengths: the axial length is 23.30 mm (a) 26.11 mm (b) 29.47 mm (c) 34.62 mm (d). Red and green lines show the optical coherence tomography segmentation for reconstruction of angiogram.
Figure 6.
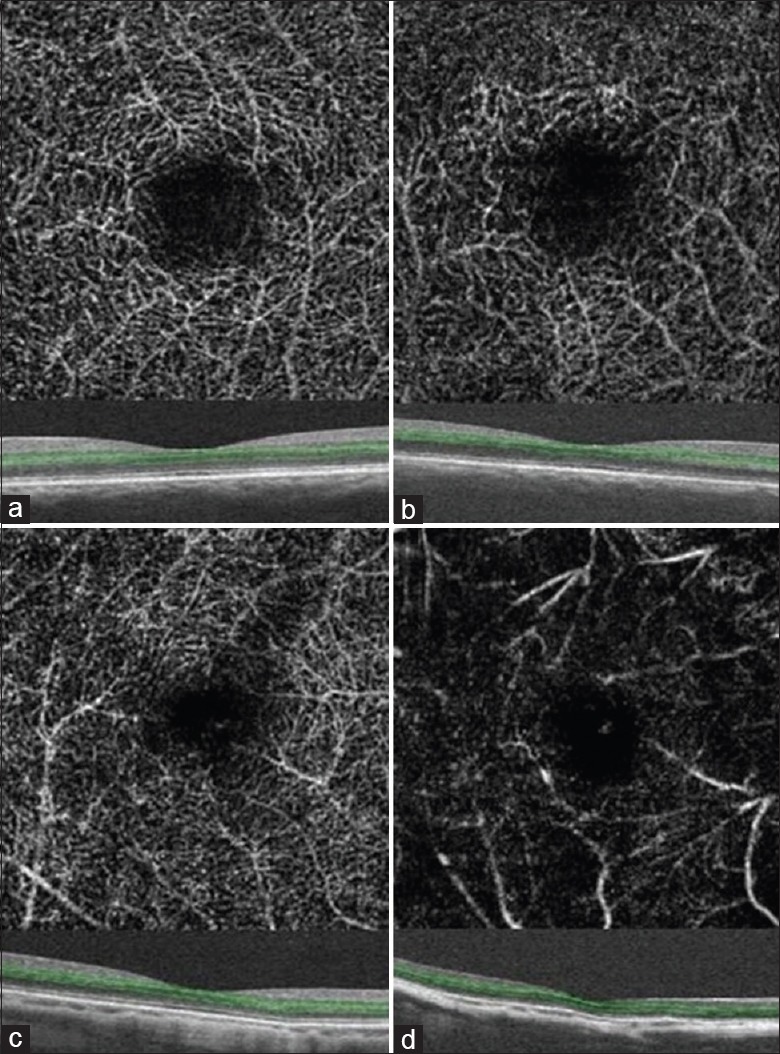
Optical coherence tomography angiography images of deep macular vessels in eyes with various axial lengths: the axial length is 24.19 mm (a) 26.47 mm (b) 29.47 mm (c) 34.62 mm (d). Green lines show the optical coherence tomography segmentation for reconstruction of angiogram.
Discussion
In this study, we investigated the vascular densities of macular and optic disc regions in 91 eyes of different refractive statuses using OCT angiography. We found that decreased superficial and deep vascular density in macular area were associated with longer AL, higher degree of myopia, and decreased GCC thickness. Multiple linear regression model showed that the association of macular vascular density and GCC thickness was independent of spherical equivalent. The vascular density in optic disc area was not associated with spherical equivalent, AL, or RNFL thickness.
In a prior study, Wang et al.[18] also evaluated myopic eyes using OCT angiography. In contrary to our study, they reported that there is no difference in the parafoveal retinal vascular density (P = 0.823) among groups of different refractive statuses. However, Wang et al.[18] did not include eyes with pathologic myopic eyes which had chorioretinal atrophy, lacquer cracks, lattice degeneration, staphylomas, and paving stone degeneration. We did not exclude patients with myopia with peripheral retinal degeneration since peripheral retinal degeneration is very common in myopia, especially high myopia. Exclusion of such subjections may lead to selection bias. Furthermore, in our study, we also included higher myopia. The mean SE was only −8.0 D in their high myopia group but −11.63 D in our group. Our study has wider spectrum in different severity of high myopia.
Decreased blood flow and perfusion of retinal vessels in myopic eyes have been reported in previous studies. Karczewicz and Modrzejewska[19] found decreased blood flow in myopia using Doppler ultrasonography. Zheng et al.[20] investigated retinal vessel diameter in high myopia and found that both retinal arteriole and venue diameter were narrower than emmetropic eyes. Shimada et al.[6] demonstrated reduced retinal blood flow in high myopia and they thought that the decrease of blood flow was mainly due to narrowing of vessels. The mechanism of decreased blood flow and perfusion in myopic eyes is unknown. In the present study, the macular vascular density in myopic eyes, especially high myopic eyes, decreased. The hypothesis is that with the elongation and expansion of the eyeball in high myopic eyes, the retinal vessels were straightened and attenuated, which led to decreased blood flow and perfusion. In a study using fractal dimension to measure the density of retinal vasculature complex, the loss of retinal vascular density with moderate-to-high myopia has been reported.[21,22]
Our study also found that macular vascular density is associated with the GCC thickness. The association is dependent of refractive error. GCC consists of the three innermost layers of the retina: inner plexiform layer, ganglion cell layer, and nerve fiber layer, which was supplied by the superficial retinal vessel.[23] Therefore, it is not surprising to find the positive correlation. The decrease of ganglion cells lowered the retinal oxygen requirement of the retina, which is associated with the reduction of vascular density in highly myopic eyes.
In the present study, we did not find statistical difference of vascular density in optic disc area between the three groups, which is also contradictory to the report of Wang et al.[18] One of the possible explanations may be the different method and different area measurement used in different studies. In the study by Wang et al.,[18] the peripapillary region was defined as a 700 µm-wide elliptical annulus extending outward from the optic disc boundary while we measured the entire 4.5 mm × 4.5 mm region centered on optic disc.
Some of the artifacts in OCT angiography are caused by segmentation error or poor image quality.[24,25] Due to the steep posterior segment curvatures in some high myopic eyes which is sometimes irregular, patients are prone to segmentation error. In our study, the autosegmented slabs generated from the inbuilt software were carefully reviewed and the cases with segmentation error were excluded. Poor-quality images were also excluded from the study.
There are some limitations in this study, including the relative small number of participants and no measurement of the retinal flow index. The mechanism of decreased macular vascular density in high myopia is still not clear. Causality of vessel changes and retinal atrophy in myopia still needs further research.
In conclusion, noninvasive technique of OCT angiography demonstrated that with the increase of AL, the superficial and deep retinal vascular density decreased in macular region, but not in optic disc region.
Financial support and sponsorship
This study was supported by the grants from the Fundamental Research Funds for the Central Universities of Central South University (No. 2016zzts161), and the Shenzhen Municipal Science and Technology Innovation Committee (No. JCYJ20150401151333974).
Conflicts of interest
There are no conflicts of interest.
Footnotes
Edited by: Ning-Ning Wang
References
- 1.Gong JF, Xie HL, Mao XJ, Zhu XB, Xie ZK, Yang HH, et al. Relevant factors of estrogen changes of myopia in adolescent females. Chin Med J. 2015;128:659–63. doi: 10.4103/0366-6999.151669. doi: 10.4103/0366-6999.151669. [DOI] [PMC free article] [PubMed] [Google Scholar]
- 2.Foster PJ, Jiang Y. Epidemiology of myopia. Eye (Lond) 2014;28:202–8. doi: 10.1038/eye.2013.280. doi: 10.1038/eye.2013.280. [DOI] [PMC free article] [PubMed] [Google Scholar]
- 3.Ng DS, Cheung CY, Luk FO, Mohamed S, Brelen ME, Yam JC, et al. Advances of optical coherence tomography in myopia and pathologic myopia. Eye (Lond) 2016;30:901–16. doi: 10.1038/eye.2016.47. doi: 10.1038/eye.2016.47. [DOI] [PMC free article] [PubMed] [Google Scholar]
- 4.Xu L, Wang Y, Li Y, Wang Y, Cui T, Li J, et al. Causes of blindness and visual impairment in urban and rural areas in Beijing: The Beijing Eye Study. Ophthalmology. 2006;113:1134.e1–11. doi: 10.1016/j.ophtha.2006.01.035. doi: 10.1016/j.ophtha.2006.01.035. [DOI] [PubMed] [Google Scholar]
- 5.Avetisov ES, Savitskaya NF. Some features of ocular microcirculation in myopia. Ann Ophthalmol. 1977;9:1261–4. [PubMed] [Google Scholar]
- 6.Shimada N, Ohno-Matsui K, Harino S, Yoshida T, Yasuzumi K, Kojima A, et al. Reduction of retinal blood flow in high myopia. Graefes Arch Clin Exp Ophthalmol. 2004;242:284–8. doi: 10.1007/s00417-003-0836-0. doi: 10.1007/s00417-003-0836-0. [DOI] [PubMed] [Google Scholar]
- 7.Karczewicz D, Modrzejewska M. Blood flow in eye arteries assessed by Doppler ultrasound in patients with myopia. Klin Oczna. 2004;106(1-2 Suppl):211–3. [PubMed] [Google Scholar]
- 8.Benavente-Perez A, Hosking SL, Logan NS, Broadway DC. Ocular blood flow measurements in healthy human myopic eyes. Graefes Arch Clin Exp Ophthalmol. 2010;248:1587–94. doi: 10.1007/s00417-010-1407-9. doi: 10.1007/s00417-010-1407-9. [DOI] [PubMed] [Google Scholar]
- 9.Mrugacz M, Bryl A. Evaluation of the arterial blood flow parameters in the eye of myopic patients. Pol Merkur Lekarski. 2013;34:205–9. [PubMed] [Google Scholar]
- 10.Bryl A, Mrugacz M, Mariak Z. Blood flow in vessels supplying the eye in persons with degenerative myopia. Part II. Blood flow in the central retinal artery. Klin Oczna. 2013;115:222–5. [PubMed] [Google Scholar]
- 11.Matsunaga D, Yi J, Puliafito CA, Kashani AH. OCT angiography in healthy human subjects. Ophthalmic Surg Lasers Imaging Retina. 2014;45:510–5. doi: 10.3928/23258160-20141118-04. doi: 10.3928/23258160-20141118-04. [DOI] [PubMed] [Google Scholar]
- 12.Li J, Yang YQ, Yang DY, Liu XX, Sun YX, Wei SF, et al. Reproducibility of perfusion parameters of optic disc and macula in rhesus monkeys by optical coherence tomography angiography. Chin Med J. 2016;129:1087–90. doi: 10.4103/0366-6999.180532. doi: 10.4103/0366-6999.180532. [DOI] [PMC free article] [PubMed] [Google Scholar]
- 13.Nagiel A, Sadda SR, Sarraf D. A Promising future for optical coherence tomography angiography. JAMA Ophthalmol. 2015;133:629–30. doi: 10.1001/jamaophthalmol.2015.0668. doi: 10.1001/jamaophthalmol.2015.0668. [DOI] [PubMed] [Google Scholar]
- 14.Jia Y, Bailey ST, Hwang TS, McClintic SM, Gao SS, Pennesi ME, et al. Quantitative optical coherence tomography angiography of vascular abnormalities in the living human eye. Proc Natl Acad Sci U S A. 2015;112:E2395–402. doi: 10.1073/pnas.1500185112. doi: 10.1073/pnas.1500185112. [DOI] [PMC free article] [PubMed] [Google Scholar]
- 15.Wang X, Jiang C, Ko T, Kong X, Yu X, Min W, et al. Correlation between optic disc perfusion and glaucomatous severity in patients with open-angle glaucoma: An optical coherence tomography angiography study. Graefes Arch Clin Exp Ophthalmol. 2015;253:1557–64. doi: 10.1007/s00417-015-3095-y. doi: 10.1007/s00417-015-3095-y. [DOI] [PubMed] [Google Scholar]
- 16.Jia Y, Tan O, Tokayer J, Potsaid B, Wang Y, Liu JJ, et al. Split-spectrum amplitude-decorrelation angiography with optical coherence tomography. Opt Express. 2012;20:4710–25. doi: 10.1364/OE.20.004710. doi: 10.1364/OE.20.004710. [DOI] [PMC free article] [PubMed] [Google Scholar]
- 17.Shahlaee A, Samara WA, Hsu J, Say EA, Khan MA, Sridhar J, et al. In vivo assessment of macular vascular density in healthy human eyes using optical coherence tomography angiography. Am J Ophthalmol. 2016;165:39–46. doi: 10.1016/j.ajo.2016.02.018. doi: 10.1016/j.ajo.2016.02.018. [DOI] [PubMed] [Google Scholar]
- 18.Wang X, Kong X, Jiang C, Li M, Yu J, Sun X. Is the peripapillary retinal perfusion related to myopia in healthy eyes?A prospective comparative study. BMJ Open. 2016;6:e010791. doi: 10.1136/bmjopen-2015-010791. doi: 10.1136/bmjopen-2015-010791. [DOI] [PMC free article] [PubMed] [Google Scholar]
- 19.Karczewicz D, Modrzejewska M. Assessment of blood flow in eye arteries in patients with myopia and glaucoma. Klin Oczna. 2004;106(1-2 Suppl):214–6. [PubMed] [Google Scholar]
- 20.Zheng Q, Zong Y, Li L, Huang X, Lin L, Yang W, et al. Retinal vessel oxygen saturation and vessel diameter in high myopia. Ophthalmic Physiol Opt. 2015;35:562–9. doi: 10.1111/opo.12223. doi: 10.1111/opo.12223. [DOI] [PubMed] [Google Scholar]
- 21.Jiang Y, Li Y, Liu XW, Xu J. A Novel Tectonic Keratoplasty with Femtosecond Laser Intrastromal Lenticule for Corneal Ulcer and Perforation. Chin Med J. 2016;129:1817–21. doi: 10.4103/0366-6999.186639. doi: 10.4103/0366-6999.186639. [DOI] [PMC free article] [PubMed] [Google Scholar]
- 22.Azemin MZ, Daud NM, Ab Hamid F, Zahari I, Sapuan AH. Influence of refractive condition on retinal vasculature complexity in younger subjects. Scientific World Journal 2014. 2014 doi: 10.1155/2014/783525. 783525. doi: 10.1155/2014/783525. [DOI] [PMC free article] [PubMed] [Google Scholar]
- 23.Zhang X, Francis BA, Dastiridou A, Chopra V, Tan O, Varma R, et al. Longitudinal and cross-sectional analyses of age effects on retinal nerve fiber layer and ganglion cell complex thickness by fourier-domain OCT. Transl Vis Sci Technol. 2016;5:1. doi: 10.1167/tvst.5.2.1. doi: 10.1167/tvst.5.2.1. [DOI] [PMC free article] [PubMed] [Google Scholar]
- 24.Wang LL, Liu WJ, Liu HY, Xu X. Single-site Baseline and Short-term Outcomes of Clinical Characteristics and Life Quality Evaluation of Chinese Wet Age-related Macular Degeneration Patients in Routine Clinical Practice. Chin Med J. 2015;128:1154–9. doi: 10.4103/0366-6999.156083. doi: 10.4103/0366-6999.156083. [DOI] [PMC free article] [PubMed] [Google Scholar]
- 25.Spaide RF, Fujimoto JG, Waheed NK. Image artifacts in optical coherence tomography angiography. Retina. 2015;35:2163–80. doi: 10.1097/IAE.0000000000000765. doi: 10.1097/IAE.0000000000000765. [DOI] [PMC free article] [PubMed] [Google Scholar]


