

Abstract
Purpose
To validate the Perceived Stress Scale (PSS) in patients with age-related macular degeneration (AMD) using Rasch analysis.
Methods
Study participants with AMD were recruited from the retina service of the Department of Ophthalmology at the Ohio State University during clinical visits for treatment or observation. Visual acuity with habitual distance correction was assessed. A 10-item version of the PSS was administered in large print or by reading the items to the patient. Rasch analysis was used to investigate the measurement properties of the PSS, including fit to the model, ability to separate between people with different levels of perceived stress, category response structure performance, and unidimensionality.
Results
137 patients with a diagnosis of AMD were enrolled. The mean (±SD) age of participants was 82 ± 9 years. 54% were female. Median ETDRS visual acuity of the better eye was 65 letters (Snellen 20/50), with a range of approximately 20/800 to 20/15. 47% of participants were receiving an anti-VEGF injection on the day of the study visit. The response category structure was appropriate. One item, “How often have you felt confident in your ability to handle your personal problems?” was removed due to poor fit statistics. The remaining nine items showed good fit to the model, acceptable measurement precision as assessed by the Rasch person separation statistic, and unidimensionality. There was some evidence of differential item functioning by age and visual acuity.
Conclusions
The Perceived Stress Scale demonstrated acceptable measurement properties and may be useful for the measurement of perceived stress in patients with AMD.
Keywords: perceived stress, age-related macular degeneration, low vision, Rasch analysis, patient-reported outcome measures
Age-related macular degeneration is associated with a number of negative psychological consequences, including depression and anxiety.1–5 The relationship between age-related macular degeneration (AMD) and perceived stress has not been studied as thoroughly as AMD’s relationship with depression. Williams et al. reported that responses by patients with AMD on the Profiles of Mood States survey, which assesses a range of aspects of emotional distress, were significantly worse than for age-matched adults without AMD. Self-reported emotional distress in AMD patients was comparable to that reported in several other serious chronic conditions, including melanoma and bone marrow transplant.6
The Perceived Stress Scale was developed to assess the degree to which events in one’s life are deemed stressful and to evaluate the role of stress in various aspects of disease.7 The original questionnaire was composed of 14 items, and a second 10-item version was later proposed.8 The original report on the validation of the questionnaire found a coefficient alpha reliability ranging from 0.84 to 0.86, good test-retest correlation, and correlation between Perceived Stress Scale scores and number of stressful life events. The authors also found that Perceived Stress Scale scores were correlated with health outcomes, and that there was minimal effect of age or gender on any of the indicators of validity. Subsequent validation studies have also demonstrated good reliability as measured by Cronbach’s alpha and correlations with health outcomes.9–12 The Perceived Stress Scale has been cited in thousands of publications and used as a measure of stress in a number of diverse populations and across a wide range of health conditions.
Rasch analysis has been used to score and investigate the psychometric properties of many vision and health patient-reported outcome measures.13–19 Its advantages over traditional methods of questionnaire scoring and evaluation include interval-level scores from the ordinal survey responses, model fit statistics that provide guidance for inclusion or exclusion of individual items, and information about how well the questionnaire response category functions, how well the questionnaire targets the population, and whether the questions measure one latent construct (unidimensionality).18, 20, 21 We are not aware of any previous study of the Perceived Stress Scale in people with age-related macular degeneration, and only one other evaluation of the survey using Rasch analysis.22
Purpose
There are a number of potential stressors that a person with AMD might face, including the prospect of permanent vision loss, the inability to complete valued activities, and intraocular injection treatment. Psychological stress has been shown to increase the risk of cardiovascular disease, diabetes, and depression.23–26 Given the known consequences of stress on health, measuring perceived stress in people with AMD could provide valuable information for providing clinical care and for research on treatment outcomes. Additionally, perceived stress as measured by the Perceived Stress Scale has been shown to be predictive of inflammation, including C-reactive protein levels.27 As AMD is an inflammatory disease, we are currently conducting a study of the relationships among stress, inflammation, and AMD treatment outcomes. The motivation for the present study was to investigate the psychometric properties of the Perceived Stress Scale in patients with age-related macular degeneration using Rasch analysis in order to assess its potential usefulness as a measure of perceived stress in this population.
METHODS
Participants
Study participants were recruited from the retina service of the Department of Ophthalmology at the Ohio State University. All patients with a diagnosis of AMD were eligible. Participants were recruited and study visits were conducted at the same time as previously-scheduled clinic visits. Some of these visits were for administration of anti-VEGF injections, while others were for regular follow-up observation of AMD. Study procedures were reviewed and approved by the Institutional Review Board of the Ohio State University. All participants provided informed consent, and study procedures conformed to the tenets of the Declaration of Helsinki.
Vision Measurement
Visual acuity with habitual distance correction was assessed using a backlit ETDRS chart.28 (Precision Vision, La Salle, IL) Participants were encouraged to guess and testing was stopped when at least three letters were missed on a line. A by-letter scoring method was used.29–31
Survey
The 10-item Perceived Stress Scale was printed in very large print, one item with all response options per page. Each participant was shown the first item of the survey and asked if they felt they could read it well enough to complete the survey alone. Participants who indicated that they could comfortably read the survey completed it by marking their responses on the paper form. Those who indicated that they could not read the survey well enough to complete it alone were administered the survey in an interview format. Study staff read each item and all response options to the participant and then marked his or her response to each.
In order to determine the amount of the latent variable (perceived stress), the Perceived Stress Scale requires subjects to rate each item considering a time frame of the past month. The Perceived Stress Scale uses the following response options: “Never”, “Almost Never”, “Sometimes”, “Fairly Often”, and “Very Often”. Participants were instructed that they were free to skip any question that they were uncomfortable with or did not want to answer. Responses were assigned a numerical value (0–4) for Rasch analysis, and responses to positively worded items (items 4, 5, 7, and 8) were reversed before analysis so that higher scores were always indicative of more perceived stress.
Rasch Analysis
The methods we used to evaluate the Perceived Stress Scale have previously been explained in detail by other authors,20, 32–35 and we used published guidelines for evaluation of scale validity.32 Briefly, we began by investigating the functioning of the response categories. To do this, we investigated the category response probability curves and category thresholds. Category thresholds are the points where the probability of a response in each of adjacent response categories is equal (or the point at which the response probability curves cross (see Figure 1)). Disordered thresholds indicate inadequate response category functioning. In cases of disordered thresholds, adjacent response categories were combined and the analysis repeated until the thresholds were ordered.
Figure 1.
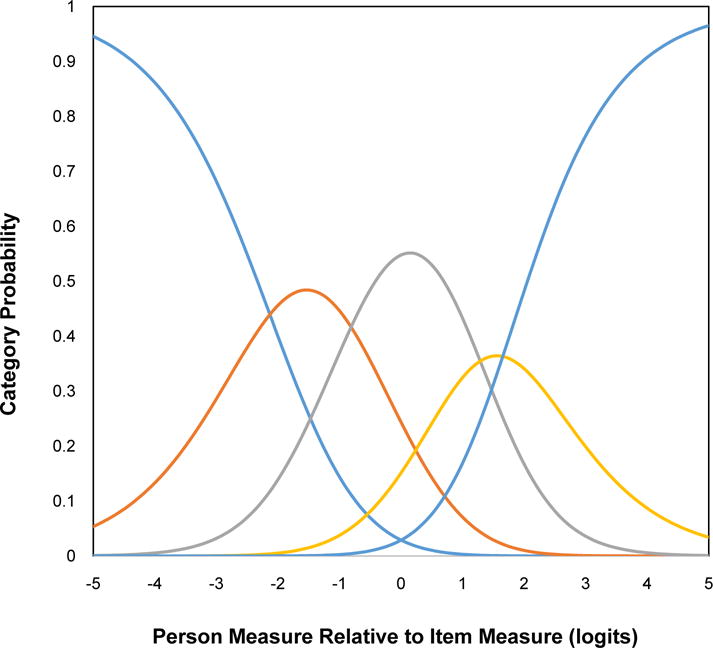
Category response probability curves for nine-item set.
Once it was established that response category functioning was appropriate, we checked the fit of each survey question (item) to the Rasch model using the infit mean square statistic. The infit mean square statistic is a chi-square like statistic with an expected value of 1 that indicates the degree to which observations fit the expectations of the Rasch model.33, 34 Infit mean square values less than 0.6 and greater than 1.4 were considered as evidence of misfit,36 and those items were removed and the analysis repeated until all items had satisfactory fit statistics.
In order to evaluate measurement precision (the ability to discriminate between people with different levels of the underlying trait), we used the person separation coefficient statistic, with values greater than 2.0 considered as evidence of acceptable precision.32 The person separation statistic is a ratio of the standard deviation of the measures to the error standard deviation.34
Unidimensionality of the measured latent trait is a requirement of the Rasch model. Acceptable fit of all items to the model is one indicator that the assumption of unidimensionality is met. Another technique for the assessment of unidimensionality is the use of a principal component analysis of the model residuals. If the scale is unidimensional, there should be no significant structure in these residuals.37, 38 We performed a PCA of the model residuals, with an eigenvalue of 2.0 or greater on the first contrast considered as evidence of multidimensionality.
We also investigated whether there was differential item functioning (DIF) by gender, age, or visual acuity of the better eye (above and equal to or below the median). DIF occurs when a survey question has different meaning or difficulty for two different samples (e.g. males and females). DIF of 0.5 logits or greater may indicate item bias.34 Rasch analysis was performed using the Andrich rating scale model39, 40 with Winsteps version 3.69.1.41
RESULTS
One-hundred thirty seven patients with a diagnosis of AMD were enrolled. The mean (±SD) age of participants was 82 ± 9 years. 54% were female. Median ETDRS visual acuity of the better eye was 65 (Snellen 20/50), with a range of approximately 20/800 to 20/15. 47% of participants were receiving an anti-VEGF injection on the day of the study visit.
The response category probability curves from the Rasch analysis are shown in Figure 1. Each curve shows the probability of a response in a certain category as a function of the difference between the amount of the underlying trait possessed by the responder (Rasch person measure) and the amount of the trait required for endorsement (Rasch item measure). These curves indicate that the response category structure of the instrument was acceptable, with ordered response categories.
Table 1 shows the infit mean square statistics for the Rasch analysis. In the first analysis, which included all 10 items, item number 4 (How often have you felt confident in your ability to handle your personal problems?) showed a fit statistic value outside of the recommended range. A second analysis was performed with item 4 removed, and in this analysis the remaining nine items all had fit statistics within the range of 0.6 to 1.4. This nine-item set was used for the remaining analyses.
Table 1.
Rasch Model Item Measures and Fit Statistics.
| Item | Rasch Item Measure (SE) | Infit Mean Square Statistic | ||
|---|---|---|---|---|
| First Analysis | Second Analysis | First Analysis | Second Analysis | |
| 1. Upset because something happened unexpectedly | – 0.44 (0.11) | – 0.42 (0.11) | 1.29 | 1.33 |
| 2. Unable to control the important things in life | – 0.06 (0.11) | – 0.02 (0.12) | 0.95 | 0.96 |
| 3. Felt nervous and stressed | – 0.73 (0.11) | – 0.74 (0.11) | 0.79 | 0.79 |
| 4. Felt confident about your ability to handle your personal problems | 0.45 (0.12) | * | 1.66 | * |
| 5. Felt that things were going your way | 0.13 (0.12) | 0.20 (0.12) | 1.18 | 1.37 |
| 6. Found that you could not cope with all of the things you had to do | – 0.06 (0.11) | – 0.02 (0.12) | 0.94 | 0.98 |
| 7. Able to control the irritations in your life | 0.40 (0.12) | 0.49 (0.12) | 0.82 | 0.95 |
| 8. Felt that you were on top of things | 0.29 (0.12) | 0.37 (0.12) | 0.92 | 1.05 |
| 9. Angered because of things that were outside of your control | – 0.46 (0.11) | – 0.45 (0.11) | 0.81 | 0.83 |
| 10. Felt difficulties were piling up so high that you could not overcome them | 0.49 (0.12) | 0.59 (0.13) | 0.72 | 0.77 |
Table 2 shows summary statistics for the nine-item set. The nine-item set had a Rasch person separation coefficient of 2.09, indicating acceptable ability to separate between people with different levels of perceived stress. The item reliability statistic was 0.92, indicating good predicted replicability of item calibrations for similar samples. A principal components analysis of the model residuals showed that no contrast had an eigenvalue greater than 1.9, which provides evidence that the model assumption of unidimensionality was reasonable.
Table 2.
Rasch Summary Statistics for the Perceived Stress Scale.
| Item Set | Mean Rasch Person Measure (SE) | Mean Rasch Item Measure (SE) | Person Reliability | Item Reliability | Mean Item Infit Mean Square |
|---|---|---|---|---|---|
| 10 Item | −1.25 (0.10) | 0.0 (0.13) | 0.80 | 0.91 | 1.01 |
| 9 Item (item 4 removed) | −1.29 (0.11) | 0.0 (0.15) | 0.81 | 0.92 | 1.00 |
An examination of the targeting of the Perceived Stress Scale to the participants surveyed showed targeting of the instrument to the sample of participants was not ideal, with a separation of 1.26 logits between the mean item measure and the mean person measure. Ideally, this difference would be smaller, indicating better matching between the mean stress level perceived by subjects and the mean level required by the questions. The person-item map in Figure 2 shows that the Perceived Stress Scale items generally required more perceived stress for endorsement than the level of perceived stress of the participants.
Figure 2.
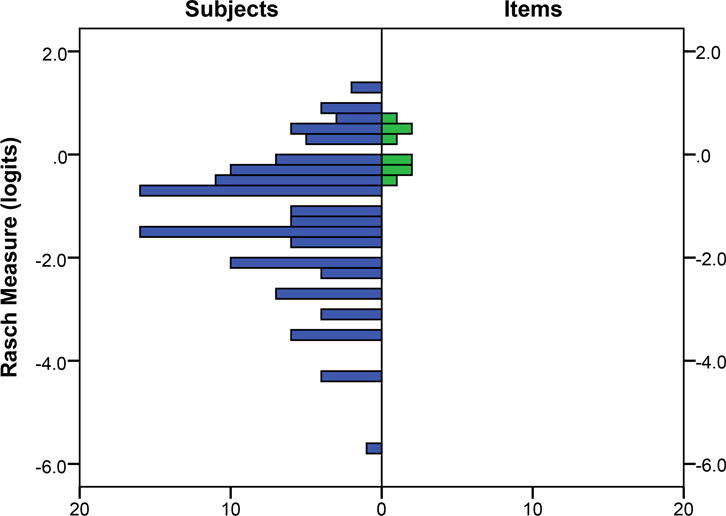
Targeting of the nine-item Perceived Stress Scale. The X axis shows frequency for subjects (left side) and items (right side).
We also completed an analysis of differential item functioning (DIF, or “item bias”) by age, gender, and visual acuity. None of the Perceived Stress Scale items exhibited evidence of significant DIF (greater than 0.5 logits) by gender. Two items, “I felt nervous or stressed” (0.54 logits) and “I felt on top of things” (0.63 logits) showed some evidence of DIF by age. Younger participants found it easier to endorse the “I felt nervous or stressed” item and more difficult to endorse the “I felt on top of things” item than participants above the median age. Two items, “I was upset by things that normally do not upset me” (0.59 logits) and “I felt things were going my way” (0.64 logits) showed some evidence of DIF by better-eye visual acuity. Participants with VA worse than the median value found it easier to endorse the “I was upset by things that normally do not upset me” item and also the “I felt things were going my way” item. There was no significant correlation between better-eye visual acuity and Perceived Stress Scale person measure (r = – 0.04, p = 0.64).
DISCUSSION
A nine-item form of the Perceived Stress Scale Perceived Stress Scale demonstrated acceptable psychometric properties in patients being managed for age-related macular degeneration (AMD). Over the past thirty years, various versions of the Perceived Stress Scale have been used in a wide range of populations. This is the first evaluation of the Perceived Stress Scale in people with AMD of which we are aware. The Rasch analysis presented here showed that the questionnaire demonstrated reasonable measurement precision, evidence of unidimensionality, and a properly functioning response category structure. The removal of one item from the ten-item version slightly improved measurement precision and unidimensionality in this analysis. However, there may be cases in which leaving a slightly misfitting item in the set is not harmful to measurement and may be desirable. In future studies, investigators using the Perceived Stress Scale should consider the fit of each item and make decisions regarding item inclusion or exclusion based on the results of their own analyses, taking into account the various indicators of scale validity. These findings provide support for the Perceived Stress Scale’s potential usefulness for patients with AMD.
A psychometrically sound, easy to administer questionnaire such as the Perceived Stress Scale is important for use with patients with AMD, given the evidence for increased rates of psychological symptoms in the population. Scores on the Perceived Stress Scale have been shown to be related to increases in cortisol levels, susceptibility to infection, shortened telomeres, increased pro-inflammatory cytokines, slow wound healing, and other negative health outcomes.42–46 Additionally, there are a variety of stress reduction treatment protocols that have been shown effective in reducing stress and improving health outcomes.47–51 Though depression has been examined in people with AMD in several studies, there has been relatively little exploration of perceived stress. There have, however, been some studies that used scales with related content. One scale that measures some similar constructs and has been used in AMD is the Profile of Mood States (POMS).52 The POMS scale asks subjects to rate how they feel at the time of survey for a number of words that describe feelings, including “tense”, “angry”, and “confident”. The POMS has been used in studies of interventions for patients with AMD.53 It differs from the Perceived Stress Scale in several ways, including that it is meant to target seven different constructs while the Perceived Stress Scale is meant only to be a measure of perceived stress, it is considerably longer, and its response scale is different and covers a different time period (at the time of survey for the POMS versus in the last week for the Perceived Stress Scale). The POMS is a proprietary instrument, while the Perceived Stress Scale is available for use at no charge. The Impact of Vision Impairment instrument contains a socioemotional subscale with items dealing with worry about worsening eyesight and concern about coping with everyday life, but additionally others that target content similar to depression scales (sad or low, felt like a burden, lonely or isolated).
We found that the Perceived Stress Scale targeted people with somewhat higher perceived stress levels than those of study participants. Previous work54 on trends in Perceived Stress Scale scores by demographics provide some insight into why this might have occurred. First, it has been reported that Perceived Stress Scale scores generally decline with increasing age, and the mean age in our sample was 82 years. Stress levels have also been shown to be lower in Whites, who are at higher risk for AMD and comprised the vast majority of study subjects. Additionally, Perceived Stress Scale scores would be expected to decline with increasing levels of education, and this study sample likely had a higher average education level than the general population. Approximately 42% of the sample had at least a bachelor’s degree, compared with about 27% of people 65 years or older in the United States, as reported in the 2015 U.S. Population Survey.55 Further work should be done to determine how the targeting of the Perceived Stress Scale might be different in other samples of people with AMD.
An analysis of differential item functioning (DIF), or item bias, detected two Perceived Stress Scale items that had slightly more than desirable DIF by age, and two with slightly higher than desirable DIF by better-eye visual acuity. Younger participants found it easier to endorse the “I felt nervous or stressed” item and more difficult to endorse the “I felt on top of things” item than participants above the median age, while participants with visual acuity below the median level found it easier to endorse the “upset by things that normally do not upset me” item but also the “felt things were going my way” item. The presence of DIF can negatively affect measurement, and our findings indicate that it may be desirable to make accommodations in scoring procedures or discard the items in future studies using the Perceived Stress Scale.56
One other recently-published study by Nielsen et al. evaluated a Danish version Perceived Stress Scale using a different form of the Rasch model than the one used in this study.22 This study was performed with a population-based sample in Denmark, and it used the partial credit Rasch model, which allows for different category thresholds for each item. It found that there was evidence of multidimensionality related to differences between positively- and negatively- worded items, and that there were problems with overall model fit (as assessed with a global chi-squared test) as well as category structure for some items. Using the rating scale Rasch model,40 we found no disorder in the response category thresholds. We found that the eigenvalue of the first contrast of a principal component analysis of model residuals for the nine item set was 1.9, just below the 2.0 threshold which has been recommended as an indicator of acceptable unidimensionality. However, inspection of the factor loadings on this first contrast showed that the positively-worded items all loaded together, a finding that is generally consistent with Nielsen et al. and others9, 57 that there may be fundamental differences in responses to the positively- and negatively-worded items. In fact, Nielsen et al. suggested developing and testing a version of the Perceived Stress Scale in which all of the items are negatively-worded, which may be a strategy for dealing with this issue.
A limitation of the study is that some participants were administered the Perceived Stress Scale by study staff if they indicated they could not comfortably complete it alone secondary to difficulty reading the questions. Survey questions were printed one per page in 36 point font in order to avoid this problem as much as possible, but the nature of AMD’s effect on reading makes administering surveys in print difficult. It is possible that some of these participants answered some questions in a different way than they would have had they been able to complete the survey alone. Strengths of this study include that it is the first study of which we are aware that has assessed the Perceived Stress Scale, an instrument that is in very common use throughout many health-related fields and has been shown to be related to a number of important health outcomes, in people with age-related macular degeneration. The study is also only the second of which we are aware to analyze the Perceived Stress Scale using a Rasch analysis, the benefits of which have been demonstrated frequently.
Acknowledgments
Supported by National Eye Institute/National Institutes of Health, Department of Health and Human Services grant K23EY022940.
References
- 1.Brody BL, Gamst AC, Williams RA, et al. Depression, visual acuity, comorbidity, and disability associated with age-related macular degeneration. Ophthalmology. 2001;108:1893–900. doi: 10.1016/s0161-6420(01)00754-0. [DOI] [PubMed] [Google Scholar]
- 2.Casten R, Rovner B. Depression in age-related macular degeneration. J Vis Impair Blind. 2008;102:591–9. [PMC free article] [PubMed] [Google Scholar]
- 3.Casten R, Rovner BW, Leiby BE, et al. Depression despite anti-vascular endothelial growth factor treatment of age-related macular degeneration. Arch Ophthalmol. 2010;128:506–8. doi: 10.1001/archophthalmol.2010.24. [DOI] [PubMed] [Google Scholar]
- 4.Jivraj J, Jivraj I, Tennant M, et al. Prevalence and impact of depressive symptoms in patients with age-related macular degeneration. Can J Ophthalmol. 2013;48:269–73. doi: 10.1016/j.jcjo.2013.03.007. [DOI] [PubMed] [Google Scholar]
- 5.Mitchell J, Bradley C. Quality of life in age-related macular degeneration: a review of the literature. Health Qual Life Outcomes. 2006;4:97. doi: 10.1186/1477-7525-4-97. [DOI] [PMC free article] [PubMed] [Google Scholar]
- 6.Williams RA, Brody BL, Thomas RG, et al. The psychosocial impact of macular degeneration. Arch Ophthalmol. 1998;116:514–20. doi: 10.1001/archopht.116.4.514. [DOI] [PubMed] [Google Scholar]
- 7.Cohen S, Kamarck T, Mermelstein R. A global measure of perceived stress. J Health Soc Behav. 1983;24:385–96. [PubMed] [Google Scholar]
- 8.Cohen S, Williamson GM. Perceived stress in a probability sample of the United States. In: Spacapan S, Oskamp S, editors. The Social Psychology of Health. Newbury Park, CA: Sage Publications; 1988. pp. 31–67. [Google Scholar]
- 9.Andreou E, Alexopoulos EC, Lionis C, et al. Perceived Stress Scale: reliability and validity study in Greece. Int J Environ Res Public Health. 2011;8:3287–98. doi: 10.3390/ijerph8083287. [DOI] [PMC free article] [PubMed] [Google Scholar]
- 10.Eskildsen A, Dalgaard VL, Nielsen KJ, et al. Cross-cultural adaptation and validation of the Danish consensus version of the 10-item Perceived Stress Scale. Scand J Work Environ Health. 2015;41:486–90. doi: 10.5271/sjweh.3510. [DOI] [PubMed] [Google Scholar]
- 11.Leung DY, Lam TH, Chan SS. Three versions of Perceived Stress Scale: validation in a sample of Chinese cardiac patients who smoke. BMC Public Health. 2010;10:513. doi: 10.1186/1471-2458-10-513. [DOI] [PMC free article] [PubMed] [Google Scholar]
- 12.Mitchell AM, Crane PA, Kim Y. Perceived stress in survivors of suicide: psychometric properties of the Perceived Stress Scale. Res Nurs Health. 2008;31:576–85. doi: 10.1002/nur.20284. [DOI] [PubMed] [Google Scholar]
- 13.Denny F, Marshall AH, Stevenson MR, et al. Rasch analysis of the daily living tasks dependent on vision (DLTV) Invest Ophthalmol Vis Sci. 2007;48:1976–82. doi: 10.1167/iovs.06-0135. [DOI] [PubMed] [Google Scholar]
- 14.Dougherty BE, Bullimore MA. Comparison of scoring approaches for the NEI VFQ-25 in low vision. Optom Vis Sci. 2010;87:543–8. doi: 10.1097/OPX.0b013e3181e61bd8. [DOI] [PMC free article] [PubMed] [Google Scholar]
- 15.Gothwal VK, Wright TA, Lamoureux EL, et al. Rasch analysis of visual function and quality of life questionnaires. Optom Vis Sci. 2009;86:1160–8. doi: 10.1097/OPX.0b013e3181bab10c. [DOI] [PubMed] [Google Scholar]
- 16.Lamoureux EL, Pallant JF, Pesudovs K, et al. The Impact of Vision Impairment Questionnaire: an evaluation of its measurement properties using Rasch analysis. Invest Ophthalmol Vis Sci. 2006;47:4732–41. doi: 10.1167/iovs.06-0220. [DOI] [PubMed] [Google Scholar]
- 17.Marella M, Pesudovs K, Keeffe JE, et al. The psychometric validity of the NEI VFQ-25 for use in a low-vision population. Invest Ophthalmol Vis Sci. 2010;51:2878–84. doi: 10.1167/iovs.09-4494. [DOI] [PubMed] [Google Scholar]
- 18.Massof RW. An interval-scaled scoring algorithm for visual function questionnaires. Optom Vis Sci. 2007;84:689–704. doi: 10.1097/OPX.0b013e31812f5f35. [DOI] [PubMed] [Google Scholar]
- 19.Stelmack JA, Szlyk JP, Stelmack TR, et al. Psychometric properties of the Veterans Affairs Low-Vision Visual Functioning Questionnaire. Invest Ophthalmol Vis Sci. 2004;45:3919–28. doi: 10.1167/iovs.04-0208. [DOI] [PubMed] [Google Scholar]
- 20.Mallinson T. Why measurement matters for measuring patient vision outcomes. Optom Vis Sci. 2007;84:675–82. doi: 10.1097/OPX.0b013e3181339f44. [DOI] [PubMed] [Google Scholar]
- 21.Massof RW. The measurement of vision disability. Optom Vis Sci. 2002;79:516–52. doi: 10.1097/00006324-200208000-00015. [DOI] [PubMed] [Google Scholar]
- 22.Nielsen MG, Ornbol E, Vestergaard M, et al. The construct validity of the Perceived Stress Scale. J Psychosom Res. 2016;84:22–30. doi: 10.1016/j.jpsychores.2016.03.009. [DOI] [PubMed] [Google Scholar]
- 23.Cohen S, Janicki-Deverts D, Miller GE. Psychological stress and disease. JAMA. 2007;298:1685–7. doi: 10.1001/jama.298.14.1685. [DOI] [PubMed] [Google Scholar]
- 24.Hemingway H, Marmot M. Evidence based cardiology: psychosocial factors in the aetiology and prognosis of coronary heart disease. Systematic review of prospective cohort studies. BMJ. 1999;318:1460–7. doi: 10.1136/bmj.318.7196.1460. [DOI] [PMC free article] [PubMed] [Google Scholar]
- 25.Kuiper NA, Olinger LJ, Lyons LM. Global perceived stress level as a moderator of the relationship between negative life events and depression. J Human Stress. 1986;12:149–53. doi: 10.1080/0097840X.1986.9936781. [DOI] [PubMed] [Google Scholar]
- 26.Rod NH, Gronbaek M, Schnohr P, et al. Perceived stress as a risk factor for changes in health behaviour and cardiac risk profile: a longitudinal study. J Intern Med. 2009;266:467–75. doi: 10.1111/j.1365-2796.2009.02124.x. [DOI] [PubMed] [Google Scholar]
- 27.McDade TW, Hawkley LC, Cacioppo JT. Psychosocial and behavioral predictors of inflammation in middle-aged and older adults: the Chicago health, aging, and social relations study. Psychosom Med. 2006;68:376–81. doi: 10.1097/01.psy.0000221371.43607.64. [DOI] [PubMed] [Google Scholar]
- 28.Ferris FL, 3rd, Kassoff A, Bresnick GH, et al. New visual acuity charts for clinical research. Am J Ophthalmol. 1982;94:91–6. [PubMed] [Google Scholar]
- 29.Raasch TW, Bailey IL, Bullimore MA. Repeatability of visual acuity measurement. Optom Vis Sci. 1998;75:342–8. doi: 10.1097/00006324-199805000-00024. [DOI] [PubMed] [Google Scholar]
- 30.Arditi A, Cagenello R. On the statistical reliability of letter-chart visual acuity measurements. Invest Ophthalmol Vis Sci. 1993;34:120–9. [PubMed] [Google Scholar]
- 31.Vanden Bosch ME, Wall M. Visual acuity scored by the letter-by-letter or probit methods has lower retest variability than the line assignment method. Eye (Lond) 1997;11(Pt 3):411–7. doi: 10.1038/eye.1997.87. [DOI] [PubMed] [Google Scholar]
- 32.Pesudovs K, Burr JM, Harley C, et al. The development, assessment, and selection of questionnaires. Optom Vis Sci. 2007;84:663–74. doi: 10.1097/OPX.0b013e318141fe75. [DOI] [PubMed] [Google Scholar]
- 33.Bond TG, Fox CM. Applying the Rasch Model: Fundamental Measurement in the Human Sciences. 3rd. New York: Routledge; 2015. [Google Scholar]
- 34.Linacre J. A User’s Guide to Winsteps. Chicago: Winsteps; 2009. [Google Scholar]
- 35.Wright BD, Stone MH. Measurement Essentials. 2nd. Wilmington, DE: Wide Range, Inc; 1999. [Google Scholar]
- 36.Wright BD, Linacre JM. Reasonable Mean-square Fit Values. Rasch Measurement Transactions. 1994;8:370. Available at: http://www.rasch.org/rmt/rmt83b.htm. Accessed November 15, 2016. [Google Scholar]
- 37.Linacre JM. Structure in Rasch Residuals: Why Principal Components Analysis (PCA)? Rasch Measurement Transactions. 1998;12:636. Available at: http://www.rasch.org/rmt/rmt122m.htm. Accessed November 15, 2016. [Google Scholar]
- 38.Bond TG, Fox CM. Fundamental Measurements in the Human Sciences. 2nd. Mahwah, NJ: Lawrence Erlbaum Associates Publishers; 2007. Applying the Rasch Model. [Google Scholar]
- 39.Rasch G. Probabilistic Models for some Intelligence and Achievement Tests. Copenhagen: Danish Institute for Educational Research; 1960. [Google Scholar]
- 40.Andrich D. A rating formulation for ordered response categories. Psychometrika. 1978;43:561–73. [Google Scholar]
- 41.Linacre J. WINSTEPS Rasch Measurement Computer Program. Chicago: Winsteps.com; 2005. [Google Scholar]
- 42.Cohen S, Doyle WJ, Skoner DP. Psychological stress, cytokine production, and severity of upper respiratory illness. Psychosom Med. 1999;61:175–80. doi: 10.1097/00006842-199903000-00009. [DOI] [PubMed] [Google Scholar]
- 43.Cohen S, Tyrrell DA, Smith AP. Negative life events, perceived stress, negative affect, and susceptibility to the common cold. J Pers Soc Psychol. 1993;64:131–40. doi: 10.1037//0022-3514.64.1.131. [DOI] [PubMed] [Google Scholar]
- 44.Ebrecht M, Hextall J, Kirtley LG, et al. Perceived stress and cortisol levels predict speed of wound healing in healthy male adults. Psychoneuroendocrinology. 2004;29:798–809. doi: 10.1016/S0306-4530(03)00144-6. [DOI] [PubMed] [Google Scholar]
- 45.Epel ES, Blackburn EH, Lin J, et al. Accelerated telomere shortening in response to life stress. Proc Natl Acad Sci U S A. 2004;101:17312–5. doi: 10.1073/pnas.0407162101. [DOI] [PMC free article] [PubMed] [Google Scholar]
- 46.Kiecolt-Glaser JK, Marucha PT, et al. Slowing of wound healing by psychological stress. Lancet. 1995;346:1194–6. doi: 10.1016/s0140-6736(95)92899-5. [DOI] [PubMed] [Google Scholar]
- 47.Duncan LG, Moskowitz JT, Neilands TB, et al. Mindfulness-based stress reduction for HIV treatment side effects: a randomized, wait-list controlled trial. J Pain Symptom Manage. 2012;43:161–71. doi: 10.1016/j.jpainsymman.2011.04.007. [DOI] [PMC free article] [PubMed] [Google Scholar]
- 48.Parswani MJ, Sharma MP, Iyengar S. Mindfulness-based stress reduction program in coronary heart disease: A randomized control trial. Int J Yoga. 2013;6:111–7. doi: 10.4103/0973-6131.113405. [DOI] [PMC free article] [PubMed] [Google Scholar]
- 49.Pbert L, Madison JM, Druker S, et al. Effect of mindfulness training on asthma quality of life and lung function: a randomised controlled trial. Thorax. 2012;67:769–76. doi: 10.1136/thoraxjnl-2011-200253. [DOI] [PMC free article] [PubMed] [Google Scholar]
- 50.Sallon S, Katz-Eisner D, Yaffe H, et al. Caring for the Caregivers: Results of an Extended, Five-component Stress-reduction Intervention for Hospital Staff. Behav Med. 2015:1–15. doi: 10.1080/08964289.2015.1053426. [DOI] [PubMed] [Google Scholar]
- 51.Sgalla G, Cerri S, Ferrari R, Ricchieri MP, Poletti S, Ori M, Garuti M, Montanari G, Luppi F, Petropulacos K, Richeldi L. Mindfulness-based stress reduction in patients with interstitial lung diseases: a pilot, single-centre observational study on safety and efficacy. BMJ Open Respir Res. 2015;2:e000065. doi: 10.1136/bmjresp-2014-000065. [DOI] [PMC free article] [PubMed] [Google Scholar]
- 52.McNair DM, Lorr M, Droppleman LF. POMS: Profile of Mood States. San Diego, CA: EITS/Educational and Industrial Testing Service; 1992. [Google Scholar]
- 53.Brody BL, Williams RA, Thomas RG, et al. Age-related macular degeneration: a randomized clinical trial of a self-management intervention. Ann Behav Med. 1999;21:322–9. doi: 10.1007/BF02895965. [DOI] [PubMed] [Google Scholar]
- 54.Cohen S, Janicki-Deverts D. Who’s stressed? Distributions of psychological stress in the United States in probability samples from 1983, 2006, and 2009. J Appl Soc Psychol. 2012;42:1320–34. [Google Scholar]
- 55.Ryan CL, Bauman K. Population Characteristics. United States Census Bureau; Mar, 2016. Educational Attainment in the United States: 2015. (Current Population Reports). Available at: http://www.census.gov/content/dam/Census/library/publications/2016/demo/p20-578.pdf. Accessed November 15, 2016. [Google Scholar]
- 56.Boone WJ, Staver JR, Yale MS. Rasch Analysis in the Human Sciences. Dordrecht: Springer; 2014. [Google Scholar]
- 57.Golden-Kreutz DM, Browne MW, Frierson GM, et al. Assessing stress in cancer patients: a second-order factor analysis model for the Perceived Stress Scale. Assessment. 2004;11:216–23. doi: 10.1177/1073191104267398. [DOI] [PMC free article] [PubMed] [Google Scholar]