Abstract
Ferric pyrophosphate citrate (Triferic) is a water‐soluble iron salt that is administered via dialysate to maintain iron balance and hemoglobin in hemodialysis patients. This double‐blind, randomized, placebo‐controlled, single‐, ascending‐dose study was conducted to evaluate the pharmacokinetics and safety of intravenous ferric pyrophosphate citrate in 48 healthy iron‐replete subjects (drug, n = 36; placebo, n = 12). Single doses of 2.5, 5.0, 7.5, or 10 mg of ferric pyrophosphate citrate or placebo were administered over 4 hours, and single doses of 15 or 20 mg of ferric pyrophosphate citrate or placebo were administered over 12 hours via intravenous infusion. Serum total iron (sFetot), transferrin‐bound iron (TBI), hepcidin‐25, and biomarkers of oxidative stress and inflammation were determined using validated assays. Marked diurnal variation in sFetot was observed in placebo‐treated subjects. Concentrations of sFetot and TBI increased rapidly after drug administration, with maximum serum concentrations (Cmax) reached at the end of infusion. Increases in baseline‐corrected Cmax and area under the concentration‐time curve from 0 to the time of the last quantifiable concentration (AUC0‐t) were dose proportional up to 100% transferrin saturation. Iron was rapidly cleared (apparent terminal phase half‐life 1.2‐2 hours). No significant changes from baseline in serum hepcidin‐25 concentration were observed at end of infusion for any dose. Biomarkers of oxidative stress and inflammation were unaffected. Intravenous doses of ferric pyrophosphate citrate were well tolerated. These results demonstrate that intravenous ferric pyrophosphate citrate is rapidly bound to transferrin and cleared from the circulation without increasing serum hepcidin levels or biomarkers of oxidative stress or inflammation.
Keywords: ferric pyrophosphate citrate, intravenous, iron, hepcidin, pharmacokinetics
Iron deficiency is a common cause of anemia in patients with stage 5 hemodialysis‐dependent chronic kidney disease (CKD‐5HD). Erythropoiesis‐stimulating agents and iron are essential components for the management of anemia in these patients. Erythropoiesis‐stimulating agents increase the numbers of erythroblasts, whereas iron is needed in the final synthesis of hemoglobin to produce fully functional red blood cells (RBCs).
All currently available intravenous iron products are iron‐carbohydrate complexes. The iron is bound to the carbohydrate shell and requires metabolism in the reticuloendothelial system (RES) via the RBC salvage pathway to export ferrous iron that, after oxidation to ferric iron, is bound to circulating transferrin.1 The concurrent systemic inflammation in patients with CKD‐5HD results in elevation of hepcidin, which blocks absorption of iron across the enterocyte and impairs release of iron from the RES.2 This results in ineffective utilization of intravenous iron and has contributed to the rise in ferritin levels that has been observed over the last 10 to 15 years with the increased use of intravenous iron as “maintenance” therapy for patients with CKD‐5HD.3, 4, 5, 6 The safety profile of intravenous iron preparations is generally favorable, but to date, long‐term studies are lacking. However, inflammation, tissue injury, anaphylaxis, endothelial dysfunction, and oxidative stress have been described with the use of intravenous iron.6, 7
Ferric pyrophosphate citrate (Triferic) is a novel complex iron salt that is water soluble and contains no carbohydrate shell. Ferric pyrophosphate citrate is approved in the United States as an iron‐replacement treatment to maintain hemoglobin concentrations in patients with CKD‐5HD. Ferric pyrophosphate citrate is added to the bicarbonate concentrate at each hemodialysis session. The bicarbonate concentrate with ferric pyrophosphate citrate iron subsequently mixes with acid concentrate and water in the hemodialysis machine to generate dialysate containing 2 μM (110 μg/L) of iron(III). Ferric pyrophosphate citrate crosses the dialyzer membrane, enters the blood, donates its iron directly to transferrin, and is rapidly cleared from the circulation.8 This provides for iron utilization for erythropoiesis and avoids hepcidin‐induced iron sequestration within reticuloendothelial macrophages.9, 10
Patients who use hemodialysis systems that do not use liquid bicarbonate concentrate cannot receive ferric pyrophosphate citrate iron via the hemodialysate. The availability of ferric pyrophosphate citrate iron for administration by a route other than the hemodialysate can provide a suitable therapeutic option to the currently available intravenous iron preparations for these patients. Furthermore, patients who have anemia of inflammation and functional iron deficiency with high serum hepcidin concentrations are potential candidates for a parenteral iron product that can bypass reticuloendothelial processing.
Ferric pyrophosphate citrate is a form of protected iron in which citrate and pyrophosphate are tightly complexed to the iron. Ferric pyrophosphate citrate is highly soluble in aqueous solutions and, therefore, can be easily formulated for intravenous administration. This formulation would allow patients with CKD‐5HD who are using solid bicarbonate cartridges for bicarbonate generation to receive ferric pyrophosphate citrate iron concurrently with hemodialysis. Because of its unique chemical properties, ferric pyrophosphate citrate may also be a suitable addition to total parenteral nutrition solutions containing amino acids and lipids.
We conducted the current study to investigate the pharmacokinetics of intravenously administered ferric pyrophosphate citrate iron in healthy iron‐replete subjects. The effects of intravenously administered ferric pyrophosphate citrate iron on serum concentrations of soluble transferrin receptor (sTfR), hepcidin‐25, and biomarkers of oxidative stress and inflammation were also examined.
Methods
The study was conducted in accordance with the Declaration of Helsinki and Good Clinical Practices guidelines. The study protocol and written informed consent statement were approved by an institutional review board (IntegReview IRB, Austin, Texas) before subjects were enrolled into the trial. Written informed consent was obtained from all subjects before any study‐related procedures were performed. The study was registered at www.clinicaltrials.gov as NCT01920854.
Subjects
Healthy male and female subjects aged 18 to 55 years with a body mass index between 20.0 and 32.0 kg/m² and no clinically relevant abnormalities based on medical history, physical examination, vital sign measurements, electrocardiograms (ECGs), or safety laboratory tests were enrolled in the study. Female subjects were not pregnant or breastfeeding and were at least 9 months postpartum. Subjects agreed not to use iron preparations during the 14 days before administration of the test material and to use acceptable birth control measures for the duration of the study.
Subjects were excluded if they had a hemoglobin concentration of less than 11 g/dL, a hematocrit of less than 30%, or a serum iron concentration of less than 70 μg/dL (male or female) at screening; had taken prescription medications (except hormonal replacement, hormonal oral contraceptives, acetaminophen, or anti‐inflammatory drugs) within 14 days before administration of the test material; currently used tobacco or other nicotine‐containing products; or had a history of alcohol or other substance abuse within the past year or evidence of ethanol or drugs of abuse on baseline toxicology screens. Subjects with a known or suspected hypersensitivity to iron were also excluded.
Study Design and Drug Administration
This was a single‐center, double‐blind, randomized, placebo‐controlled, single‐ascending‐dose study to evaluate the pharmacokinetics, serum iron profile, and tolerability of single intravenous doses of ferric pyrophosphate citrate iron in healthy subjects. Cohorts of 8 subjects each (6 randomized to drug and 2 randomized to placebo) were consecutively enrolled in the study and administered single doses of 2.5, 5.0, 7.5, or 10 mg of ferric pyrophosphate citrate iron or placebo via intravenous infusion over 4 hours or single doses of 15 or 20 mg of ferric pyrophosphate citrate iron or placebo via intravenous infusion over 12 hours. The 4‐hour infusion time was chosen to mimic the usual time on dialysis, and the 12‐hour infusion time was chosen to approximate the duration of infusion of total parenteral nutrition solutions. The maximal dose of ferric pyrophosphate citrate iron that can be administered by intravenous infusion without exceeding the total iron‐binding capacity (TIBC) of serum was also determined in this study.
Ferric pyrophosphate citrate was supplied by Rockwell Medical, Inc (Wixom, Michigan) as a liquid concentrate formulation of 27.2 mg of ferric pyrophosphate citrate iron per vial (5.44 mg iron/mL). An appropriate volume of the stock solution for the required dose of iron was diluted in 500 or 1000 mL of 5% dextrose in water (D5W). The appropriate dose of ferric pyrophosphate citrate or placebo (D5W at a volume that corresponded to the volume of the ferric pyrophosphate citrate iron dose) was infused into a forearm by infusion pump at a rate of 62.5 mL/hour. Test materials were administered after a 12‐hour fast, beginning at 8 am.
Subjects were confined to the clinic from the evening before until the morning after administration of the test material and were given meatless meals during this period. A follow‐up safety visit was conducted 1 week after discharge from the clinic. Safety data (including a serum iron profile and C‐reactive protein [included to evaluate the potential for oxidative stress]) for a completed cohort, through the 1‐week follow‐up safety visit, were reviewed before the dose of drug was escalated to the next higher dose in the dose‐escalation scheme.
Study Assessments
Blood samples for pharmacokinetic assessments of serum total iron (sFetot), transferrin‐bound iron (TBI), and TIBC were obtained at –12 and –6 hours before the start of the 4‐ or 12‐hour intravenous infusion (baseline measurements) and then immediately before (0 hour) and at 0.5, 1, 2, 3, 4, 4.5, 5, 6, 7.5, 8, 9, 10, 12, 12.5, 14, 16, 20, 24, 36, and 48 hours after the start of the 4‐hour intravenous infusion or immediately before and at 0.5, 1, 2, 4, 4, 6, 9, 12, 12.5, 14, 16, 18, 20, 24, 30, 36, and 48 hours after the start of the 12‐hour intravenous infusion. Additional blood samples were obtained immediately before and immediately after the end of the 4‐ or 12‐hour infusion for measurement of concentrations of serum hepcidin‐25, serum sTfR, and serum biomarkers of oxidative stress (isofuran, F2‐isoprostanes, and malondialdehyde [MDA]) and inflammation (interleukin‐6 [IL‐6]).
Safety was monitored through a review of the nature, frequency, and severity of adverse events, safety laboratory tests, vital signs, ECGs, and physical examinations.
Bioanalytical Methods
Serum total iron and TBI were measured using an assay that was specifically validated with ferric pyrophosphate citrate iron to measure concentrations of total iron and TBI. Briefly, total serum iron was determined after liberation of bound iron and reduction with dithionite via reaction with Ferene. TBI was measured after dilution of the sample and addition of 4 mM nitriloacetic acid (NTA) to capture nonspecifically bound iron, among which is iron bound to albumin and citrate.11 The diluted serum was passed through a polyimine solid‐phase extraction (SPE) column to remove the NTA‐iron complexes.12 The iron content of the eluate from the SPE column was assayed for iron via the Ferene reaction after reduction with dithionite. Total protein content pre‐ and postcolumn was used to correct for concentration effects.12 The assay performance was linear across a range of 20 to 3500 μg/dL. TBI accuracy and precision were determined across serum samples that were fortified with diferric transferrin and added to the matrix. Assay performance was accurate to within ±15% of the characterized target, and the coefficient of variation of all replicates was ≤15%.
Concentrations of serum sTfR were measured using quantitative immunoturbidimetry (ARUP Laboratories, Salt Lake City, Utah). Serum hepcidin‐25 measurements were performed by a combination of weak cation exchange chromatography and time‐of‐flight mass spectrometry (WCX‐TOF MS).13 An internal standard (synthetic heavy hepcidin‐25 stable isotope +40; custom made by Peptide International Inc, Louisville, Kentucky) was used for quantification.14 The lower limit of detection of this method was 0.5 nM (reference range of serum hepcidin‐25 in Dutch population, <0.5‐14.7 nM for men, <0.5‐12.3 nM for premenopausal women, www.hepcidinanalysis.com). The reference levels for the WCX‐TOF MS method were derived from an enzyme‐linked immunosorbent assay (ELISA) method15 based on the regression line between the ELISA and WCX‐TOF MS results that were obtained for the same samples from patients without hepcidin isoforms.13
Levels of free F2‐isoprostanes in serum were measured by gas chromatography and mass spectroscopy.16 Serum concentrations of IL‐6 were determined by enzyme‐linked immunosorbent assay (Quantikine Human IL‐6 ELISA Kit, R & D Systems, Inc, Minneapolis, Minnesota).
Serum TIBC and serum ferritin concentrations were measured using standard automated clinical chemistry methods.
Pharmacokinetic and Safety Analyses
Concentrations of sFetot and TBI and pharmacokinetic parameters for sFetot were summarized using baseline‐corrected values (mean of the values obtained at –12, –6, and 0 hours) to account for variability among subjects in serum iron concentrations before administration of the test material. Standard noncompartmental pharmacokinetic analyses in Phoenix WinNonlin (version 6.3, Pharsight Corp, Mountain View, California) were used to calculate the pharmacokinetic parameters of sFetot. Non‐transferrin‐bound iron (NTBI) was calculated as the difference between sFetot and TBI. Transferrin saturation (TSAT) was calculated as TBI divided by TIBC times 100.
Pharmacokinetic parameters and continuous safety parameters were summarized with descriptive statistics. Categorical safety parameters were summarized with counts and percentages.
Results
Demographics
A total of 48 subjects (25 male and 23 female) were enrolled in the trial and randomized to receive single intravenous doses of ferric pyrophosphate citrate iron (n = 36) or placebo (n = 12). The subjects were primarily white (81%) and ranged in age from 19 to 55 years (mean 30 years). No relevant differences in demographic characteristics, including the baseline serum iron parameters (sFetot, TIBC, TSAT, or ferritin), were observed among the individual cohorts or between the combined ferric pyrophosphate citrate iron and combined placebo treatment groups overall.
Pharmacokinetics
The placebo treatment groups demonstrated marked diurnal variation in sFetot and TBI (Figure 1A‐D), with peak concentrations observed between 4 and 5 hours after the start of infusion. Infusion of ascending doses of ferric pyrophosphate citrate iron over 4 or 12 hours showed a progressive dose‐proportional increase in baseline‐corrected sFetot and TBI concentrations, with maximum serum concentrations (Cmax) observed at the end of the 4‐ or 12‐hour infusion (Figure 1A‐D). Changes in absolute TSAT followed the changes in sFetot and TBI concentrations (Figure 2).
Figure 1.
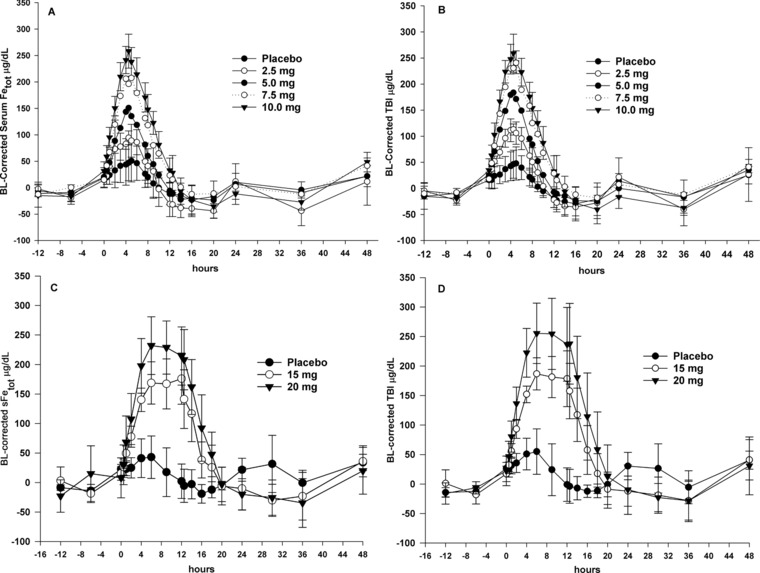
Concentration‐time plots for serum total iron (sFetot) and transferrin‐bound iron (TBI). (A and B) Mean baseline (BL)‐corrected sFetot and TBI concentration‐time plots for 4‐hour intravenous infusions of ferric pyrophosphate citrate iron (time 0‐4 hours). (C and D) Mean BL‐corrected sFetot and TBI concentration‐time plots for 12‐hour intravenous infusions of ferric pyrophosphate citrate iron (time 0‐12 hours). SD error bars are for placebo and highest dose only; error bars are similar for all doses.
Figure 2.
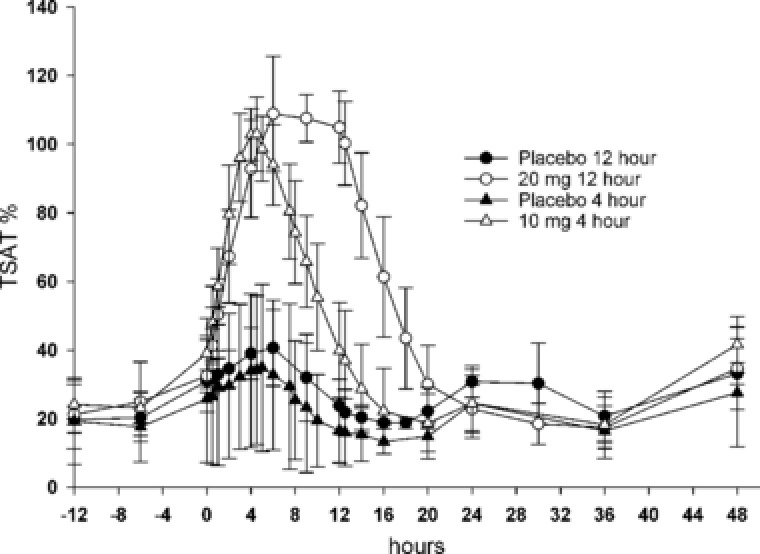
Absolute transferrin saturation (TSAT) over time for placebo, 10 mg of ferric pyrophosphate citrate iron administered as a 4‐hour intravenous infusion, and 20 mg of ferric pyrophosphate citrate iron administered as a 12‐hour intravenous infusion.
Iron was rapidly cleared after intravenous administration, with a mean apparent terminal‐phase half‐life (t½app) of 1.2 hours for the 4‐hour and 2.0 hours for the 12‐hour intravenous infusion (Table 1). The values for sFetot were dose proportional for Cmax and area under the serum concentration‐time curve from 0 to the time of the last quantifiable concentration (AUC0‐t) (Figure 3A,B).
Table 1.
Baseline‐Corrected Pharmacokinetic Parameters for sFetot in Healthy Volunteers After Intravenous Administration of Ferric Pyrophosphate Citrate Iron
| FPC Iron Dose (mg) 4‐Hour Intravenous Infusion | FPC Iron Dose (mg) 12‐Hour Intravenous Infusion | |||||||
|---|---|---|---|---|---|---|---|---|
| Pharmacokinetic Parametera | 0 | 2.5 | 5.0 | 7.5 | 10.0 | 0 | 15.0 | 20.0 |
| Cmax, μg/dL | 62.6 (32.4) | 113 (44.5) | 151 (33.9) | 228 (19.7) | 261 (30.3) | 44.3 (34.8) | 177 (38.2) | 251 (51.7) |
| λz, 1/h | – | 0.5 (0.1) | 0.7 (0.3) | 0.7 (0.4) | 0.9 (0.7) | – | 0.5 (0.3) | 0.3 (0.1) |
| t½app, hours | – | 1.3 (0.2) | 1.2 (0.5) | 1.3 (0.7) | 1.0 (0.5) | – | 1.9 (1.1) | 2.2 (0.6) |
| CL, dL/h | – | 4.1 (1.2) | 5.1 (1.0) | 4.6 (0.5) | 5.6 (0.9) | – | 6.7 (1.6) | 6.6 (1.5) |
| tmax, hoursb | – | 4.9 | 4.3 | 4.8 | 4.3 | – | 8.5 | 7.8 |
| AUC0‐t, μg · hr/dL | – | 675 (270) | 1010 (190) | 1650 (172) | 1840 (263) | – | 2340 (565) | 3150 (657) |
AUC0‐t, area under the serum concentration‐time curve from 0 to the time of the last quantifiable concentration; CL, total drug clearance; Cmax, maximum serum concentration; FPC, ferric pyrophosphate citrate; λz, terminal rate constant; sFetot, serum total iron; t½app, apparent terminal‐phase half‐life; tmax, time to maximum serum concentration.
Values are expressed as mean (SD) unless otherwise indicated.
Median value.
Figure 3.
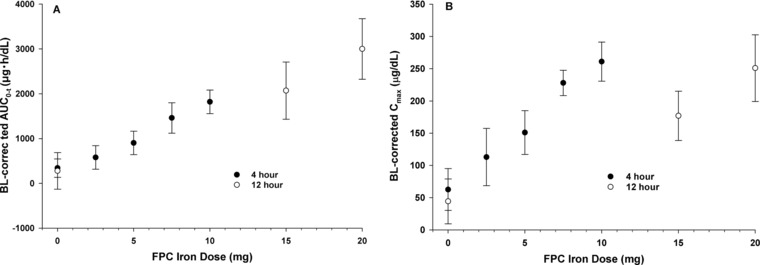
Mean (SD) baseline‐corrected exposure parameters for serum total iron (sFetot) by ferric pyrophosphate citrate (FPC) iron dose. (A) Area under the concentration‐time curve from 0 to the time of the last quantifiable concentration (AUC0‐t). (B) Maximum serum concentration (Cmax).
The concentration‐time course of sFetot, TBI, and NTBI after administration of the 10‐mg dose as a 4‐hour intravenous infusion is shown in Figure 4. Concentrations of NTBI did not increase with increasing dose (data not shown). An in vitro study of ferric pyrophosphate citrate iron added to plasma‐like medium showed that ferric pyrophosphate citrate iron can generate labile plasma iron (LPI) in the presence of ascorbate (Supplemental Figure S1). This ability was markedly decreased in an ex vivo study when ferric pyrophosphate citrate iron was added to human plasma. Significant amounts of LPI (Supplemental Figure S2) and NTBI (Supplemental Figure S3) were observed only when the iron concentration exceeded 100% TSAT.
Figure 4.
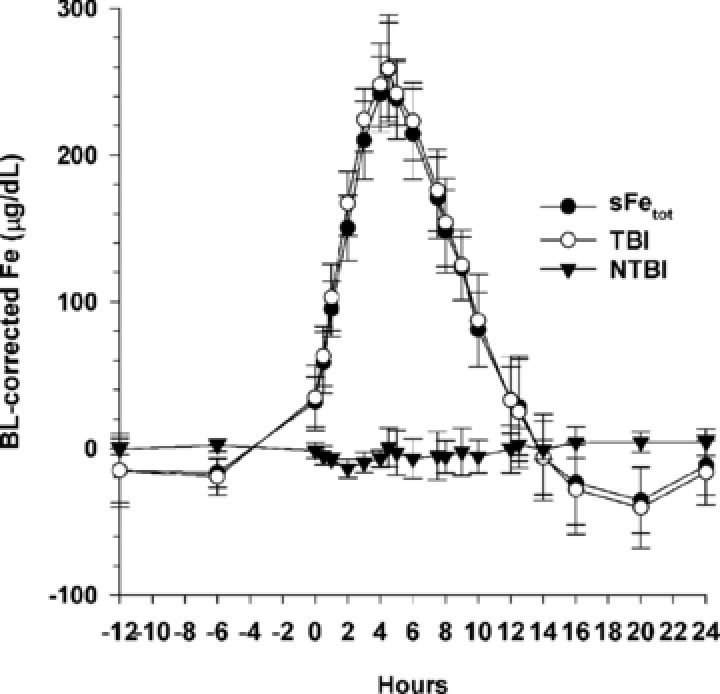
Mean (SD) baseline (BL)‐corrected serum total iron (sFetot), transferrin‐bound iron (TBI), and calculated non–transferrin‐bound iron (NTBI) concentrations after administration of 10 mg of ferric pyrophosphate citrate iron as a 4‐hour intravenous infusion.
Hepcidin‐25, sTfR, and Oxidative Stress and Inflammatory Biomarkers
Serum hepcidin‐25 concentrations were within published reference ranges for men and premenopausal women for the assay used at baseline and at the end of each of the 4‐ and 12‐hour infusions. No change from baseline in serum hepcidin‐25 concentration was observed at the end of 4‐hour infusions of 2.5, 5, 7.5, or 10 mg of ferric pyrophosphate citrate iron (Figure 5). A 3.2‐ to 7.4‐fold increase in serum hepcidin‐25 concentration was observed at the end of the 12‐hour infusions of 15 and 20 mg of ferric pyrophosphate citrate iron, but values remained within normal ranges for men and premenopausal women (Figure 5). Serum hepcidin‐25 concentrations returned to baseline for all doses by 24 hours after the start of infusion.
Figure 5.
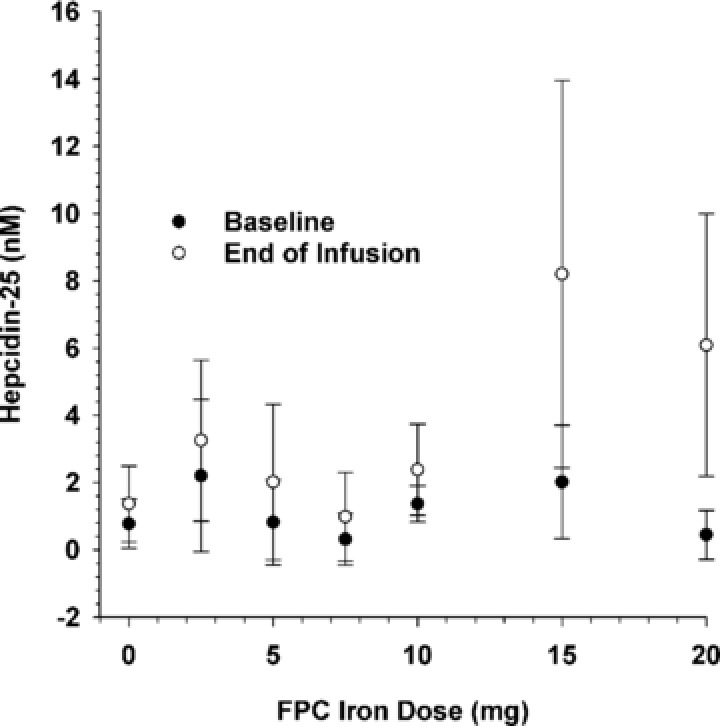
Mean (SD) serum hepcidin‐25 concentrations at baseline and at the end of infusion as a function of ferric pyrophosphate citrate (FPC) iron dose.
The change from baseline in serum sTfR concentration, expressed as the fold change in concentration at the end of infusion vs baseline, declined as the TSAT at the end of infusion increased (Figure 6). A similar trend was observed for the sTfR vs log ferritin index (data not shown). The largest declines in serum sTfR concentration were observed after 12‐hour infusion of the 15‐ and 20‐mg doses. Values for serum sTfR had returned to preinfusion values for each of the doses by 24 hours after the start of infusion.
Figure 6.
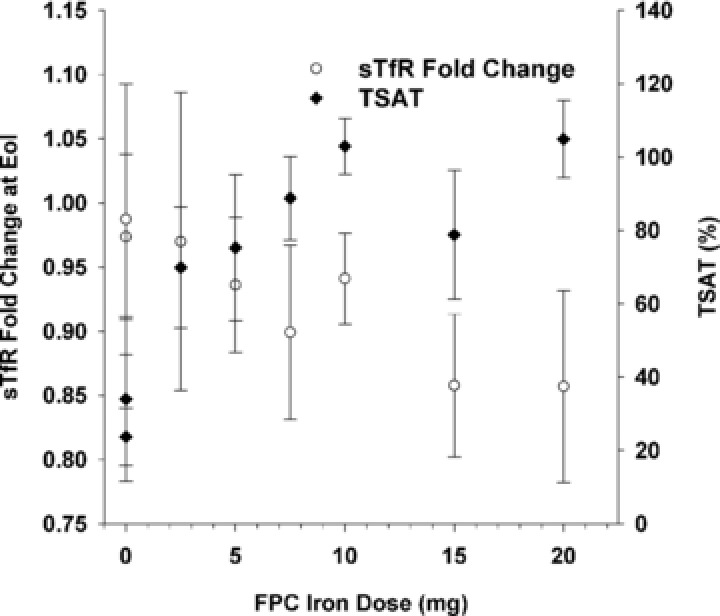
Mean (SD) fold change from baseline in serum soluble transferrin receptor (sTfR) and transferrin saturation (TSAT) at end of infusion as a function of ferric pyrophosphate citrate (FPC) iron dose.
Values for the biomarkers of oxidative stress (serum isofuran, F2‐isoprostanes, and MDA) and inflammation (serum IL‐6) were unchanged from baseline at the end of infusion (Figure 7). A statistically significant difference was observed between ferric pyrophosphate citrate and placebo in the mean change from baseline in serum isofuran concentration at the end of the 12‐hour infusion (P ≤ .05, Wilcoxon test); however, serum F2‐isoprostanes did not show a similar change.
Figure 7.

Change from baseline (CFB) in serum biomarkers of oxidative stress (isofuran, F2‐isoprostanes, and malondialdehyde [MDA]) and inflammation (interleukin‐6 [IL‐6]) at end of infusion for ferric pyrophosphate citrate (FPC) iron and placebo.
Safety
Intravenous doses of ferric pyrophosphate citrate were well tolerated. At least 1 adverse event was reported in 9 of the 36 subjects (25.0%) who received ferric pyrophosphate citrate and in 3 of the 12 subjects (25.0%) who received placebo. Headache (7 of 36, 19.4%) and dizziness (2 of 36, 5.6%) were the most commonly reported adverse events in the ferric pyrophosphate citrate–treated subjects. No relationship was observed between the incidence of these events and the dose of ferric pyrophosphate citrate iron or the duration of the intravenous infusion. None of the reported adverse events were severe or considered to be related to ferric pyrophosphate citrate. No clinically relevant abnormalities were observed in laboratory test results, vital signs, ECGs, or physical examinations.
Discussion
This study was conducted in healthy male and female volunteers to examine the pharmacokinetics of intravenously administered ferric pyrophosphate citrate iron. Ferric pyrophosphate citrate iron differs from the currently available forms of intravenous in several key features. Intravenous iron preparations are large macromolecular carbohydrate iron complexes designed to utilize the RBC salvage pathway to metabolize and release iron to transferrin.17 Intravenous injection of nanoparticulate iron can also lead to the appearance of NTBI,18 which may be taken up in an unregulated manner by cells of the endocrine, cardiac, and hepatic systems.19 A portion of circulating NTBI is readily available to participate in redox cycling and is referred to as catalytic iron or LPI, which contributes to redox activity and the production of free radicals and oxidative stress.20, 21 The pharmacokinetics of the currently approved intravenous iron products also demonstrate a heterogeneity in clearance from the circulation, with a t½app of 1.4 hours for sodium ferric gluconate, 5.3 hours for iron sucrose, 7.4 to 9.4 hours for ferric carboxymaltose, and 14.7 hours for ferumoxytol.22
Ferric pyrophosphate citrate iron is administered in small quantities at each hemodialysis session to replace the ongoing iron losses in patients with CKD‐5HD.23 The pharmacokinetics of ferric pyrophosphate citrate iron are distinctly different from intravenous iron preparations in that all administered iron is bound to transferrin, with a rapid clearance similar to that of intravenously administered diferric transferrin (t½app 80‐120 minutes).24 All of the administered ferric pyrophosphate citrate iron is donated to transferrin as indicated by the high concordance of total serum iron to TBI. Negligible NTBI is found at TSAT up to 100% after administration of ferric pyrophosphate citrate iron. The 4‐hour infusion of ferric pyrophosphate citrate resulted in hepcidin‐25 concentrations that were not different from those with placebo. The 12‐hour infusion resulted in a small increase in hepcidin‐25 concentration because the higher quantity of iron that was administered induced hepcidin.25 The time course of serum hepcidin in response to oral iron peaks between 8 and 12 hours, so measurement of hepcidin at 4 hours may have missed a small increment in hepcidin, whereas the 12‐hour infusion captured the iron‐induced increase in hepcidin.25
The results of this study of intravenously administered ferric pyrophosphate citrate iron demonstrate dose‐proportional pharmacokinetics up to a TSAT of 100%. Importantly, the results show that all of the delivered iron was complexed with transferrin and rapidly cleared from the circulation, with a median t½app of 1.2 to 2.0 hours.
No induction of biomarkers of oxidative stress or inflammation was observed after administration of intravenous doses of ferric pyrophosphate citrate iron over the range of 5 to 20 mg, with the exception of a slight increase in serum isofuran concentrations, which was considered to be random because no concurrent change was observed in serum F2‐isoprostane or MDA concentrations. In contrast, intravenous administration of iron sucrose and iron sucrose plus vitamin C has been shown to increase levels of serum F2‐isoprostanes and inflammatory cytokines in healthy volunteers and in hemodialysis patients.26 A meta‐analysis of 34 studies that examined the impact of intravenous iron in hemodialysis patients concluded that intravenous iron supplementation improved hemoglobin concentration but was associated with effects on oxidative stress biomarkers of uncertain clinical significance.27 The results of this study of intravenously administered ferric pyrophosphate citrate iron in healthy volunteers confirm the results of previous clinical studies of ferric pyrophosphate citrate in patients with CKD‐5HD, which have shown no changes in biomarkers of oxidative stress or inflammation over a 9‐month period.28
Intravenous doses of 2.5, 5.0, 7.5, and 10 mg of ferric pyrophosphate citrate iron were well tolerated when administered over 4 hours and intravenous doses of 15 and 20 mg of ferric pyrophosphate citrate iron were well tolerated when administered over 12 hours, with no significant safety findings observed at any dose.
In conclusion, the results of this study show dose‐proportional pharmacokinetics after intravenous administration of ferric pyrophosphate citrate iron up to a TSAT of 100%, with all iron donated directly to transferrin. Apparent serum clearance of iron was rapid, consistent with the clearance of diferric transferrin. A maximum dose of 10 mg of ferric pyrophosphate citrate iron can be administered intravenously over 4 hours (typical duration of hemodialysis), and up to 20 mg of ferric pyrophosphate citrate iron can be administered intravenously over 12 hours. The pharmacokinetic and safety profiles indicate that ferric pyrophosphate citrate iron may be a suitable for maintenance iron therapy in patients with CKD‐5HD. The safety of 15 to 20 mg of intravenous ferric pyrophosphate citrate iron over 12 hours in this normal volunteer study suggests that intravenous infusion of ferric pyrophosphate citrate iron also merits investigation for the treatment of functional iron deficiency in nondialysis patients with anemia of inflammation secondary to high serum hepcidin concentrations and in patients who receive total parenteral nutrition.
Supporting information
Additional supporting information may be found in the online version of this article at the publisher's web‐site.
Figures. S1–S3
Acknowledgments
The authors thank the subjects who participated in the study, the investigator and study site staff, and the clinical monitors and data managers who verified the study data. Measurements of serum hepcidin‐25 were performed by Coby Laarakkers and Erwin Wiegerinck (hepcidinanalysis.com, Nijmegen, The Netherlands). Erwin Wiegerinck performed the ex vivo analysis of NTBI and LPI. The pharmacokinetic data were analyzed by Mark A. Bush, PhD (Nuventra, Inc, Research Triangle Park, North Carolina), and the safety data were analyzed by Kimberly T. Perry, PhD (Innovative Analytics, Inc, Kalamazoo, Michigan).
Disclosures
This study was funded by Rockwell Medical, Inc (Wixom, Michigan). R.D.P. and A.G. are employees of Rockwell Medical, the sponsor of the study, and hold stock in and serve on the scientific advisory board for Rockwell Medical. A.G. also holds the rights to the patent on parenteral delivery of ferric pyrophosphate citrate iron, including dialysis solutions. D.W.S. is an employee of Radboudumc, which, via the hepcidinanalysis.com initiative, offers hepcidin‐25 measurements on a fee‐for‐service basis. T.A.I. received grant funding from Rockwell Medical for measurement of oxidative stress and inflammatory biomarkers. Writing and editorial support was provided by Lillian L. Neff (Innovative Analytics, Inc, Kalamazoo, Michigan).
References
- 1. Ganz T. Systemic iron homeostasis. Physiol Rev. 2013;93(4):1721–1741. [DOI] [PubMed] [Google Scholar]
- 2. van der Weerd NC, Grooteman MP, Nube MJ, ter Wee PM, Swinkels DW, Gaillard CA. Hepcidin in chronic kidney disease: not an anaemia management tool, but promising as a cardiovascular biomarker. Neth J Med. 2015;73(3):108–118. [PubMed] [Google Scholar]
- 3. Charytan DM, Pai AB, Chan CT, et al. Considerations and challenges in defining optimal iron utilization in hemodialysis. J Am Soc Nephrol. 2015;26(6):1238–1247. [DOI] [PMC free article] [PubMed] [Google Scholar]
- 4. Bailie GR, Larkina M, Goodkin DA, et al. Variation in intravenous iron use internationally and over time: the Dialysis Outcomes and Practice Patterns Study (DOPPS). Nephrol Dial Transplant. 2013;28(10):2570–2579. [DOI] [PubMed] [Google Scholar]
- 5. Karaboyas A, Zee J, Morgenstern H, et al. Understanding the recent increase in ferritin levels in United States dialysis patients: potential impact of changes in intravenous iron and erythropoiesis‐stimulating agent dosing. Clin J Am Soc Nephrol. 2015;10(10):1814–1821. [DOI] [PMC free article] [PubMed] [Google Scholar]
- 6. Macdougall IC, Bircher AJ, Eckardt KU, et al. Iron management in chronic kidney disease: conclusions from a "Kidney Disease: Improving Global Outcomes" (KDIGO) Controversies Conference. Kidney Int. 2016;89(1):28–39. [DOI] [PubMed] [Google Scholar]
- 7. Singh N, Agarwal AK. Pumping iron: revisiting risks, benefits and strategies in treatment of iron deficiency in end‐stage renal disease. Clin Nephrol. 2012;77(3):188–194. [DOI] [PubMed] [Google Scholar]
- 8. Gupta A, Mishra B, Handelman GJ, Crumbliss AL, Pratt R. Structural, physical and functional characterization of ferric pyrophosphate citrate (FPC, Triferic), a novel iron compound for pharmaceutical applications. Nephrol Dial Transplant. 2015;30:iii299. [Google Scholar]
- 9. Gupta A, Amin NB, Besarab A, et al. Dialysate iron therapy: infusion of soluble ferric pyrophosphate via the dialysate during hemodialysis. Kidney Int. 1999;55(5):1891–1898. [DOI] [PubMed] [Google Scholar]
- 10. Gupta A, Crumbliss AL. Treatment of iron deficiency anemia: are monomeric iron compounds suitable for parenteral administration? J Lab Clin Med. 2000;136(5):371–378. [DOI] [PubMed] [Google Scholar]
- 11. Gosriwatana I, Loreal O, Lu S, Brissot P, Porter J, Hider RC. Quantification of non‐transferrin‐bound iron in the presence of unsaturated transferrin. Anal Biochem. 1999;273(2):212‐220. [DOI] [PubMed] [Google Scholar]
- 12. Goggin MM, Gozum SD, Burrows DM, et al. Analysis of total and transferrin‐bound iron in human serum for pharmacokinetic studies of iron‐sucrose formulations. Bioanalysis. 2011;3(16):1837‐1846. [DOI] [PubMed] [Google Scholar]
- 13. Kroot JJ, Laarakkers CM, Geurts‐Moespot AJ, et al. Immunochemical and mass‐spectrometry‐based serum hepcidin assays for iron metabolism disorders. Clin Chem. 2010;56(10):1570‐1579. [DOI] [PubMed] [Google Scholar]
- 14. Laarakkers CM, Wiegerinck ET, Klaver S, et al. Improved mass spectrometry assay for plasma hepcidin: detection and characterization of a novel hepcidin isoform. PloS One. 2013;8(10):e75518. [DOI] [PMC free article] [PubMed] [Google Scholar]
- 15. Galesloot TE, Vermeulen SH, Geurts‐Moespot AJ, et al. Serum hepcidin: reference ranges and biochemical correlates in the general population. Blood. 2011;117(25):e218‐e225. [DOI] [PubMed] [Google Scholar]
- 16. Himmelfarb J, Ikizler TA, Ellis C, et al. Provision of antioxidant therapy in hemodialysis (PATH): a randomized clinical trial. J Am Soc Nephrol. 2014;25(3):623‐633. [DOI] [PMC free article] [PubMed] [Google Scholar]
- 17. Danielson BG. Structure, chemistry, and pharmacokinetics of intravenous iron agents. J Am Soc Nephrol. 2004;15 Suppl 2:S93‐S98. [DOI] [PubMed] [Google Scholar]
- 18. Pai AB, Conner T, McQuade CR, Olp J, Hicks P. Non‐transferrin bound iron, cytokine activation and intracellular reactive oxygen species generation in hemodialysis patients receiving intravenous iron dextran or iron sucrose. Biometals. 2011;24(4):603‐613. [DOI] [PubMed] [Google Scholar]
- 19. Brissot P, Ropert M, Le Lan C, Loreal O. Non‐transferrin bound iron: a key role in iron overload and iron toxicity. Biochim Biophys Acta. 2012;1820(3):403‐410. [DOI] [PubMed] [Google Scholar]
- 20. Cabantchik ZI. Labile iron in cells and body fluids: physiology, pathology, and pharmacology. Front Pharmacol. 2014;5:45. [DOI] [PMC free article] [PubMed] [Google Scholar]
- 21. Esposito BP, Breuer W, Sirankapracha P, Pootrakul P, Hershko C, Cabantchik ZI. Labile plasma iron in iron overload: redox activity and susceptibility to chelation. Blood. 2003;102(7):2670–2677. [DOI] [PubMed] [Google Scholar]
- 22. Geisser P, Burckhardt S. The pharmacokinetics and pharmacodynamics of iron preparations. Pharmaceutics. 2011;3(1):12–33. [DOI] [PMC free article] [PubMed] [Google Scholar]
- 23. Fishbane SN, Singh AK, Cournoyer SH, et al. Ferric pyrophosphate citrate (Triferic) administration via the dialysate maintains hemoglobin and iron balance in chronic hemodialysis patients. Nephrol Dial Transplant. 2015;30(12):2019–2026. [DOI] [PMC free article] [PubMed] [Google Scholar]
- 24. Hosain F, Marsaglia G, Finch CA. Blood ferrokinetics in normal man. J Clin Invest. 1967;46(1):1–9. [DOI] [PMC free article] [PubMed] [Google Scholar]
- 25. Kitsati N, Liakos D, Ermeidi E, et al. Rapid elevation of transferrin saturation and serum hepcidin concentration in hemodialysis patients after intravenous iron infusion. Haematologica. 2015;100(3):e80–e83. [DOI] [PMC free article] [PubMed] [Google Scholar]
- 26. Conner TA, McQuade C, Olp J, Pai AB. Effect of intravenous vitamin C on cytokine activation and oxidative stress in end‐stage renal disease patients receiving intravenous iron sucrose. Biometals. 2012;25(5):961–969. [DOI] [PubMed] [Google Scholar]
- 27. Susantitaphong P, Alqahtani F, Jaber BL. Efficacy and safety of intravenous iron therapy for functional iron deficiency anemia in hemodialysis patients: a meta‐analysis. Am J Nephrol. 2014;39(2):130–141. [DOI] [PubMed] [Google Scholar]
- 28. Gupta A, Lin V, Guss C, Pratt R, Ikizler TA, Besarab A. Ferric pyrophosphate citrate administered via dialysate reduces erythropoiesis‐stimulating agent use and maintains hemoglobin in hemodialysis patients. Kidney Int. 2015;88(5):1187–1194. [DOI] [PMC free article] [PubMed] [Google Scholar]
Associated Data
This section collects any data citations, data availability statements, or supplementary materials included in this article.
Supplementary Materials
Additional supporting information may be found in the online version of this article at the publisher's web‐site.
Figures. S1–S3


