Abstract
We demonstrate that the open-source i2b2 (Informatics for Integrating Biology and the Bedside) data model can be used to bootstrap rural health analytics and learning networks. These networks promote communication and research initiatives by providing the infrastructure necessary for sharing data and insights across a group of healthcare and research partners. Data integration remains a crucial challenge in connecting rural healthcare sites with a common data sharing and learning network due to the lack of interoperability and standards within electronic health records. The i2b2 data model acts as a point of convergence for disparate data from multiple healthcare sites. A consistent and natural data model for healthcare data is essential for overcoming integration issues, but challenges such as those caused by weak data standardization must still be addressed. We describe our experience in the context of building the West Virginia/Kentucky Health Analytics and Learning Network, a collaborative, multi-state effort connecting rural healthcare sites.
I. Introduction
Health outcomes in Appalachia rank among the lowest in the nation; West Virginia and Kentucky rank 47th and 44th respectively in overall health status and are home to many counties with some of the most severe health disparities in the United States of America [1]. Interdisciplinary collaboration across health systems, academic centers, networks, and funded efforts is essential to address these challenges and achieve the Triple Aim of enhanced patient care, improved population health, and lowered health care cost [2]. Interventions driven from electronic health record (EHR) data hold great promise in helping to achieve these goals, yet challenges remain surrounding EHR data standardization, sharing, and access. Data integration has been identified as a key informatics challenge in establishing collaborative healthcare data networks [3]. These informatics networks are constructed between healthcare centers to provide infrastructure for collaboration on many fronts including research, data sharing, analytical insights, and cross-site learning.
Rural networks are the first step toward targeting full population research at large, where EHR data is aggregated across hospitals in order to create large-N data sets, which itself might have beneficial financial consequences [4]. Rural networks are an important step in unlocking data which would otherwise be unavailable to biomedical researchers. Data integration is particularly challenging for networks of rural hospitals due to weak EHR adoption and standardization; a number of studies in small rural practices and under-served communities have documented the challenges of adoption and implementation of EHRs [5], [6]. The challenge of connecting multiple independent healthcare sites stems from incompatibilities and inconsistencies in the underlying data model of EHRs. It is highly unlikely that each site in the network uses the same EHR unless a common EHR was developed in advance and in fact, even if the same EHR vendor is used, version incompatibilities exist [3]. Establishing a comprehensive common data model is a necessary first step to building a network that can support queries across its members; transforming data from the source into this common model becomes a secondary challenge that can be alleviated with heavy use of data standards. Once the source data is extracted, transformed, and loaded into the common data model, interoperable communication between the autonomous healthcare sites can begin.
We will explore the benefits and challenges of adopting an open-source data model; in particular, we use the data model from the i2b2 query tool to quickly bootstrap a collaborative network and describe what analytical consequences follow. We report our findings in the context of constructing the West Virginia/Kentucky Health Analytics and Learning Network (HALN), illustrated in Fig. 1. The goal of our network is to advance practice transformation across partners by benchmarking quality improvement outcomes and using the comparisons to drive evidence-based quality improvement. The network is composed of primary care, academic, and public health partners across West Virginia and Kentucky, each capable of effectively addressing shared priority health concerns through comparison of EHR generated health outcomes using the i2b2 platform. This type of collaborative, interdisciplinary effort is essential to overcoming the challenges associated not only with data standardization and consistent measurement across health systems, but in best realizing the potential role of networked clinical data in improving care and reducing costs. Our experience will help inform other rural communities of the possible road map and challenges in establishing a collaborative network.
Fig. 1.
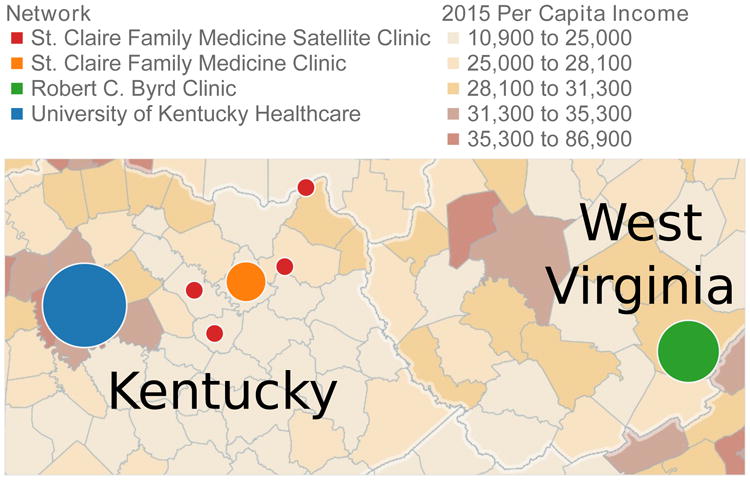
The West Virginia/Kentucky Health Analytics and Learning Network (HALN) is a multi-state effort to establish a collaborative network of rural health clinics.
II. Data Modeling and Integration
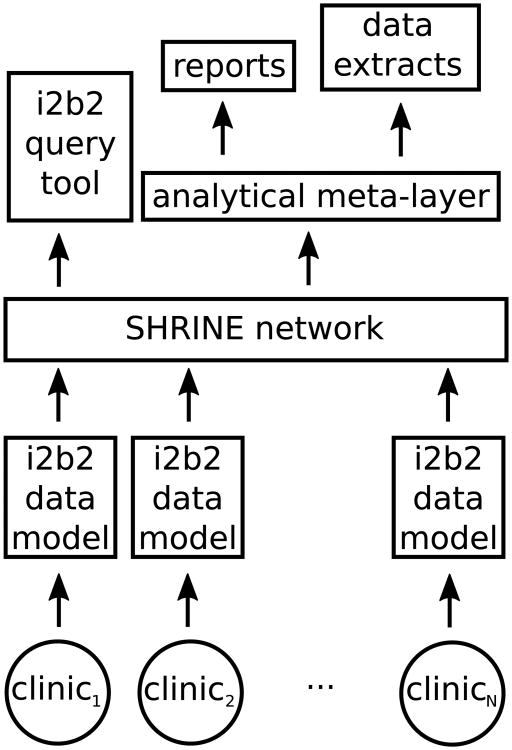
The i2b2 (Informatics for Integrating Biology and the Bedside) query tool has been widely successful in overcoming the challenge of finding patient cohorts for clinical research [7]; the tool is a user-friendly drag-and-drop interface that allows a researcher to construct Boolean queries of inclusion and exclusion criteria that pinpoint a population necessary for the researcher's study. i2b2 is used by over half of all institutions receiving a Clinical and Translational Science Award (CTSA), over 60 academic medical centers, and over 10 international medical centers [8]. SHRINE (Shared Health Research Information Network) introduced the possibility of federated i2b2 networking, where a single query can target multiple i2b2 data repositories and report back how many patients matched the query's criteria [9], [10]. Although obtaining counts of patient cohorts was not the primary mission of the West Virginia/Kentucky HALN, we were more than welcoming of SHRINE's ability to report aggregate counts as an additional perk of adopting the i2b2 data model. For the West Virginia/Kentucky HALN, we mapped each clinic's data to the i2b2 data model and created a local SHRINE-based network, as illustrated in Fig. 2. After homogenizing each site's data through the i2b2 data model, we constructed an analytical meta-data layer to assist in reporting and extracting data, which we discuss in Section III.
Fig. 2.
We can map each hospital or clinic's data to the i2b2 data model and connect them together as a SHRINE-based network. Mapping the data allows us to leverage the existing i2b2 query tool and to build the necessary analytical meta-layer that supports consistent reporting and intelligent extraction of data across sites.
A. i2b2 Data Model
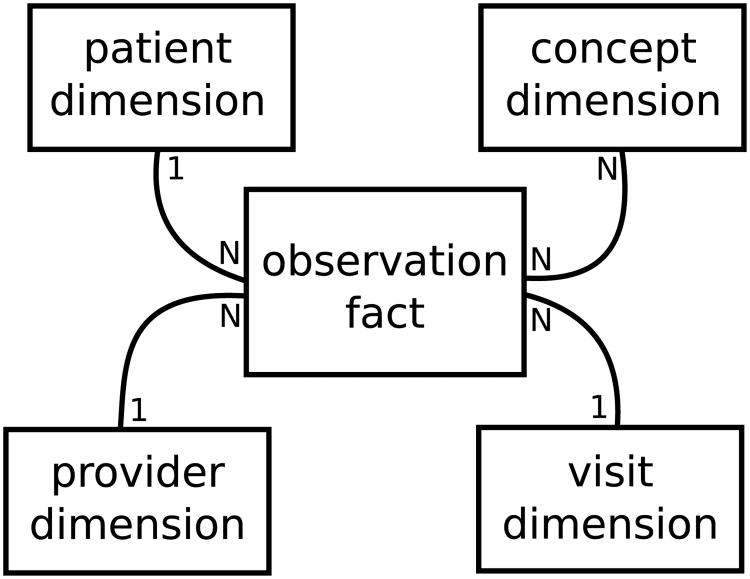
The core of the i2b2 data model is the clinical research chart (CRC): a star-schema having patient, visit, concept, and provider dimensions that each link to a central fact table of observations, where each row is conceptually some fact about a patient at a particular visit [7], as illustrated in Fig. 3. The model has been described as a hybrid approach [11] where each observed fact is a concept recorded in an entity-attribute-value (EAV) model [12]. In this EAV model, observations appear as rows instead of columns, which allows the model to be easily extended. These observations can be any concept known to the model in the concept dimension, such as lab results, diagnoses, procedures, and so on. The EAV model is known to perform efficiently at the database level because it is easily indexed [7], but historically it is cumbersome to build reports from due to the number of manipulations required to convert it to a column-based table compatible with common reporting tools [13] and is still an open problem in EAV-based data modeling [14].
Fig. 3.
Observations are central to the i2b2 data model; one patient and one visit can have many observations.
The i2b2 data model encourages the adoption of data standards and common data vocabularies within the concept dimension; for example, laboratory results may be coded with Logical Observation Identifiers Names and Codes (LOINC) [15]. The difficulty of mapping data into the i2b2 model becomes the difficulty of creating the correct conceptual meta-data to drive and unify systems. Two large hurdles must be passed: integrating data created without common coding standards and integrating data across sites containing competing coding standards.
B. Integrating Data without Standards
If clinical data is created without a standard vocabulary or coding system, secondary use in collaborative networks is problematic because the path to mapping to a common standard is unknown. In the case of free text, natural language processing becomes necessary to map the text to known concepts in a controlled vocabulary. Similar to data lacking standards, it is possible to see data created in EHRs according to a local, internal standard to the clinic. Although this is an improvement from an organizational point of view, mapping a common standard remains challenging. In a previous study, we observed laboratory data coded according to internal standards [3] and successfully mapped internal labels to LOINC by using RELMA [15].
C. Integrating Data with Competing Standards
The i2b2 data model allows for flexibility in choosing what coding system or vocabulary can be used for any particular observation; the i2b2 meta-data and concept dimension outlines what codes are known. Data models that emphasize standards, such as the common data model (CDM) from the Observational Medical Outcomes Partnership (OMOP), do exist [16] and are worth considering. In fact, many common data models have been studied and techniques for normalization of the semantic content between them have been proposed [17]. The flexibility of i2b2 was key in our choice and it has enabled a rich, networked solution through SHRINE and the corresponding query tool.
A natural consequence of using common data vocabularies for i2b2 dimensions is that reporting and analysis across sites becomes easier. For example, if all sites encoded diagnoses as ICD10, then the reporting logic doesn't change within the network and allows for clever reuse of analytical efforts [18] as we will discuss in Section III. Not every dimension about a patient will be as obvious to code as diagnoses and in fact, as in the case of medications, many competing vocabularies and drug databases exist where historically discrepancies are a known issue [19]. In the West Virginia and Kentucky HALN, medications across the sites were encoded as either Cerner's Multum [20] or National Drug Codes (NDCs) [21]; mappings between Multum and NDCs exist in Cerner's Lexicon database [20]. The biggest issue is that this mapping might not be a true one-to-one correspondence and it becomes an interesting informatics problem of fitting a medication from one vocabulary into another. For our network, the problem of mapping drugs with one-to-many candidates was alleviated by generalizing possible target candidate codes to their hierarchical parent concept in i2b2.
III. Layering Analytics
The analytics layer of collaborative networks is largely dependent upon the underlying network topology. A known challenge of collaborative networks in rural settings is the lack of information technology infrastructure at each individual site, which ultimately forces centralization at locations with adequate resources [3]. Data from the rural clinics were curated and hosted by its local regional academic research institution; as seen in Fig. 1, the University of Kentucky hosted an i2b2 instance for St. Claire and its network of rural satellite clinics, while West Virginia University hosted an i2b2 instance for the Robert C. Byrd Clinic; these two hosts were then connected via SHRINE for federated aggregate queries.
In addition to the aggregate counts that are easily delivered, the i2b2 query tool also provides some basic visualizations out of the box, such as histograms of demographics and time-lines of observations. As seen in Fig. 2, we construct our own analytical meta-data layer on top of our SHRINE network in order to facilitate reports and data extracts. We connected Tableau [18] to our i2b2 data repositories in order to build reports that each participating clinical site would find useful to help satisfy our multi-aim approach to constructing a collaborative network. As mentioned in Section II, external reporting can be cumbersome from i2b2's EAV observation model so additional tables and views were constructed to help facilitate this aim. In fact, we are looking at integrating i2b2t2 (i2b2 to Tableau), our separate project that enables quick visualization of patient populations discovered within i2b2 [18].
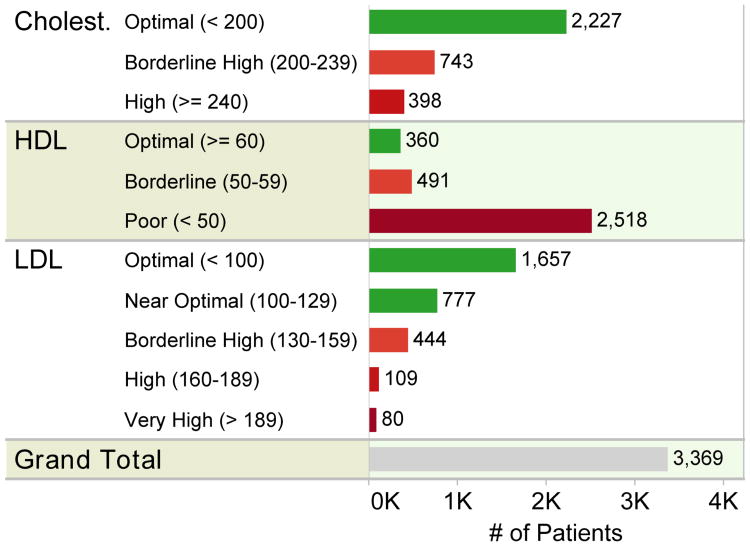
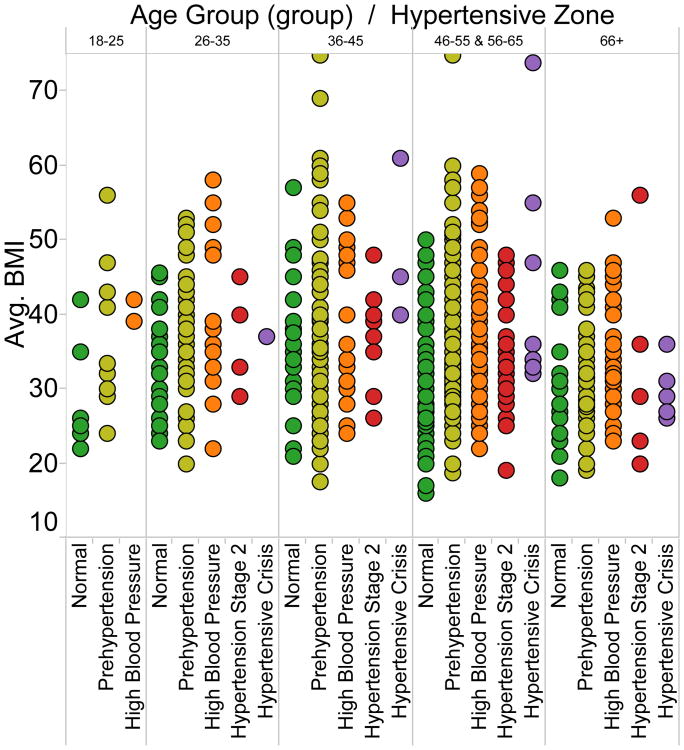
Once analytics is layered on top of the data model, strides toward the mission of the network can begin to happen with engagement from all stakeholders as anticipated in Section I. Common analytical tasks include visualizing populations for quality improvement, which includes sub-tasks such as visualizing issues, outliers, and differential outcomes. In Fig. 4 for a population of hypertensive patients, HDL cholesterol is clearly a problem that requires intervention and management. In Fig. 5, extreme body-mass indexes are notable and differences between age groups with respect to body-mass index and state of hypertension can be noted.
Fig. 4.
Visualization rapidly reveals what clinical issues might exist by simply mapping laboratory results with respect to their known ranges.
Fig. 5.
Visualization quickly reveals outlying values and can assist in finding insights per semantic groupings.
IV. Conclusions
The need to leverage a tool and model like i2b2 to quickly bootstrap a collaborative network largely stems from two factors: (1) the means for collaboration across healthcare institutions and states is often absent in rural settings and (2) challenges still remain surrounding EHR data standardization, sharing, and access. We have shared the benefits, consequences, and challenges of selecting i2b2 from our experience in creating the West Virginia/Kentucky HALN so that other rural communities are informed of the possible road map and problems that lie ahead in rural collaborative networking. i2b2 is great at identifying and counting patient populations; we have demonstrated that even though the mission of our network was different than that of what i2b2 naturally offers, the underlying i2b2 data model is still vastly helpful in quickly bootstrapping collaborative efforts.
Acknowledgments
The project described was supported by the National Center for Advancing Translational Sciences, National Institutes of Health, through grant number UL1TR000117 and by the National Institute of General Medical Sciences, NIH, through IDeA CTR award number U54GM104942. The content is solely the responsibility of the authors and does not necessarily represent the official views of the NIH.
Contributor Information
Daniel R. Harris, Center for Clinical and Translational Sciences and the Institute for Pharmaceutical Outcomes and Policy at the University of Kentucky, Lexington, Kentucky 40506
Adam D. Baus, School of Public Health at West Virginia University, Morgantown, wv 26506
Tamela J. Harper, Center for Clinical and Translational Sciences and the Institute for Pharmaceutical Outcomes and Policy at the University of Kentucky, Lexington, Kentucky 40506
Traci D. Jarrett, School of Public Health at West Virginia University, Morgantown, wv 26506
Cecil R. Pollard, School of Public Health at West Virginia University, Morgantown, wv 26506
Jeffery C. Talbert, Center for Clinical and Translational Sciences and the Institute for Pharmaceutical Outcomes and Policy at the University of Kentucky, Lexington, Kentucky 40506
References
- 1.State public health statistics. [Accessed Mar. 8, 2016]; [Online]. Available: http://www.americashealthrankings.org/states.
- 2.The institute for healthcare improvement: the ihi triple aim. [Accessed Mar. 8, 2016]; [Online]. Available: http://www.ihi.org/engage/initiatives/tripleaim/pages/default.aspx.
- 3.Harris DR, Harper TJ, Henderson DW, Henry KW, Talbert JC. Proceedings of the IEEE International Conference on Biomedical and Health Informatics. IEEE; 2016. Informatics-based challenges of building collaborative healthcare research and analysis networks from rural community health centers; pp. 513–516. [DOI] [PMC free article] [PubMed] [Google Scholar]
- 4.Mandl KD, Kohane IS. Federalist principles for healthcare data networks. Nature biotechnology. 2015;33(4):360–363. doi: 10.1038/nbt.3180. [DOI] [PMC free article] [PubMed] [Google Scholar]
- 5.Bahensky JA, Jaana M, Ward MM. Health care information technology in rural america: electronic medical record adoption status in meeting the national agenda. The Journal of Rural Health. 2008;24(2):101–105. doi: 10.1111/j.1748-0361.2008.00145.x. [DOI] [PubMed] [Google Scholar]
- 6.King J, Furukawa MF, Buntin MB. Geographic variation in ambulatory electronic health record adoption: implications for underserved communities. Health Services Research. 2013;48(6pt1):2037–2059. doi: 10.1111/1475-6773.12078. [DOI] [PMC free article] [PubMed] [Google Scholar]
- 7.Murphy SN, Weber G, Mendis M, Gainer V, Chueh HC, Churchill S, Kohane I. Serving the enterprise and beyond with informatics for integrating biology and the bedside (i2b2) Journal of the American Medical Informatics Association. 2010;17(2):124–130. doi: 10.1136/jamia.2009.000893. [DOI] [PMC free article] [PubMed] [Google Scholar]
- 8.Kohane IS, Churchill SE, Murphy SN. A translational engine at the national scale: informatics for integrating biology and the bedside. Journal of the American Medical Informatics Association. 2012;19(2):181–185. doi: 10.1136/amiajnl-2011-000492. [DOI] [PMC free article] [PubMed] [Google Scholar]
- 9.Weber GM, Murphy SN, McMurry AJ, MacFadden D, Nigrin DJ, Churchill S, Kohane IS. The shared health research information network (shrine): a prototype federated query tool for clinical data repositories. Journal of the American Medical Informatics Association. 2009;16(5):624–630. doi: 10.1197/jamia.M3191. [DOI] [PMC free article] [PubMed] [Google Scholar]
- 10.McMurry AJ, Murphy SN, MacFadden D, Weber G, Simons WW, Orechia J, Bickel J, Wattanasin N, Gilbert C, Trevvett P, et al. Shrine: enabling nationally scalable multi-site disease studies. PloS one. 2013;8(3):e55811. doi: 10.1371/journal.pone.0055811. [DOI] [PMC free article] [PubMed] [Google Scholar]
- 11.Huser V, Cimino JJ. Proceedings of the Annual Symposium of the American Medical Informatics Association. Vol. 2013. American Medical Informatics Association; 2013. Desiderata for healthcare integrated data repositories based on architectural comparison of three public repositories; pp. 648–656. [PMC free article] [PubMed] [Google Scholar]
- 12.Dinu V, Nadkarni P. Guidelines for the effective use of entity– attribute–value modeling for biomedical databases. International journal of medical informatics. 2007;76(11):769–779. doi: 10.1016/j.ijmedinf.2006.09.023. [DOI] [PMC free article] [PubMed] [Google Scholar]
- 13.Nadkarni PM, Brandt C. Data extraction and ad hoc query of an entityattributevalue database. Journal of the American Medical Informatics Association. 1998;5(6):511–527. doi: 10.1136/jamia.1998.0050511. [DOI] [PMC free article] [PubMed] [Google Scholar]
- 14.Luo G, Frey L. Efficient execution methods of pivoting for bulk extraction of entity-attribute-value-modeled data. IEEE journal of biomedical and health informatics. 2015;20(2):644–654. doi: 10.1109/JBHI.2015.2392553. [DOI] [PMC free article] [PubMed] [Google Scholar]
- 15.McDonald CJ, Huff SM, Suico JG, Hill G, Leavelle D, Aller R, Forrey A, Mercer K, DeMoor G, Hook J, et al. Loinc, a universal standard for identifying laboratory observations: a 5-year update. Clinical Chemistry. 2003;49(4):624–633. doi: 10.1373/49.4.624. [DOI] [PubMed] [Google Scholar]
- 16.Stang PE, Ryan PB, Racoosin JA, Overhage JM, Hartzema AG, Reich C, Welebob E, Scarnecchia T, Woodcock J. Advancing the science for active surveillance: rationale and design for the observational medical outcomes partnership. Annals of internal medicine. 2010;153(9):600–606. doi: 10.7326/0003-4819-153-9-201011020-00010. [DOI] [PubMed] [Google Scholar]
- 17.Paraiso-Medina S, Perez-Rey D, Bucur A, Claerhout B, Alonso-Calvo R. Semantic normalization and query abstraction based on snomed-ct and hl7: supporting multicentric clinical trials. Biomedical and Health Informatics, IEEE Journal of. 2015;19(3):1061–1067. doi: 10.1109/JBHI.2014.2357025. [DOI] [PubMed] [Google Scholar]
- 18.Harris DR, Henderson DW. Proceedings of the Joint Summits of the American Medical Informatics Association. Vol. 2016. American Medical Informatics Association; 2016. i2b2t2: unlocking visualization for clinical research. [PMC free article] [PubMed] [Google Scholar]
- 19.Guo JJ, Diehl MC, Felkey BG, Gibson JT, Barker KN. Comparison and analysis of the national drug code systems among drug information databases. Drug information journal. 1998;32(3):769–775. [Google Scholar]
- 20.Cerner multum lexicon. [Accessed Mar. 8, 2016]; [Online]. Available: http://www.multum.com/lexicon.html.
- 21.National drug code directory. [Accessed Mar. 8, 2016]; [Online]. Available: http://www.fda.gov/Drugs/InformationOnDrugs/ucm142438.htm.


