

ABSTRACT
Our information‐driven docking approach HADDOCK is a consistent top predictor and scorer since the start of its participation in the CAPRI community‐wide experiment. This sustained performance is due, in part, to its ability to integrate experimental data and/or bioinformatics information into the modelling process, and also to the overall robustness of the scoring function used to assess and rank the predictions. In the CASP‐CAPRI Round 1 scoring experiment we successfully selected acceptable/medium quality models for 18/14 of the 25 targets – a top‐ranking performance among all scorers. Considering that for only 20 targets acceptable models were generated by the community, our effective success rate reaches as high as 90% (18/20). This was achieved using the standard HADDOCK scoring function, which, thirteen years after its original publication, still consists of a simple linear combination of intermolecular van der Waals and Coulomb electrostatics energies and an empirically derived desolvation energy term. Despite its simplicity, this scoring function makes sense from a physico‐chemical perspective, encoding key aspects of biomolecular recognition. In addition to its success in the scoring experiment, the HADDOCK server takes the first place in the server prediction category, with 16 successful predictions. Much like our scoring protocol, because of the limited time per target, the predictions relied mainly on either an ab initio center‐of‐mass and symmetry restrained protocol, or on a template‐based approach whenever applicable. These results underline the success of our simple but sensible prediction and scoring scheme. Proteins 2017; 85:417–423. © 2016 Wiley Periodicals, Inc.
Keywords: docking, biomolecular complexes, ranking, electrostatics, van der Waals energy, desolvation energy, scoring functions, data‐driven docking
Abbreviations
- CAPRI
Critical Assessment of PRedicted Interactions
- CASP
Critical Assessment of protein Structure Prediction
- FCC
Fraction of Common Contacts
- HS
HADDOCK Score
INTRODUCTION
Cells are busy environments in which all the biological processes take place and proteins are the main protagonists.1 Interactions between proteins are intrinsic to their function, and dysfunction in their communication is usually the main cause of diseases. Understanding such interactions is therefore a crucial step in the investigation of biological systems and a starting point toward rational drug design.2 The high‐resolution atomic structures of biomolecular complexes hold the key for a deep understanding of the related processes and their mechanisms, but the experimental determination of such structures is usually a time‐consuming and costly process.3 Indeed, although many thousands of interactions are known, precise molecular details are available only for a tiny fraction of them.4 In this scenario, the structure prediction of biological assemblies with computational methods such as docking plays a crucial complementary role to classical structural biology techniques. Docking aims at predicting the three‐dimensional (3D) structure of a complex (bound form) given the structures or models of its unbound constituents. It consists in the generation of a large number of conformations (search or sampling), followed by the identification of the biologically relevant models, that is, the models close to the native conformation of the complex (scoring). Scoring is a delicate step in this process since an exhaustive sampling of the conformational space will not be enough to obtain acceptable conformations if the scoring phase is not able to fish‐out correct solutions among the generated pool. The Critical Assessment of PRedicted Interactions (CAPRI) experiment,5 established in 2001, has fostered an important role in advancing the field of protein–protein docking (and lately expanding its focus also to different kind of targets). Modelled after the Critical Assessment of protein Structure Prediction (CASP),6, 7 CAPRI invites its participants to predict the 3D structure of a biological complex prior to its publication and it incorporates a dedicated session on the assessment of scoring functions. The ‘scorer’ groups in CAPRI are asked to evaluate a set of models (uploaded from the ‘predictors’ groups and shuffled) using the scoring function of their choice, and submit their 10 best ranked models. At the end of each round, the submitted models are assessed by comparing them against the structure of the complex determined by experimental methods.
Our information‐driven docking approach HADDOCK8 is a consistent top predictor and scorer since the start of its participation in the CAPRI community‐wide experiment.9, 10, 11, 12, 13 This sustained performance is due, in part, to its ability to integrate experimental data and/or bioinformatics information into the modelling process, and also to the overall robustness of its scoring function. Thirteen years after the original publication, the HADDOCK scoring function remains a simple linear combination of OPLS14 intermolecular van der Waals and Coulomb electrostatics energies, an empirically derived desolvation energy term,15 and, when applicable, one or more restraint energy terms reflecting the agreement between models and experimental/prediction information.
Here we describe our scoring strategy in CAPRI and present the performance of HADDOCK during the first combined CASP‐CAPRI edition, which brought together experts from the protein structure prediction and the protein–protein docking community.16 This CASP‐CAPRI Round 1 edition, corresponding to CASP Round 11 and CAPRI Round 30, consisted of 25 targets, a subset of the 100 regular CASP11 targets. Most of these CASP‐CAPRI target were classified as homo‐oligomers. The outstanding results of HADDOCK during this round (18 of 25 successfully scored targets) underline the success of our simple but sensible scoring scheme.16
METHODS
HADDOCK protocol and its scoring function
HADDOCK8, 10, 17 is a high ambiguity driven docking program making use of biochemical and/or biophysical interaction data [typically translated into ambiguous distance (or interaction) restraints – AIRs] to drive docking. It makes use of CNS (Crystallographic and NMR system)18 as its structure calculation engine. The protocol consists of three steps: (i) Randomization of orientation and rigid body docking by restraint‐guided energy minimization (it0), (ii) Semi‐flexible refinement in torsion angle space in which side‐chains and backbone atoms are kept flexible (it1), and (iii) Refinement in explicit solvent.
At the end of each step, solutions are scored according to a linear combination of energetics terms, which together form the HADDOCK Score (HS). This score is a sum of terms whose weights depends on the stage of the HADDOCK protocol:
| (1) |
| (2) |
| (3) |
where E vdW and E elec represent non‐bonded energies, that is, van der Waals and Coulomb intermolecular energies, respectively, E desolv is an empirical desolvation term,15 BSA is the buried surface area upon complex formation in Å2 and E AIR is the restraint violation energy expressing the agreement between experimental and back‐calculated data. Other terms might be included, such as E sym for symmetry restraints, according to the settings applied.19 The intermolecular energies are calculated using the OPLS force field14 parameters for non‐bonded atoms, using a 8.5 Å cut‐off with a shifting function for the electrostatic energy and switching function between 6.5 and 8.5 Å for the van der Waals energy.
The final water refined structures are clustered according to either Fraction of Common Contacts (FCC, default in HADDOCK2.2), grouping models based on the similarity of their contact networks at the interface20 or backbone interface‐ligand RMSD similarity. By default, a cluster is defined if a minimum of 4 models falls into the same group, applying as cut‐offs 0.75 for the FCC clustering or 7.5 Å for backbone interface‐ligand RMSD.
Finally, the resulting clusters are analyzed and ranked according to the average HS of their top four members to ensure the scoring is based on a similar number of models per cluster.
HADDOCK prediction strategy in CASP‐CAPRI
In this CASP‐CAPRI Round 1, we modelled the individual subunits for each target using a combination of homology modeling/threading and docking/refinement with the HADDOCK web server (we only submitted models for CAPRI's server category) (see Supporting Information Table S1 for details). Ab‐initio or template‐based docking strategies were followed: in the ab‐initio docking mode, distance restraints between the center of masses of the molecules are defined. Two kinds of symmetry restraints were applied: i) non‐crystallographic symmetry and ii) regular symmetry, enforced by defining pairs of intermolecular distances that must be equal (symmetry potential in CNS).19 The default parameters for the sampling were increased to 10000/400/400 for it0 (rigid), it1 (semi‐flexible) and water stages, respectively. In cases where homologs of the complexes could be identified,21 template‐based modeling was used. In this case, three approaches were followed to exploit the information from the identified template: (i) direct model of the complex through homology modeling, followed by refinement with the HADDOCK refinement server;22 (ii) AIR‐guided docking, applying Ambiguous Interaction Restraints in HADDOCK; (iii) alpha carbon‐alpha carbon (CA‐CA) guided docking, applying pairwise interface distance restraints derived from the template in HADDOCK23 (see Supporting Information Table S1 for details). The models for submission were selected from the clusters generated by HADDOCK, with four models taken from the top‐ranking cluster (or two from the top‐two ranking clusters in case their scores are overlapping within standard deviation). For detailed information about the approaches used for the related CAPRI targets refer to Supporting Information Table S1 or Supporting Information in Lensink et al. (2016).16
HADDOCK scoring strategy in CAPRI
For the CAPRI scoring rounds, our protocol consists of three main steps. First, we select the subset of common residues between all the models in order to score on a similar set of residues. Second, we build the missing atoms by processing the models according to our force field topology with standard HADDOCK scripts using CNS6 and perform a short energy minimization with the following parameters:
50 conjugate gradient EM steps;
Van der Waals interactions truncated below the distance of 0.5 Å;
Dielectric constant ε = 1.
The HADDOCK scoring function used for CAPRI scoring is our standard scoring function excluding any experimental energy terms:
| (4) |
No experimental or bioinformatics predictions information is used in the scoring. The models are clustered using either the FCC algorithm with a threshold of 0.75 (typically used for complexes consisting of >2 components), or the RMSD‐based one using a cut‐off of 5.0 Å. During manual submissions, we might also consider any additional available information in the system for the final ranking. However, during the combined CASP‐CAPRI prediction round, because of the high target release frequency, we relied solely on our standard scoring function to select the best clusters. Our top 10 scoring predictions consisted of the top 2 models of the best cluster (clusters – in case of overlap in score) and the top 1 model for the remaining clusters, or individual top 10 models if the clustering failed.
The weights in the HADDOCK simple scoring function were originally optimized on a limited number of complexes.8 Since then, it has been revisited several times and the original scheme proved to be robust so far on a variety of systems (e.g., protein‐protein, protein‐nucleic acids). We opted for simple, single digit weights since the achievable accuracy would not justify a fine tuning in our opinion. The 1.0/0.2 ration for van der Waals and electrostatic energies is also reminiscent of Linear Interaction Energy models for free energy estimates.24
RESULTS AND DISCUSSION
The CAPRI targets
A total of 25 targets were evaluated in CAPRI Round 30, consisting of all the “easy” CASP oligomers, that is, those whose 3D structure of the components could be easily modeled using standard homology modeling techniques. Two additional targets (T76 and T83) were cancelled due to the public availability of information concerning the coordinates of the complex during the days of the experiment. Among those 25 targets, 18 were declared to be dimers, five tetramers and two hetero‐complexes. At the time of the experiment, author‐assigned oligomeric states were available only for a subset of about 15 targets, while for the remaining one, it was guessed from the crystal structure using the PISA software.25 Among those, T91, predicted to be a dimer by PISA, was later assigned as a monomer by the authors.
The homodimers T69, T75, T80, T82, T84, T85, T87, T90, T91, T92, T93 and T94 were classified as easy targets, and T68, T72, T77, T79, T86 and T88 as difficult. The remaining targets were classified as homotetramers (T70, T71, T73, T74, T78) and heterocomplexes (T81, T89).
HADDOCK's performance in CASP‐CAPRI round 1 scoring
A total of 14 groups took part in the scoring experiment of CAPRI Round 30. Using the simple, physics‐based HADDOCK scoring, the HADDOCK team ranked first both in the server prediction and the scoring sessions. HADDOCK selected acceptable/medium quality models for 18/14 of the 25 targets, failing in 7 cases (T68, T73, T74, T77, T78, T86, T88) that have been labeled either as difficult homodimers or as tetramers. However, for five of those targets, T68, T74, T77, T78 and T88, no acceptable solutions were actually present in the scoring set provided by CAPRI; accordingly, if we exclude those, our effective success rate increases to 18/20 correctly predicted targets, with only two scoring failures for T73 and T86. A summary of HADDOCK scoring predictions for each target is reported in Table 1. For further details about the overall ranking of the CAPRI community, see Lensink et al. 2016.11
Table 1.
Summary of HADDOCK Prediction and Scoring Performance in CASP‐CAPRI
| Target name | Oligomeric statea | HADDOCK server prediction | HADDOCK scoring prediction |
|---|---|---|---|
| T68§ | Homo‐dimer | 0 | 0 |
| T69 | Homo‐dimer | 10 | 4/3** |
| T70 | Homo‐tetramer | 8/7** | 8/6** |
| T71 | Homo‐tetramer | 4 | 2 |
| T72 | Homo‐dimer | 1 | 2 |
| T73 | Homo‐tetramer | 0 | 0 |
| T74§ | Homo‐tetramer | 0 | 0 |
| T75 | Homo‐dimer | 2 | 4/2** |
| T77§ | Homo‐dimer | 0 | 0 |
| T78§ | Homo‐tetramer | 0 | 0 |
| T79 | Homo‐dimer | 0 | 2/1** |
| T80 | Homo‐dimer | 10 | 2/2** |
| T81 | Hetero‐dimer | 0 | 2 |
| T82 | Homo‐dimer | 10/10** | 10** |
| T84 | Homo‐dimer | 10/10** | 7/4** |
| T85 | Homo‐dimer | 10/10** | 10/6** |
| T86 | Homo‐dimer | 0 | 0 |
| T87 | Homo‐dimer | 10/10** | 7/5** |
| T88§ | Hetero‐dimer | 0 | 0 |
| T89 | Hetero‐dimer | 10/8** | 4/1** |
| T90 | Homo‐dimer | 10/10** | 5/4** |
| T91 | Homo‐dimer | 10/10** | 8/6** |
| T92 | Homo‐dimer | 6 | 6/5** |
| T93 | Homo‐dimer | 10/10** | 3/2** |
| T94 | Homo‐dimer | 10 | 3 |
| #Targets | 16/9** | 18/14** |
The overall performance is reported at the bottom in terms of number of successful targets, that is, the ones having at least one acceptable or better solution. The numbers without stars indicate the number of models of acceptable or better quality; numbers with “**” indicate the number of medium quality models.
For targets labeled with “§,” no single acceptable solution was present in the pool of models provided for scoring. See also Supporting Information Table S1 for details about how the server predictions were made.
Oligomeric state provided to the CAPRI participants by the time of the challenge. For further information see Lensink et al. (2016).11
To evaluate the quality of our scoring predictions, we compared the quality of the HADDOCK models against all other models submitted by the CAPRI Round 30 scoring community. The backbone interfacial‐RMSD (i‐RMSD), ligand‐RMSD (l‐RMSD) and Fraction of native contacts (Fnat) of the best HADDOCK model submitted and that of the best model submitted among all other scorer groups (named “CAPRI‐community”) for each target, together with the distribution of i‐RMSD/l‐RMSD/Fnat for all submitted predictions, respectively, are shown in Figure 1. Black/gray filled points correspond to the best HADDOCK/CAPRI‐community submitted models, respectively. The remaining HADDOCK‐scored models are reported as empty circles. In both plots, the majority of the points are found in the region highlighted in different gray shading, corresponding to the threshold of 4.0 Å/10.0 Å/0.1 for i‐RMSD/l‐RMSD/Fnat, respectively, for defining acceptable (or better) models according to the CAPRI criteria. For all our unsuccessful targets except one case (T86), no single acceptable model was submitted by the CAPRI community as a whole. T86, for which some acceptable models were in the scoring set, is our only misprediction compared to the remaining of the community. In regard to the many correct solutions, many of the HADDOCK scoring predictions (black‐filled dots) lie close to the best submission of the CAPRI‐community ones (gray‐filled dots) but often with a little higher i‐RMSD/l‐RMSD/Fnat. Indeed, the average difference for the i‐RMSD/l‐RMSD/Fnat values between the HADDOCK and the CAPRI‐community best models (for the 18/25 targets for which HADDOCK had a successful scoring) is 0.43/1.05/0.09, respectively, indicating that overall only slightly better quality models than ours have been identified by other scoring groups. In Supporting Information Table S2 we reported the exact the values of i‐RMSD, l‐RMSD and Fnat of the best model submitted by HADDOCK and by the remaining CAPRI community.
Figure 1.
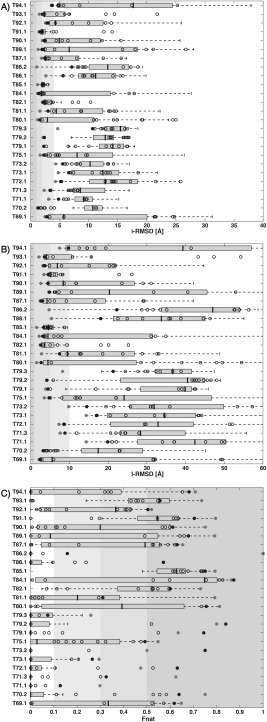
Comparison of the scoring performance of HADDOCK versus the CAPRI community in terms of i‐RMSD, l‐RMSD and Fnat. For each scored interface, the (A) backbone i‐RMSD, (B) l‐RMSD and (C) Fnat values over all the submitted models are reported. Data are shown only for those targets for which at least one acceptable or better solution has been submitted by the community. The number after the target ID refers to the specific interface evaluated in case of multimers with more than two subunits. The i‐RMSD/l‐RMS/Fnat of the HADDOCK models are indicated in black‐empty dots with the best one highlighted with a black‐filled circle and the i‐RMSD/l‐RMSD/Fnat of the best model submitted among the CAPRI scorers except HADDOCK (CAPRI‐community) is indicated by a filled‐gray circle. The box plots report the i‐RMSD/l‐RMSD/Fnat distributions for all models submitted by “others,” each scorer group being allowed to submit 10 models. Background‐gray regions correspond to the thresholds of 4Å/10Å/0.1 for i‐RMSD/l‐RMSD/Fnat, respectively, defining for defining acceptable or better models according to the CAPRI criteria. Increasingly shades of gray have been used for acceptable/medium/acceptable modes thresholds. The median is indication by a thick gray line; the left and right edges of the box indicate the 25th and 75th percentiles, respectively. The whiskers represent all data lying within 1.5 times the interquartile range. Values that falls outside this range are considered outliers and are not shown (plot generated with default values in MATLAB29).
These results highlight that our simple, but sensible—physics‐based—scoring function is highly robust in systematically fishing out near‐native models for almost all the Round 30 cases. It, however, often fails to select the best available model, leaving room for further optimization. Improvements, which would come at the cost of speed, might be obtained by more aggressively minimizing the models prior to scoring. Some initial tests on a few CASP‐CAPRI targets did not results in an improved scoring performance (data not shown). Our simple optimization protocol, combined with our simple scoring function, seems thus rather robust while computationally efficient.
Next challenge in scoring: can we predict reliability?
Being able to correctly rank (or predict) native‐like models is the main aim of a docking program. However, being able to assess the reliability of a prediction, that is, the probability that a predicted solution is actually a native‐like one, is still an unresolved and challenging issue. For this purpose, we investigated whether a general overview of the scores of the provided scoring model sets could provide some insight about the scoring‐prediction's success for a given target. For this, we plotted the distribution of HSs versus the calculated CA RMSD of each model from the top‐ranked model, looking for “energy” funnels which could be indicative of a successful scoring, as previously noted for RosettaDock26: While flat or round score distributions are observed for both successful and unsuccessful predictions, funnel‐like shapes are only observed for successful scoring targets (Supporting Information Fig. S1). This is particularly clear for T84, T85, T87, T90, T91 and T92. It seems thus from this analysis that the presence of a funnel is indicative of a reliable scoring—which is in line with what was previously observed for RosettaDock.26 Absence of a funnel is however not per se predictive of bad scoring.
Impact of the quality of homology models on HADDOCK's prediction performance
Next to its strong scoring performance, HADDOCK maintained its position as top‐performing software in the server prediction category: successful predictions were submitted for 16 of the 25 targets. For five out of the nine HADDOCK failures, no acceptable model was submitted by the entire CAPRI community, due mainly to homology modeling challenges and/or large conformational changes (see below). For almost all the “easy” targets, for which in most cases (10 out of 12) a template‐based strategy was followed, HADDOCK submitted 10/10 acceptable or better models (see again Table 1 and Supporting Information Table S1).
Lately, the use of homology models as input structures for docking is becoming more and more common, and the quality of the generated homology models can have a crucial impact on the quality of the docking models.12, 27, 28 For all unsuccessful predictions, we calculated the overall backbone RMSD (RMSDinput) of the individual starting models used for docking from the crystal structure of the respective complexes and compared those to the best docked model's i‐RMSD (Fig. 2 and Supporting Information Fig. S2). For those cases, except for T79 and T86, our starting homology models were all above 4 Å RMSDinput, with an average of 6.5 ± 3.1 Å which might explain the poor docking performance. The deviations are even larger if one only considers the interface region with an average i‐RMSDinput of 9.1 ± 1.9 Å. For the successful cases instead, the average RMSDinput is 4.2 ± 1.7 Å, which decreases to 2.8 ± 1.3 Å when considering only the interface region (see Supporting Information Fig. S2).
Figure 2.
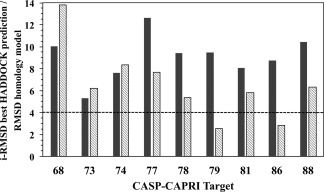
Comparison of the quality of the docked and starting homology models for the unsuccessfully predicted targets. The i‐RMSD of the best model predicted by HADDOCK (grey bars) and the overall backbone RMSD of the unbound homology model used as input structure for docking (light gray bars) are shown for those targets for which no successful HADDOCK predictions were submitted. The dashed line indicates the CAPRI 4.0 Å acceptable i‐RMSD cut‐off. For heterodimers targets (T81 and T89), the backbone‐RMSD of the worst model among the two unbound modeled proteins is reported.
CONCLUSIONS
Our performance in CASP‐CAPRI Round 1 (CAPRI Round 30) underlines the success of HADDOCK's simple but sensible prediction and scoring scheme. Our simple, physics‐based scoring function has proven robust when used blindly, with 18 successful targets out of 25 and only 1 false negative. Note that the same scoring function is also used for scoring different types of complexes, such as protein‐nucleic acid ones. This has the advantage that the same scoring scheme can be applied to diverse and mixed types of molecules, while at the same time providing physics‐based insights into the details of the energetics at the various interfaces.
Despite its excellent performance in this CASP‐CAPRI, it is clear that there is still room for improving our scoring scheme since it failed to select the best available model in most cases. As for predicting the reliability of our scoring predictions, it seems that some information is encoded in the distribution of HSs versus the overall RMSD of each model to the best‐ranked model. We indeed observed a clear funnel‐like shape only for successful targets. The absence of such funnels is however not indicative of a failure since both successful and unsuccessful predictions show such distributions. Predicting reliability in docking remains thus a highly challenging topic, which will require more systematic investigation on a large scale.
Supporting information
Supporting Information
ACKNOWLEDGMENT
The European Grid Initiative (EGI, www.egi.eu) through the national GRID Initiatives of Belgium, France, Italy, Germany, the Netherlands, Poland, Portugal, Spain, UK, South Africa, Malaysia, Taiwan, the Latin America GRID infrastructure via the Gisela project, the International Desktop Grid Federation (IDGF) with its volunteers and the US Open Science Grid (OSG) are acknowledged for the use of web portals, computing and storage facilities.
REFERENCES
- 1. Alberts B. The cell as a collection of protein machines: preparing the next generation of molecular biologists. Cell 1998;92:291–294. [DOI] [PubMed] [Google Scholar]
- 2. Vidal M, Cusick ME, Barabási A‐L. Interactome networks and human disease. J Mol Biol 2011;144:986–998. [DOI] [PMC free article] [PubMed] [Google Scholar]
- 3. Chruszcz M, Domagalski M, Osinski T, Wlodawer A, Minor W. Unmet challenges of structural genomics. Curr Opin Struct Biol 2010;20:587–597. [DOI] [PMC free article] [PubMed] [Google Scholar]
- 4. Aloy P, Russell RB. Structural systems biology: modelling protein interactions. Nat Rev Mol Cell Biol 2006;7:188–197. [DOI] [PubMed] [Google Scholar]
- 5. Janin J, Henrick K, Moult J, Eyck LT, Sternberg MJE, Vajda S, Vakser I, Wodak SJ. CAPRI: A Critical Assessment of PRedicted Interactions. Proteins 2003;52:2–9. [DOI] [PubMed] [Google Scholar]
- 6. Moult J, Fidelis K, Kryshtafovych A, Schwede T, Tramontano A. Critical assessment of methods of protein structure prediction (CASP)—round X. Proteins 2014;82:1–6. [DOI] [PMC free article] [PubMed] [Google Scholar]
- 7. Moult J, Pedersen JT, Judson R, Fidelis K. A large‐scale experiment to assess protein structure prediction methods. Proteins 1995;23:ii–iv. [DOI] [PubMed] [Google Scholar]
- 8. Dominguez C, Rolf Boelens A, Bonvin AMJJ. HADDOCK: a protein−protein docking approach based on biochemical or biophysical information. J Am Chem Soc 2003;125:1731–1737. [DOI] [PubMed] [Google Scholar]
- 9. de Vries SJ, Melquiond ASJ, Kastritis PL, Karaca E, Bordogna A, van Dijk M, Rodrigues JPGLM, Bonvin AMJJ. Strengths and weaknesses of data‐driven docking in critical assessment of prediction of interactions. Proteins 2010;78:3242–3249. [DOI] [PubMed] [Google Scholar]
- 10. de Vries SJ, van Dijk ADJ, Krzeminski M, van Dijk M, Thureau A, Hsu V, Wassenaar T, Bonvin AMJJ. HADDOCK versus HADDOCK: new features and performance of HADDOCK2.0 on the CAPRI targets. Proteins 2007;69:726–733. [DOI] [PubMed] [Google Scholar]
- 11. Lensink MF, Moal IH, Bates PA, Kastritis PL, Melquiond ASJ, Karaca E, Schmitz C, Dijk M, Bonvin AMJJ, Eisenstein M, et al. Blind prediction of interfacial water positions in CAPRI. Proteins 2014;82:620–632. [DOI] [PMC free article] [PubMed] [Google Scholar]
- 12. Rodrigues JPGLM, Melquiond ASJ, Karaca E, Trellet M, Dijk M, Zundert GCP, Schmitz C, Vries SJ, Bordogna A, Bonati L, et al. Defining the limits of homology modeling in information‐driven protein docking, Vol. 81 In: Bonvin AMJJ, Janin J, Wodak SJ, editors; 2013. pp 2119–2128. [DOI] [PubMed] [Google Scholar]
- 13. van Dijk ADJ, De Vries SJ, Dominguez C, Chen H, Zhou HX, Bonvin AMJJ. Data‐driven docking: HADDOCK's adventures in CAPRI, Vol. 60 In: Janin J, editor; 2005. pp 232–238. [DOI] [PubMed] [Google Scholar]
- 14. Jorgensen WL, Tirado‐Rives J. The OPLS [Optimized Potentials for Liquid Simulations] potential functions for proteins, energy minimizations for crystals of cyclic peptides and crambin. J Am Chem Soc 1988;110:1657–1666. [DOI] [PubMed] [Google Scholar]
- 15. Fernández‐Recio J, Totrov M, Abagyan R. Identification of protein–protein interaction sites from docking energy landscapes. J Mol Biol 2004;335:843–865. [DOI] [PubMed] [Google Scholar]
- 16. Lensink MF, Velankar S, Kryshtafovych A, Huang SY, Schneidman Duhovny D, Sali A, Segura J, Fernandez Fuentes N, Viswanath S, Elber R, et al. Prediction of homoprotein and heteroprotein complexes by protein docking and template‐based modeling. A CASP‐CAPRI experiment. Proteins 2016;84(suppl 1):323–348. [DOI] [PMC free article] [PubMed] [Google Scholar]
- 17. van Zundert GCP, Rodrigues JPGLM, Trellet M, Schmitz C, Kastritis PL, Karaca E, Melquiond ASJ, van Dijk M, De Vries SJ, Bonvin AMJJ. The HADDOCK2.2 web server: user‐friendly integrative modeling of biomolecular complexes 2016;428:720–725. [DOI] [PubMed] [Google Scholar]
- 18. Briinger AT, Adams PD, Clore GM, DeLano WL. Crystallography & NMR system: a new software suite for macromolecular structure determination. Acta Crystallogr D Biol Crystallogr 1998;54:905–921. [DOI] [PubMed] [Google Scholar]
- 19. Rodrigues JPGLM, Karaca E, Bonvin AMJJ. Information‐driven structural modelling of protein–protein interactions In: Molecular modeling of proteins. Vol. 1215 New York, NY: Springer New York; 2014. pp. 399–424; 26 p. (Methods in Molecular Biology). [DOI] [PubMed] [Google Scholar]
- 20. Rodrigues JPGLM, Trellet M, Schmitz C, Kastritis P, Karaca E, Melquiond ASJ, Bonvin AMJJ. Clustering biomolecular complexes by residue contacts similarity. Proteins 2012;80:1810–1817. [DOI] [PubMed] [Google Scholar]
- 21. Xue LC, Dobbs D, Honavar V. HomPPI: a class of sequence homology based protein‐protein interface prediction methods. BMC Bioinform 2011;12:244. [DOI] [PMC free article] [PubMed] [Google Scholar]
- 22. Kastritis PL, Bonvin AMJJ. Are scoring functions in protein−protein docking ready to predict interactomes? Clues from a novel binding affinity benchmark. J Proteome Res 2010;9:2216–2225. [DOI] [PubMed] [Google Scholar]
- 23. Xue LC, Rodrigues JPGLM, Dobbs D, Honavar V, Bonvin AMJJ. Template‐based protein–protein docking exploiting pairwise interfacial residue restraints. Brief Bioinform, 2016; pii: bbw027. [DOI] [PMC free article] [PubMed] [Google Scholar]
- 24. Schneider H‐J. Linear free energy relationships and pairwise interactions in supramolecular chemistry. Chem Soc Rev 1994;23:227–234. [Google Scholar]
- 25. Krissinel E, Henrick K. Detection of protein assemblies in crystals In: Computational life sciences, Vol. 3695 Berlin, Heidelberg: Springer Berlin Heidelberg; 2005. pp. 163–174; 12 p. (Lecture Notes in Computer Science). [Google Scholar]
- 26. Gray JJ, Moughon S, Wang C, Schueler Furman O, Kuhlman B, Rohl CA, Baker D. Protein–protein docking with simultaneous optimization of rigid‐body displacement and side‐chain conformations. J Mol Biol 2003;331:281–299. [DOI] [PubMed] [Google Scholar]
- 27. Anishchenko I, Kundrotas PJ, Tuzikov AV, Vakser IA. Protein models docking benchmark 2. Proteins 2015;83:891–897. [DOI] [PMC free article] [PubMed] [Google Scholar]
- 28. Bohnuud T, Luo L, Wodak SJ, Bonvin AMJJ, Weng Z, Vajda S, Schueler Furman O, Kozakov D. A benchmark testing ground for integrating homology modeling and protein docking. Proteins 2016; doi:10.1002/prot.25063. [DOI] [PMC free article] [PubMed] [Google Scholar]
- 29. The MathWorks, Inc . MATLAB and Statistics and Machine Learning Toolbox Release 2014b. Natick, Massachusetts, United States.
Associated Data
This section collects any data citations, data availability statements, or supplementary materials included in this article.
Supplementary Materials
Supporting Information