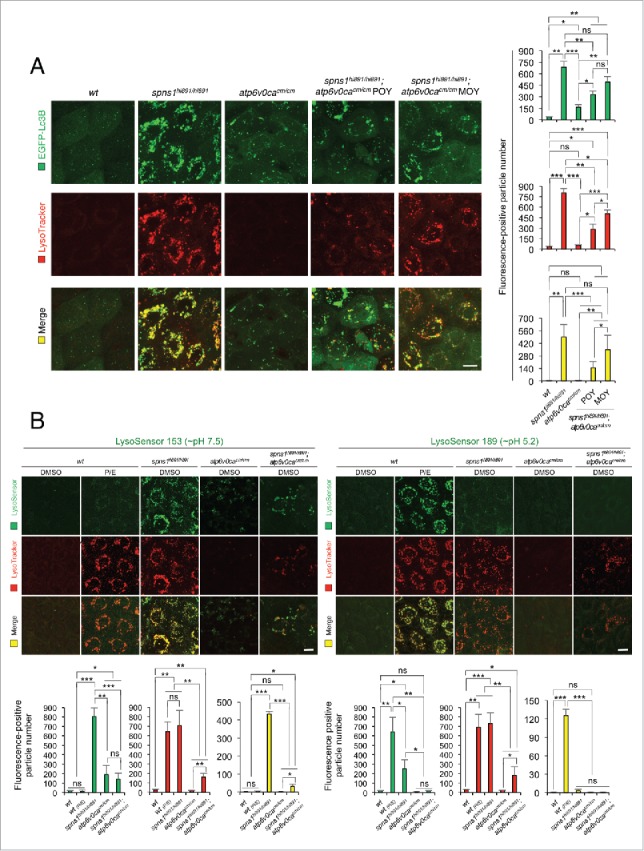
Figure 5.

Autolysosomal biogenesis with the concurrent defect of both Atp6v0ca and Spns1 in zebrafish. (A) Subsequent formation of aberrant premature autolysosomes with concurrent deficiency of both Atp6v0ca (atp6v0cacm/cm) and Spns1 (spns1hi891/hi891) in double-homozygous mutant zebrafish (atp6v0cacm/cm;spns1hi891/hi891). Scale bar: 10 µm. Quantification of the EGFP (green), LysoTracker (red) and merged (yellow) fluorescence-positive particle numbers is shown in the right graph (the number of animals for each genotype and phenotype = 9). Three independent areas (periderm or basal epidermal cells above the eye) were selected from individual animals. Error bars represent the mean ± SD, *P < 0.005, **P < 0.001, ***P < 0.0005; ns, not significant. Three independent areas (periderm or basal epidermal cells above the eye) were selected from individual animals. (B) Acidity-dependent autolysosomal biogenesis is rate limiting in spns1- and atp6v0ca-mutant animals; intracellular constituents still have insufficient acidity in the double spns1;atp6v0ca mutants. Using 2 different acidic-sensitive probes, LysoSensor Green 189 and neutral-sensitive LysoSensor Green 153 (green), in combination with LysoTracker Red (red), WT and spns1-mutant animals showed detectable signals when stained at 72 hpf. In spns1-mutant animals, autolysosomal and/or lysosomal compartments were more prominently detectable by LysoSensor Green 153 than by LysoSensor Green 189, at the cellular level with enhanced signal intensity of these enlarged compartments. In stark contrast, the cellular compartments in WT fish treated with pepstatin A and E-64-d (P/E) (12-h treatment from 60 hpf through 72 hpf) were more prominently detectable by LysoSensor Green 189 than by LysoSensor Green 153 under the identical LysoTracker-staining conditions. Scale bar: 10 µm. Quantification of the LysoSensor (green), LysoTracker (red) and merged (yellow) fluorescence-positive particle is shown in the right graph (the number (n) of animals for each genotype and phenotype = 9). Three independent areas (periderm or basal epidermal cells above the eye) were selected from individual animals. Error bars represent the mean ± SD, *P < 0.005, **P < 0.001, ***P < 0.0005; ns, not significant. Three independent areas (periderm or basal epidermal cells above the eye) were selected from individual animals.
