

ABSTRACT
Autophagy is an important antimicrobial effector process that defends against Mycobacterium tuberculosis (Mtb), the human pathogen causing tuberculosis (TB). MicroRNAs (miRNAs), endogenous noncoding RNAs, are involved in various biological functions and act as post-transcriptional regulators to target mRNAs. The process by which miRNAs affect antibacterial autophagy and host defense mechanisms against Mtb infections in human monocytes and macrophages is largely uncharacterized. In this study, we show that Mtb significantly induces the expression of MIR144*/hsa-miR-144-5p, which targets the 3′-untranslated region of DRAM2 (DNA damage regulated autophagy modulator 2) in human monocytes and macrophages. Mtb infection downregulated, whereas the autophagy activators upregulated, DRAM2 expression in human monocytes and macrophages by activating AMP-activated protein kinase. In addition, overexpression of MIR144* decreased DRAM2 expression and formation of autophagosomes in human monocytes, whereas inhibition of MIR144* had the opposite effect. Moreover, the levels of MIR144* were elevated, whereas DRAM2 levels were reduced, in human peripheral blood cells and tissues in TB patients, indicating the clinical significance of MIR144* and DRAM2 in human TB. Notably, DRAM2 interacted with BECN1 and UVRAG, essential components of the autophagic machinery, leading to displacement of RUBCN from the BECN1 complex and enhancement of Ptdlns3K activity. Furthermore, MIR144* and DRAM2 were critically involved in phagosomal maturation and enhanced antimicrobial effects against Mtb. Our findings identify a previously unrecognized role of human MIR144* in the inhibition of antibacterial autophagy and the innate host immune response to Mtb. Additionally, these data reveal that DRAM2 is a key coordinator of autophagy activation that enhances antimicrobial activity against Mtb.
KEYWORDS: AMPK, DRAM2, MIR144*, Mycobacterium tuberculosis, tuberculosis
Introduction
Autophagy is an intracellular system utilized to degrade cytoplasmic cargos sequestered by double membrane-layered autophagosomes that ultimately fuse with lysosomes.1,2 Increasing evidence has revealed that autophagy is a central element of innate immune responses against numerous intracellular pathogens.3 Mycobacterium tuberculosis (Mtb) is a major human pathogen that can survive within macrophages by evading the fusion of phagosomes with late endosomes or lysosomes.4 Autophagy activation through ubiquitin-mediated targeting of Mtb promotes the innate immune response against mycobacterial infection.5 In addition, a variety of exogenous stimuli leading to antibacterial autophagy can target Mtb and increase phagosomal maturation, thus inhibiting intracellular bacterial replication.6 To date, numerous stimuli including IFNG (interferon gamma), IL1B (interleukin 1 β), TLR (toll-like receptor) ligands, and vitamin D3 have been shown to initiate autophagy activation by targeting Mtb and promoting phagosomal acidification.7-9
MicroRNAs (miRNAs) are a growing family of small noncoding RNA molecules approximately 21 to 25 nucleotides long. miRNAs can control the expression of nearly 30% of protein-coding genes by targeting mRNA, resulting in cleavage or inhibition of translation.10,11 To investigate the specific miRNAs involved in the pathogenesis of tuberculosis (TB), several studies on mycobacterial infections analyzed miRNA expression profiles within mixed peripheral blood cells, whole lungs, and mouse models of infection.12,13 miRNAs including MIR155/hsa-miR-155 and MIR155* have been identified as potential diagnostic markers for TB (note that the asterisk signifies a biological activity for the miRNA that is generated from the opposite strand of the hairpin as the canonical miRNA).12 Another study showed that MIR144*/hsa-miR-144-5p is overexpressed in active TB patients compared with healthy controls (HCs; uninfected control donors), and that it inhibits IFNG and TNF (tumor necrosis factor) production.13 In addition, MIR21/hsa-miR-21 is upregulated in human monocytes infected with Mycobacterium leprae and inhibits the expression of genes encoding antimicrobial peptides, including CAMP (cathelicidin antimicrobial peptide) and DEFB4A (defensin β 4A).14 MIRLET7F/hsa-let-7f regulates immune responses during Mtb infection by targeting TNFAIP3 (TNF α induced protein 3), also known as A20.15 These studies provided insight into the effect of mycobacterial infections on miRNA expression patterns. However, our understanding of the role of miRNAs in modulating host defenses in TB infection and their clinical relevance is unclear.
In this study, we analyzed miRNA profiles from previous works and screened miRNAs with altered levels during human TB infection.16,17 Through our approach we found that among the 10 miRNAs upregulated during TB, MIR144* showed the strongest association with the autophagy-related DRAM2 (DNA damage-regulated autophagy modulator 2). We further characterized the unique role of MIR144* in suppressing autophagy in human primary monocytes via post-transcriptional regulation of DRAM2. DRAM2 is a lysosomal protein and member of DRAM-related proteins, which link autophagy with the tumor suppressor, TP53 (tumor protein p53; note that the mouse nomenclature is TRP53, but we use TP53 hereafter to refer to both the human and mouse genes/proteins for simplicity) OK.18 The results from our study suggest that MIR144* inhibits autophagy induced by Mtb infection and by autophagy activators, such as vitamin D3, 5-aminoimidazole-4-carboxamide ribonucleotide (AICAR), an activator of the AMPK/AMP-activated protein kinase pathway, and rapamycin, by targeting DRAM2. Importantly, we found that DRAM2 interacted with essential components of the autophagy machinery, BECN1/Beclin 1 and UVRAG (UV radiation resistance associated), leading to displacement of RUBCN (RUN and cysteine rich domain containing Beclin 1 interacting protein) from the BECN1 complex and promoting the activity of the class III phosphatidylinositol 3-kinase (PtdIns3K), whose catalytic subunit is PIK3C3/VPS34 (phosphatidylinositol 3-kinase catalytic subunit type 3). In addition, DRAM2 was required for phagosomal acidification and antimicrobial activities in human macrophages during Mtb infection. Furthermore, our data showed that MIR144* levels were elevated, and those of DRAM2 were reduced, in human peripheral blood cells and tissues in pulmonary and extrapulmonary TB, suggesting the clinical significance of MIR144*-DRAM2 in TB infection.
Results
MIR144* is induced in human macrophages by mycobacterial infection and upregulated in peripheral blood mononuclear cells (PBMCs) and tissues from patients with pulmonary and extrapulmonary TB
To evaluate the miRNA expression profiles of PBMCs from patients with pulmonary TB, we analyzed 2 miRNA microarray datasets (GSE 29190 and GSE34608) from the Gene Expression Omnibus (GEO) public database. Fourteen miRNAs in GSE 29190 were upregulated in active pulmonary TB patients compared with HCs. In addition, 180 miRNAs in GSE34608 showed increased expression levels in TB patients compared with HCs. Therefore, only 10 miRNAs were upregulated in the 2 microarray data sets (Fig. 1A). The heatmap revealed that MIR144* showed the greatest magnitude of upregulation among the 10 miRNAs (Fig. 1B). Previous studies showed that MIR144* is upregulated in the PBMCs of active pulmonary TB patients.13 In addition, we compared the expression of MIR144* in PBMCs from active pulmonary TB patients and HCs. The expression levels of MIR144* were significantly higher in PBMCs from active pulmonary TB patients than in HCs (Fig. 1C).
Figure 1.
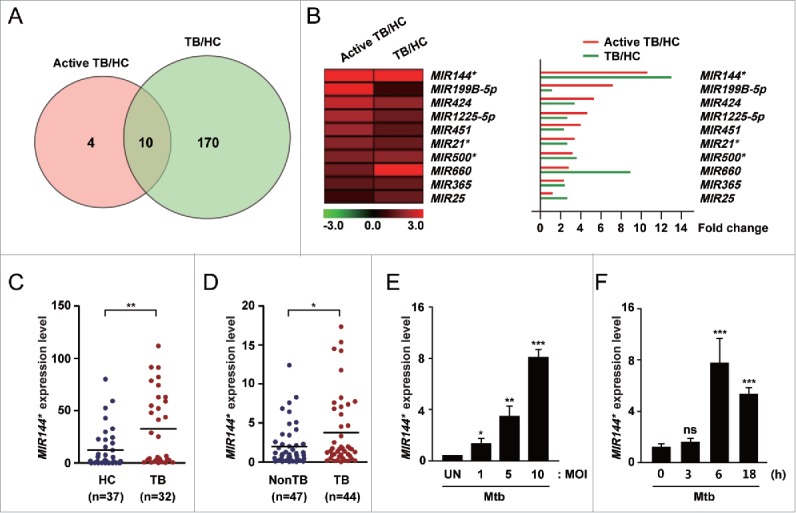
Mtb infection upregulates the expression of MIR144* in human MDMs and in TB patients. (A) Venn diagram showing the distribution of differentially upregulated miRNAs between TB patients and healthy controls (HCs) from the GEO public databases (GSE 29190 and GSE34608). (B) (Left) Heatmap analysis displaying raw data. (Right) Fold change was calculated by dividing the average signal intensity of TB patients by that of HCs. (C) Human PBMCs were isolated from HCs (n = 37) and TB patients (n = 32). Expression levels of MIR144* were determined by real-time PCR. (D) Real-time PCR analysis of MIR144* expression in disease sites from nonTB controls (NonTB; n = 47) and from pulmonary and extrapulmonary TB patients (TB; n = 44). (E and F) Human MDMs were infected with Mtb at the indicated MOIs for 6 h (E) or at an MOI of 10 for the indicated times (F). Experiments were performed 3 times and data are presented as means ± SD. *P < 0.05, **P < 0.01 and ***P < 0.001, compared with the uninfected control (E and F). UN, uninfected control; TB, tuberculosis; HCs, healthy controls; ns, not significant.
Although previous studies have published different miRNA expression profiles in the peripheral blood and immune cells of TB patients,13,16,19 little is known about the expression profiles in disease sites such as the lungs and lymph nodes. Therefore, we examined the MIR144* expression levels in disease sites (e.g., lungs and lymph nodes) obtained from biopsies from TB patients. In addition, MIR144* expression was upregulated in samples collected from disease sites in pulmonary and extrapulmonary TB patients compared with nonTB controls (Fig. 1D). Using a real-time polymerase chain reaction (PCR) assay, we found that MIR144* expression was upregulated in human monocyte-derived macrophages (MDMs) after infection with Mtb in a multiplicity of infection (MOI)-dependent manner (Fig. 1E; at 6 h of infection). We then performed further kinetic experiments at an MOI of 10, which showed the greatest induction of MIR144* after Mtb infection. Notably, the expression of MIR144* was significantly increased (by approximately 8-fold) in human MDMs at 6 h after Mtb infection (Fig. 1F). Similarly, a MOI- or time-dependent increase in MIR144* expression was detected in human MDMs after infection with other mycobacterial strains: Mycobacterium bovis-Bacillus Calmette-Guérin (BCG), Mtb H37Ra, and Mycobacterium abscessus (Fig. S1A to F). Furthermore, Mtb infection of THP-1 human monocytic cells upregulated MIR144* expression in time- and MOI-dependent manners (Fig. S2A and B). These data indicate that MIR144* expression is robustly increased in human MDMs following mycobacterial infection, and that MIR144* levels are upregulated in PBMCs/tissues from TB patients compared with HCs.
DRAM2 is a direct target of MIR144*
To identify the mechanism(s) underlying the role of MIR144* in modulating host defenses in Mtb infection, we used computational target prediction tools miRanda (http://www.microrna.org/microrna/home.do), Targetscan (http://www.targetscan.org), and DIANA-microT (http://diana.cslab.ece.ntua.gr/microT/). More specifically, these tools identified potential target(s) involved in autophagy, an important antimycobacterial innate immune response.20 Bioinformatic analysis identified 4 putative autophagy-related genes encoding DRAM2, LAMP2 (lysosomal-associated membrane protein 2), ATG16L2 (autophagy-related 16 like 2), and ATG2A (autophagy-related 2A) as MIR144* targets.
To reduce the number of putative target genes, we utilized several search tools. DRAM2 had the best mirSVR score (Table S1; score = −2.52), which represents the efficiency of the miRNAs and miRanda-predicted target binding sites.21 In addition, several studies have considered the energetic specificity between target mRNA and miRNAs.22,23 Therefore, we determined the free energy (ΔG) of the 70 nucleotides flanking the 5′ and 3′ ends of the predicted miRNA binding sites.24 According to the Unified Nucleic Acid Folding (UNAFold) and hybridization package (http://www.bioinfo.rpi.edu/applications/), the predicted human DRAM2 site had the greatest ΔG among the autophagy-related targets (Table S2; ΔG = −7.54 kcal/mol). DRAM2 mRNA contains 3 MIR144*-binding sites in its 3′ untranslated region (3′ UTR) (Fig. 2A). Since MIR144* is predicted to target DRAM2, we evaluated the effect of MIR144* on DRAM2 protein expression. The MIR144* mimic inhibited DRAM2 mRNA and DRAM2 protein expression, while the MIR144* inhibitor enhanced expression in human primary monocytes (Fig. 2B and C, for mRNA and protein, respectively). Neither the vehicle control nor the mimic or inhibitor control affected DRAM2 mRNA or DRAM2 protein levels in human monocytes (Fig. 2B and C). The transfection efficiency of the MIR144* mimic and inhibitor in human primary monocytes was confirmed by real-time PCR (Fig. S3A and S3B). High levels of MIR144* were detected in human monocytes at 6 h post-transfection with the MIR144* mimic, and the levels remained elevated 48 h after transfection (data not shown). Since several candidate genes are potential targets of MIR144*, we examined the effect of MIR144* on LAMP2, ATG16L2, and ATG2A mRNA levels in human primary monocytes. As shown in Figure S4, the MIR144* mimic or inhibitor substantially affected LAMP2, but not ATG16L2 or ATG2A, mRNA levels in human primary monocytes. In addition, DRAM1 mRNA levels were not modulated by transfection of a MIR144* mimic or inhibitor in human monocytes (Fig. 2D). These data suggest LAMP2 to be another target of MIR144*, and that ATG16L2, ATG2A, and DRAM1 may not be true targets of MIR144*.
Figure 2.
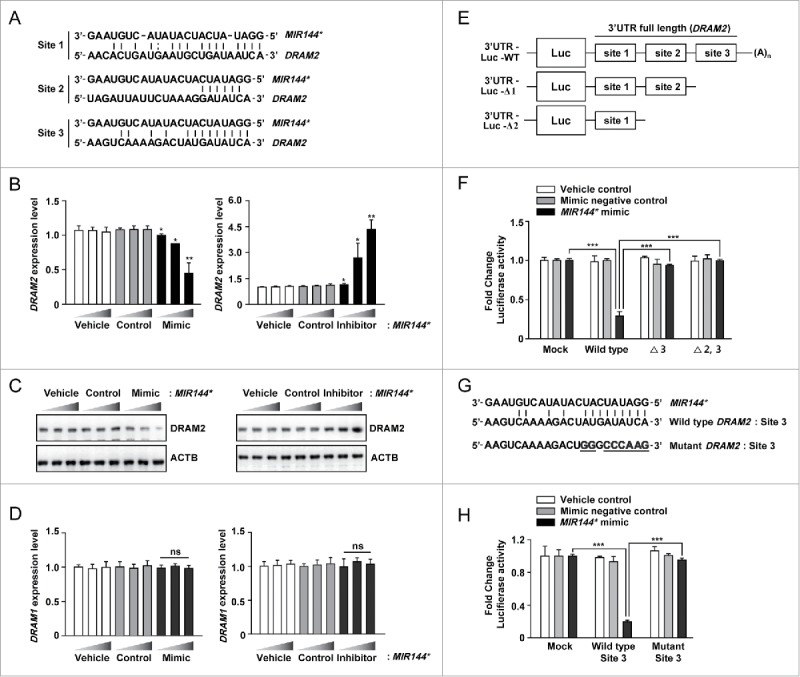
DRAM2 is a target of MIR144*. (A) Three MIR144* binding sequences located in the DRAM2 3′ UTR. (B) Human primary monocytes were transfected with vehicle control; mimic negative control or MIR144* mimic (10, 20, and 50 nM); inhibitor negative control or MIR144* inhibitor (50, 100, and 150 nM) for 24 h. Expression levels of DRAM2 were determined by real-time PCR. (C) Human primary monocytes were transfected with vehicle control; mimic negative control (50 nM) or MIR144* mimic (10, 20, and 50 nM); inhibitor negative control (150 nM) or MIR144* inhibitor (50, 100, and 150 nM) for 24 h. DRAM2 protein levels were determined by immunoblotting. (D) Human primary monocytes were transfected with vehicle control; mimic negative control or MIR144* mimic (10, 20, and 50 nM); inhibitor negative control or MIR144* inhibitor (50, 100, and 150 nM) for 24 h. Expression levels of DRAM1 were determined by real-time PCR. (E) Schematic representation of the 3 MIR144*-binding sites in the DRAM2 3′ UTR construct (full length; WT, wild type) and generation of deletion constructs (Δ3, deletion of site 3; Δ2,3, deletion of sites 2 and 3). (F) THP-1 cells were cotransfected with vehicle control, mimic negative control, or MIR144* mimic (50 nM) and a series of luciferase reporter constructs (pmirGLO vector (mock), wild type, Δ3 and Δ2,3), which were incubated for 24 h. Luciferase assays were conducted to assess MIR144* targeting of the DRAM2 3′ UTR. (G) Nucleotide alignments among the MIR144* seed sequence, site 3, and mutated sequences 3′ UTR of DRAM2 cloned into pmirGLO vectors. (H) THP-1 cells were cotransfected with pmirGLO vector (mock) carrying site 3 or mutant constructs in addition to the vehicle control, mimic negative control, or MIR144* mimic (50 nM). Following cotransfection, luciferase assays were performed. Experiments were performed 3 times, and data were presented as means ± SD. *P < 0.05, **P < 0.01 and ***P < 0.001, compared with the vehicle control (B and D). ns, not significant.
To investigate whether MIR144* directly regulates DRAM2, we subcloned a series of DRAM2 deletion constructs into the pmirGLO vector (deletion of the DRAM2 3′ UTR targeting site 3 [Δ3] and sites 2 and 3 [Δ2,3]) (Fig. 2E). Constructs harboring the wild-type (WT) or the mutant DRAM2 3′ UTR (Fig. 2E; mock, WT, Δ3, or Δ2,3) were cotransfected with the vehicle control, mimic negative control, or MIR144* mimic into human monocytic THP-1 cells, and luciferase activity was measured. Overexpression of MIR144* significantly attenuated luciferase activity driven by the full-length DRAM2 3′ UTR (WT) construct, while the mutant constructs were unresponsive to MIR144* mimic transfection (Fig. 2F). In addition, no repression of luciferase activity was observed upon overexpression of the vehicle controls or mimic negative controls in THP-1 cells (Fig. 2F). Transfection of THP-1 cells with the MIR144* mimic increased MIR144* levels in a dose-dependent manner (Fig. S5A), while transfection with a MIR144* inhibitor decreased MIR144* levels in a dose-dependent manner (Fig. S5B). These results suggest that the DRAM2 3′ UTR targeting site 3 is a likely MIR144* recognition site.
To validate the binding specificity of DRAM2 3′ UTR site 3, we designed a construct containing mutated MIR144* binding sequences within site 3 (mutant site 3) using PCR-mediated mutagenesis in which we replaced 8 nucleotides by a constant linker sequence (Fig. 2G). These constructs were cotransfected with the vehicle control, mimic negative control, or MIR144* mimic in THP-1 cells, and luciferase activity was measured. As shown in Figure 2H, overexpression of MIR144* markedly repressed luciferase activity in cells transfected with constructs containing the WT site 3, but showed no inhibition in the mutant construct. These results demonstrate that MIR144* affects DRAM2 expression by directly binding to and targeting the 3′ UTR region of DRAM2.
DRAM2 expression is decreased by Mtb infection in human macrophages and in disease samples from tuberculosis patients
To examine the effects of MIR144* upon DRAM2 expression during mycobacterial infection, we first evaluated whether Mtb infection modulates the DRAM2 mRNA and protein levels of DRAM2 in human MDMs. As shown in Figure 3A and B, Mtb infection led to reduced DRAM2 mRNA and protein levels of DRAM2 in human MDMs in a time-dependent manner. We then examined whether MIR144* is involved in the modulation of DRAM2 expression in human MDMs during Mtb infection. Since the basal DRAM2 mRNA and protein levels of DRAM2 were markedly decreased after 3 h of Mtb infection (Fig. 3A and B), we assessed the effects of the MIR144* mimic and inhibitor on the DRAM2 protein level, at early (up to 6 h) and late (at 24 h) time points, respectively, after Mtb infection (MOI of 10). As shown in Figure 3C and D, MIR144* overexpression decreased DRAM2 protein levels (up to 6 h), whereas transfection of human MDMs with a MIR144* inhibitor significantly increased DRAM2 protein levels (at 24 h), before and after Mtb infection, compared with the corresponding control conditions.
Figure 3.
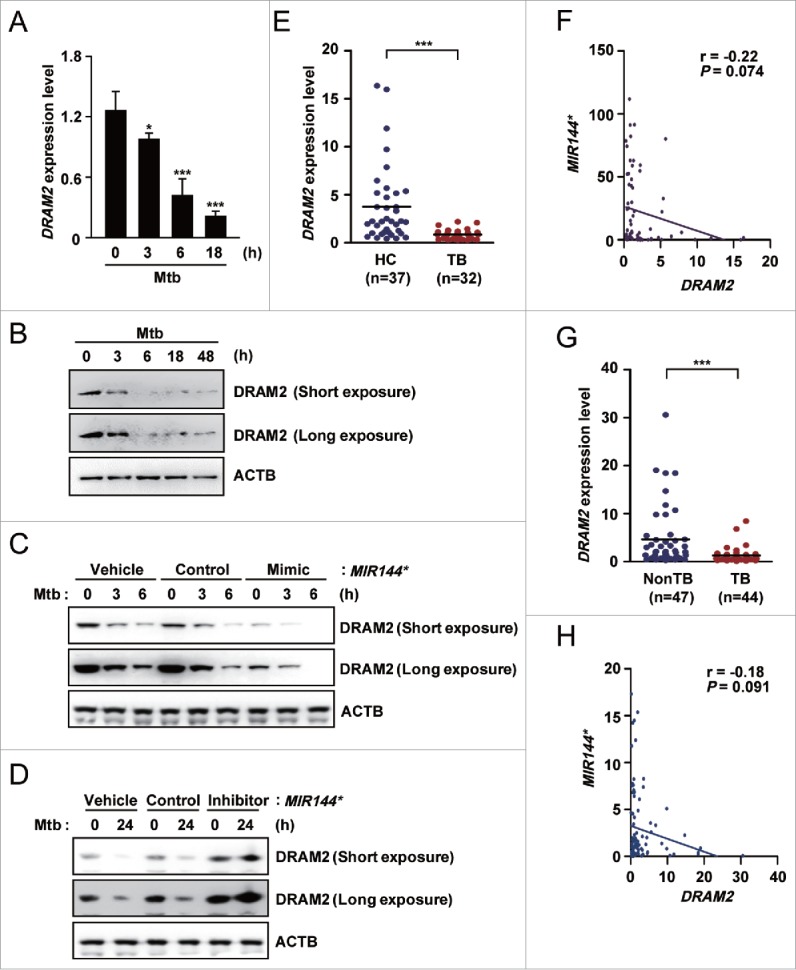
DRAM2 expression is downregulated by Mtb infection in human macrophages and in disease samples from tuberculosis patients. (A and B) Human MDMs infected with Mtb (MOI of 10) for the indicated times. (A) DRAM2 mRNA levels were determined by real-time PCR. (B) DRAM2 protein levels were evaluated by immunoblotting. (C and D) Human MDMs were transfected with vehicle control; mimic negative control or MIR144* mimic (50 nM for C); inhibitor negative control or MIR144* inhibitor (150 nM for D) for 24 h and then infected with Mtb for 3, 6 (C) or 24 h (D). DRAM2 protein levels were then determined by immunoblotting. (E) Human PBMCs were isolated from HCs (n = 37) and TB patients (n = 32). Expression levels of DRAM2 were determined by real-time PCR. (F) Correlation of the expression of MIR144* and DRAM2 by Pearson regression in PBMCs from HCs and TB patients (Pearson r = −0.22, P = 0.074). (G) Real-time PCR analysis of DRAM2 expression in disease sites from nonTB controls (NonTB; n = 47) and disease sites from pulmonary and extrapulmonary TB patients (TB; n = 44). (H) Correlation of MIR144* and DRAM2 expression by Pearson regression in tissues from HCs and TB patients (Pearson r = −0.18, P = 0.091). Experiments were performed 3 times, and data are presented as means ± SD. *P < 0.05 and ***P < 0.001, compared with untreated control (A). TB, tuberculosis patients; HCs, healthy controls.
Because MIR144* levels were upregulated in PBMCs from TB patients compared with those from HCs, we further assessed DRAM2 expression in PBMCs from TB patients (n = 37) and HCs (n = 32) using real-time PCR (same specimen as shown in Fig. 1D). As shown in Figure 3E, DRAM2 expression levels were significantly reduced in PBMCs from pulmonary TB patients compared with those from HCs. Spearman correlation coefficients revealed an inverse relationship between the levels of MIR144* and DRAM2 in PBMCs from HCs and TB patients (r = −0.22, P = 0.074; Fig. 3F). In addition, DRAM2 expression was reduced in disease sites from pulmonary and extrapulmonary TB patients, compared with those from nonTB controls (Fig. 3G). There was also an inverse relationship between the levels of MIR144* and DRAM2 in tissues from TB patients and nonTB controls (r = −0.18, P = 0.091; Fig. 3H). Collectively, these data suggest that mycobacterial infection suppresses the levels of DRAM2, which is targeted by MIR144*. In addition, DRAM2 expression was significantly decreased in PBMCs and tissues from pulmonary and extrapulmonary TB patients compared with those from controls.
Autophagy activators upregulate, but MIR144* downregulates, DRAM2 expression in human monocytes
Since endogenous DRAM2 protein levels were decreased by Mtb infection, we evaluated which signals upregulated DRAM2 expression in monocytes. Since previous studies support a role for DRAM2 in autophagy,25,26 we treated human primary monocytes with various autophagy inducers, including vitamin D3, rapamycin, and the PRKAA1/2/AMPKα (protein kinase AMP-activated catalytic subunit α) activator AICAR.27,28 All of these compounds robustly enhanced DRAM2 mRNA and DRAM2 protein levels in monocytes (Fig. 4A and B; Fig. S6A and B). Since both AICAR and vitamin D3 are strong activators of the AMPK pathway,27,28 we further examined the role of PRKAA in the induction of DRAM2 expression in response to these compounds. As shown in Figure 4C and D, silencing PRKAA1/2 using a specific lentiviral short hairpin RNA (shRNA; shPRKAA) led to marked inhibition of DRAM2 mRNA and DRAM2 protein expression in human monocytes before and after treatment with AICAR and vitamin D3. These data collectively indicate that PRKAA activation is involved in the induction of DRAM2 expression in human monocytes.
Figure 4.
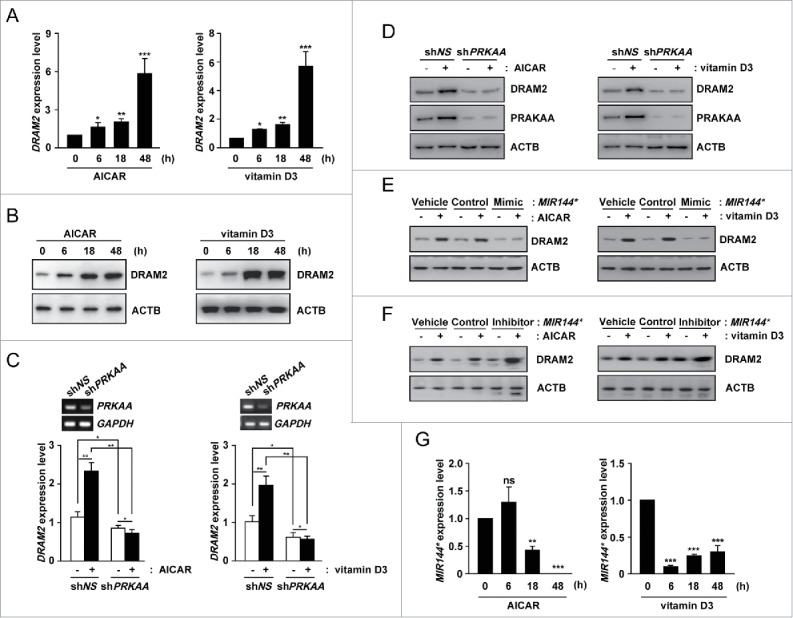
Autophagy activators upregulate and MIR144* downregulates DRAM2 levels in human primary monocytes. (A and B) Human primary monocytes were treated with AICAR (0.5 mM) or vitamin D3 (20 nM) for the indicated times. (A) DRAM2 mRNA levels were determined by real-time PCR. (B) DRAM2 protein levels were examined by immunoblotting. (C and D) Human primary monocytes were transduced with lentivirus expressing nonspecific shRNA (shNS) or shRNA specific for PRKAA1/2 (shPRKAA) using polybrene (8 μg/ml). After 36 h, human primary monocytes were treated with or without AICAR (0.5 mM) or vitamin D3 (20 nM). (C) (Top) Semiquantitative PCR analysis was performed to assess transduction efficiency. (Bottom) DRAM2 mRNA levels were determined by real-time PCR. (D) DRAM2 protein levels were evaluated by immunoblotting. (E and F) Human primary monocytes were transfected with vehicle control; mimic negative control or MIR144* mimic (50 nM for E); inhibitor negative control or MIR144* inhibitor (150 nM for F) for 24 h and then treated with or without AICAR (0.5 mM) or vitamin D3 (20 nM). DRAM2 protein levels were examined by immunoblotting. (G) Human primary monocytes were treated with AICAR (0.5 mM) or vitamin D3 (20 nM) for the indicated times. Expression levels of MIR144* were determined by real-time PCR. Experiments were performed 3 times, and data are presented as means ± SD. *P < 0.05, **P < 0.01 and ***P < 0.001, compared with the untreated control (A, G). ns, not significant.
In addition, the effects of MIR144* in human monocytes following induction of DRAM2 protein expression by autophagy stimulators were investigated. To examine this, we transfected human monocytes with a MIR144* mimic or inhibitor and measured DRAM2 expression. Overexpression of MIR144* decreased DRAM2 protein levels in human monocytes following treatment with AICAR, vitamin D3, and rapamycin, as measured by immunoblot analysis (Fig. 4E; Fig. S7A). In contrast, transfection of cells with the MIR144* inhibitor significantly increased the expression of DRAM2 in human monocytes regardless of treatment with autophagy stimulators, compared with the vehicle control or inhibitor control (Fig. 4F; Fig. S7B). MIR144* levels were also markedly decreased in human primary monocytes following treatment with AICAR, vitamin D3, and rapamycin (Fig. 4G; Fig. S7C). Moreover, shPRKAA transduction into human monocytes counteracted the AICAR-mediated inhibition of MIR144* expression (Fig. S8), suggesting that PRKAA activation is involved in AICAR-mediated inhibition of MIR144* levels. Collectively, these data suggest that autophagy stimulators increase the expression of DRAM2, which is regulated by MIR144* and activation of the PRKAA pathway.
MIR144* affects autophagy activation in human monocytes in response to various autophagy stimulators
The possibility that MIR144* modulates autophagy activation is intriguing considering the proposed role of DRAM2 in mediating autophagy.25,26 We first confirmed our previous reports that both AICAR and vitamin D3 induce autophagy in primary monocytes27,28 by measuring the levels of cleaved and lipidated MAP1LC3/LC3 (microtubule-associated protein 1 light chain 3; LC3-II). As shown in Figure 5A, treatment of human monocytes with AICAR or vitamin D3 led to an increase in the LC3-II:LC3-I ratio in a time-dependent manner, indicating that these reagents robustly activated autophagosome formation. To further assess whether MIR144* affects autophagy activation in response to AICAR or vitamin D3, we overexpressed the MIR144* mimic and inhibitor in human primary monocytes. Transfection of the MIR144* mimic significantly inhibited the amount of LC3-II in human primary monocytes in the presence of AICAR and vitamin D3, compared with the mimic negative control (Fig. 5B). In contrast, inhibition of MIR144* levels by transfection of the MIR144* inhibitor significantly enhanced the ratio of LC3-II:LC3-I in human monocytes in the presence or absence of AICAR or vitamin D3, compared with the inhibitor negative control (Fig. 5C). Furthermore, our results showed that overexpression of MIR144* strongly attenuated LC3 punctate structure formation in monocytes, whereas inhibition of MIR144* enhanced the formation of these structures, in response to AICAR or vitamin D3 treatment (Fig. 5D and E). There was no significant difference in autophagosome formation between the vehicle control and the mimic or inhibitor negative controls in human monocytes in the presence or absence of autophagy inducers (Fig. 5E).
Figure 5.
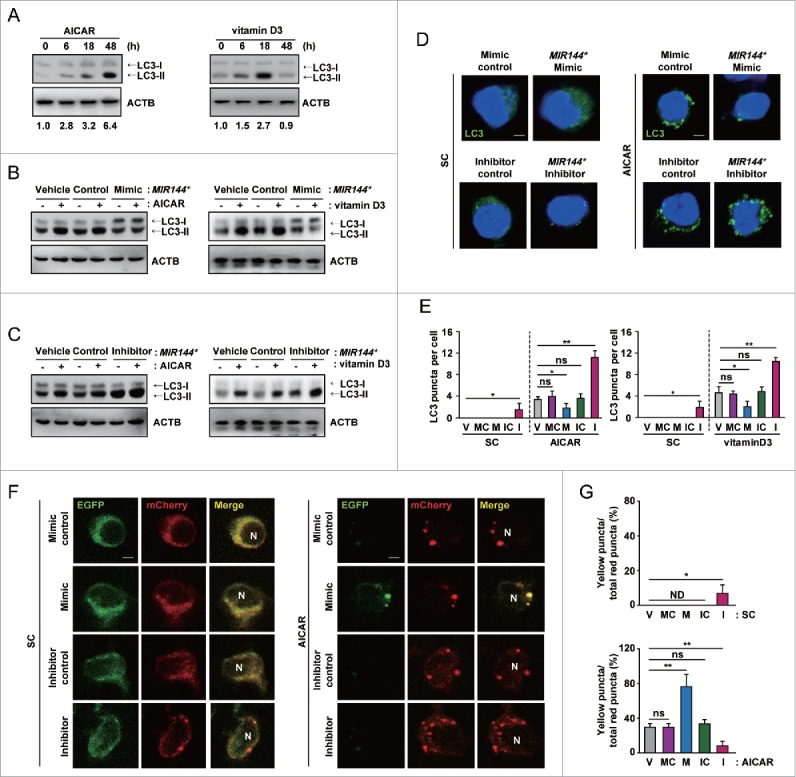
MIR144* inhibits autophagy induction and autophagic flux in human primary monocytes. (A) Human primary monocytes were treated with AICAR (0.5 mM) or vitamin D3 (20 nM) for the indicated times. (B and C) Human primary monocytes were transfected with vehicle control; mimic negative control or MIR144* mimic (50 nM for B); inhibitor negative control or MIR144* inhibitor (150 nM for C) for 24 h and then treated with AICAR (0.5 mM) or vitamin D3 (20 nM) for 24 h. (A to C) LC3 protein levels were determined by immunoblotting. (D) Human primary monocytes were transfected with mimic negative control or MIR144* mimic (50 nM); inhibitor negative control or MIR144* inhibitor (150 nM) for 24 h following treatment without (left) or with AICAR (0.5 mM) (right) for 24 h and then fixed and stained with anti-LC3 (Alexa Fluor 488; green) to detect LC3 punctate. Scale bars: 5 μm. (E) Quantitative data of LC3 punctate analysis. (F) Human monocytes were transduced with a retrovirus expressing a tandem LC3B plasmid (mCherry-EGFP-LC3B) for 24 h. Cells were then transfected with mimic negative control or MIR144* mimic (50 nM); inhibitor negative control or MIR144* inhibitor (150 nM) for 24 h, followed by treatment without (left) or with AICAR (0.5 mM) (right) for 24 h. Cells were fixed, and LC3 was analyzed by confocal microscopy. Scale bars: 5 μm. (G) Quantification of yellow puncta/total red puncta (%) per cell. Experiments were performed 3 times, and data are presented as means ± SD. *P < 0.05 and **P < 0.01. V, vehicle control; MC, mimic negative control; M, MIR144* mimic; IC, inhibitor negative control; I, MIR144* inhibitor; N, nucleus; ns, not significant; SC, solvent control; ND, not detected.
The role of MIR144* in autophagy activation was also assessed in THP-1 cells using immunoblotting. Autophagy activators enhanced the LC3-II:LC3-I ratios in THP-1 cells in a time-dependent manner (Fig. S9A), similar to the effect seen when human primary monocytes were treated with these reagents. THP-1 cells transfected with the MIR144* mimic significantly inhibited the induction of LC3-II levels in response to AICAR and vitamin D3 (Fig. S9B), whereas the MIR144* inhibitor induced LC3-II levels (Fig. S9C), compared with the corresponding mimic or inhibitor negative control. Next, we examined whether MIR144* influences classical autophagy activation in THP-1 cells. THP-1 cell treatment with the classical autophagy inducer rapamycin resulted in autophagy activation in a time-dependent manner (Fig. S10A). Transfection of THP-1 cells with the MIR144* mimic downregulated the ratio of LC3-II:LC3-I, whereas MIR144* inhibitor transfection upregulated this ratio, in the presence or absence of rapamycin (Fig. S10B and C).
Next, we performed an autophagic flux assay29 to assess the effect of MIR144* on AICAR-induced autophagic flux. To monitor autophagic flux in primary cells, we generated a retroviral vector containing a mCherry-enhanced green fluorescent protein (EGFP)-LC3B plasmid and transduced it into human primary monocytes. Cells treated with AICAR showed an increase in both yellow and red puncta, suggesting that mCherry-EGFP-LC3B is delivered to lysosomes following AICAR treatment (Fig. 5F and G). Overexpression of human primary monocytes with the MIR144* mimic increased only the yellow puncta, suggesting that MIR144* mimic prevents autophagosomal maturation into an autolysosome. However, transfection of human primary monocytes with the MIR144* inhibitor upregulated red puncta, demonstrating that the MIR144* inhibitor increases autophagic flux (Fig. 5F and G). Collectively, these data indicate that MIR144* overexpression blocks AICAR-induced autophagic flux in human monocytes, and that MIR144* plays a role in the inhibition of autophagy induction and autophagic flux.
DRAM2 interacts with essential autophagy proteins, including BECN1, UVRAG, LAMP1, and LAMP2
Autophagy initiation is regulated by several ATGs/autophagy-related genes with functionally distinct roles. During the early stage of autophagy activation, ULK1 (unc-51 like autophagy activating kinase 1) and BECN1-PtdIns3K activate downstream signaling to ATG conjugation cascades, which includes the ATG12–ATG5-ATG16L1 assembly and lipidated members of the LC3 and GABARAP subfamilies.30 Considering that these proteins are involved in the formation of autophagosomes,31,32 we hypothesized that DRAM2 physically interacts with the proteins involved in autophagosome formation, providing a potential activation signal for autophagy induction. To test this, we cotransfected 293T cells with plasmids expressing DRAM2 and various flag-constructs (BECN1, ATG16L1, ATG3, and RUBCN) and lysed cells at 48 h post-transfection. We immunoprecipitated DRAM2 using monoclonal antibodies against hemagglutinin (HA) and then performed immunoblotting to test for the presence of other proteins involved in autophagy activation or inhibition. As shown in Figure 6A, DRAM2 coimmunoprecipitated with BECN1 and UVRAG in the cotransfected cells, but not in the cells containing empty vector or other construct-transfected cells. Similar results were obtained from coimmunoprecipitation (IP) of endogenous proteins from human monocytes (Fig. 6B). AICAR treatment of human primary monocytes led to a time-dependent increase in the interaction of DRAM2 with BECN1 and UVRAG. Importantly, LAMP1 and LAMP2 also coimmunoprecipitated with DRAM2 in human monocytes after AICAR treatment (Fig. 6B). The confocal microscopy results corroborated those of the coIP; i.e., that BECN1 colocalization with endogenous DRAM2 was increased in human primary monocytes in response to AICAR treatment (Fig. 6C). In addition, BECN1 protein was diffusely localized in GFP vector control-transfected THP-1 cells. In GFP-DRAM2-overexpressing THP-1 cells, the proportion of GFP/BECN1 (yellow) (+) THP-1 cells was significantly increased compared with GFP-control-transfected cells (Fig. S11), suggesting that DRAM2 expression drives BECN1 localization in punctate structures in macrophages. We further showed that AICAR treatment led to a marked increase in colocalization of DRAM2 and LAMP2 in human primary monocytes in a time-dependent manner (Fig. S12A and B). Collectively, these findings indicate that DRAM2 physically interacts with crucial factors of the autophagic machinery, i.e., BECN1, UVRAG, and the lysosomal proteins LAMP1 and LAMP2.
Figure 6.
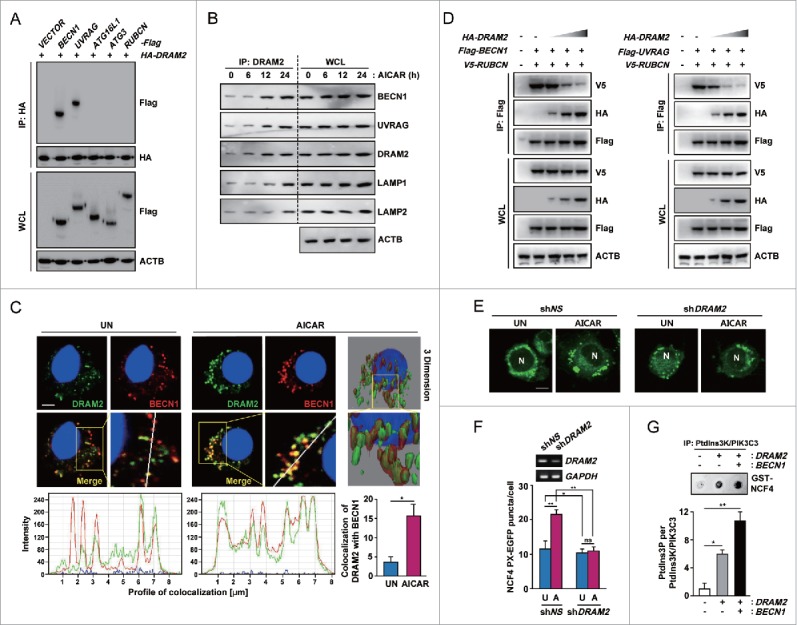
DRAM2 interacts with essential autophagy proteins including BECN1 and UVRAG. (A) 293T cells were cotransfected with HA-DRAM2 and Flag version of BECN1, UVRAG, ATG16L1, ATG3 or RUBCN. After 48 h, cells were subjected to immunoprecipitation with an anti-HA, followed by immunoblotting using an anti-Flag. WCLs were used for immunoblotting with anti-HA, anti-Flag or anti-ACTB. (B) Human monocytes were incubated with AICAR (0.5 mM) for the indicated times and subjected to immunoprecipitation with an anti-DRAM2, followed by immunoblotting with anti-BECN1, anti-UVRAG, anti-DRAM2, anti-LAMP1, anti-LAMP2 and anti-ACTB. (C) Human monocytes were treated without or with AICAR (0.5 mM) for 24 h. (Top) Cells were stained with anti-DRAM2 (Alexa Fluor 488; green) and anti-BECN1 (Alexa Fluor 594; red). Cells were visualized by confocal microscopy and 3-dimensional image analysis. (Bottom) Quantitative data (right) and tracing of DRAM2 and BECN1 colocalization (left). Scale bars: 2 μm. (D) 293T cells were cotransfected with Flag-BECN1 and V5-RUBCN (Left) or Flag-UVRAG and V5-RUBCN (Right), together with increasing amounts of HA-DRAM2, and subjected to IP using an antibody for Flag, followed by immunoblotting analysis with antibodies for V5, HA, Flag, and ACTB. (E) THP-1 cells were transduced with lentivirus expressing shNS or shDRAM2 using polybrene (8 μg/ml). After 36 h, cells were transfected with the NCF4 PX-EGFP plasmid for 24 h and then incubated with or without AICAR (0.5 mM) for 24 h. NCF4 PX-EGFP puncta formation was analyzed by confocal microscopy. Scale bars: 5 μm. (F) (Top) Semiquantitative PCR analysis was performed to assess transduction efficiency. (Bottom) Quantitation of the number of NCF4 PX-EGFP puncta per cell. (G) (Top) A representative image of the in vitro kinase assay. THP-1 cells were cotransfected with the empty vector, HA-DRAM2, together with the Flag-BECN1 construct. An in vitro kinase assay was conducted as described in Materials and Methods. (Bottom) Graph representation of 2 independent experiments. Experiments were performed 3 times, and data are presented as means ± SD. *P < 0.05 and **P < 0.01. WCL, whole-cell lysate; N, nucleus; UN, untreated control (C and E); U, untreated control (F); A, AICAR; ns, not significant.
The interaction between DRAM2 and the BECN1 complex leads to displacement of RUBCN from the BECN1 complex and promotes PtdIns3K activity
RUBCN is an autophagy inhibitor and a subunit of the BECN1-UVRAG-PtdIns3K autophagy complex.33-35 We further examined whether DRAM2 overexpression displaces RUBCN from the BECN1 complex and promotes PtdIns3K activity. Competition assays using DRAM2 constructs demonstrated that increased levels of DRAM2 diminished the interaction between RUBCN and BECN1 or UVRAG in 293T cells (Fig. 6D). Because the interaction of RUBCN with the BECN1-UVRAG complex blocks PtdIns3K lipid kinase activity,35 we next examined whether the expression of DRAM2 affects the enzymatic activity of PtdIns3K.
To examine this, we first conducted image analysis using the EGFP fused to the NCF4 (neutrophil cytosolic factor 4) PX domain, which binds to phosphatidylinositol 3-phosphate (PtdIns3P) produced by Ptdlns3K lipid kinase, for the measurement of intracellular PtdIns3P levels.36,37 As shown in Figure 6E and F, AICAR-mediated NCF4 PX-EGFP puncta formation was significantly decreased in human monocytes transduced with a shRNA specific for DRAM2 (shDRAM2) compared with that in nonspecific shRNA (shNS)-transduced cells. To confirm the DRAM2-induced increase in Ptdlns3K enzymatic activity, we overexpressed DRAM2 and then measured the effects on Ptdlns3K activity using an in vitro lipid kinase assay.37 As shown in Figure 6G, DRAM2 overexpression in THP-1 cells significantly increased Ptdlns3K enzymatic activity, compared with the control condition. In addition, coexpression of DRAM2 and BECN1 amplified Ptdlns3K activity, indicating that the interaction between DRAM2 and BECN1 markedly increases Ptdlns3K activity. These data collectively indicate that the interaction between DRAM2 and BECN1 is critical for the displacement of RUBCN from the BECN1 complex and promotion of Ptdlns3K activity.
DRAM2 is required for autophagy activation, phagosomal maturation, and suppression of intracellular mycobacterial growth in human macrophages
Recent studies have shown that DRAM2 expression is required for induction of autophagy;26 however, little is known regarding which step(s) of autophagy activation in human immune cells DRAM2 is involved. To investigate this, we knocked down DRAM2 using shDRAM2 and evaluated formation of the autophagosome in human primary monocytes after treatment with AICAR or vitamin D3. Silencing of DRAM2 significantly reduced AICAR- and vitamin D3-induced LC3autophagosome formation in primary monocytes and THP-1 cells (Fig. 7A, B and data not shown). In addition, we investigated LC3-II expression in response to various autophagy activators. Consistent with the confocal analysis findings, silencing of DRAM2 led to marked inhibition of the LC3-II:LC3-I ratio in AICAR- and vitamin D3- treated human primary monocytes (Fig. 7C). In addition, overexpression of THP-1 cells with DRAM2 led to increases in the LC3-II:LC3-I ratio (Fig. 7D) and the number of LC3 puncta (Fig. 7E), compared with mock vector-transfected cells. We further examined whether DRAM2 expression is essential for autophagy maturation. As shown in Figure 7F, silencing of DRAM2 in human primary monocytes led to a marked inhibition of LC3 colocalization with LAMP2 in response to AICAR, suggesting an essential role for DRAM2 in autophagic maturation.
Figure 7.
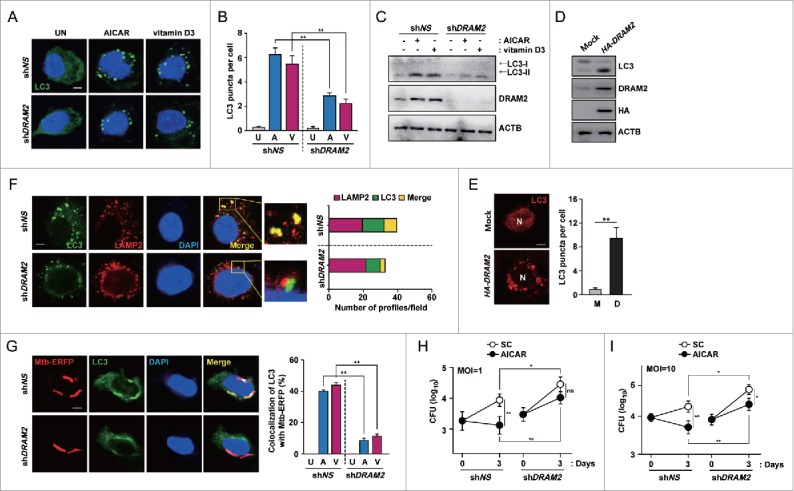
DRAM2 activates autophagy induction and maturation in response to autophagy activators. (A to C) Human primary monocytes were transduced with lentivirus expressing shNS or shDRAM2 using polybrene (8 μg/ml). After 36 h, cells were treated with AICAR (0.5 mM) or vitamin D3 (20 nM) for 24 h. (A) Cells were fixed and stained with anti-LC3 (Alexa Fluor 488; green) to detect LC3 puncta. Scale bars: 5 μm. (B) Quantitative data from LC3 puncta analysis. (C) LC3 protein levels were determined by immunoblotting. (D and E) THP-1 cells were transfected with the pIRES control vector (mock) or DRAM2-HA plasmid. LC3 protein levels were determined by immunoblotting (D), and LC3 puncta were visualized by confocal microscopy (E, Left) and quantitative analysis (E, Right). (F) Human primary monocytes were transduced with lentivirus expressing shNS or shDRAM2 using polybrene (8 μg/ml). (Left) After 36 h, cells were incubated with AICAR (0.5 mM) for 24 h and stained using anti-LC3 (Alexa Fluor 488; green) and anti-LAMP2 (Alexa Fluor 594; red) antibodies. (Right) The number of profiles in each field. Scale bars: 5 μm. (G) Human primary monocytes were transduced with lentivirus expressing shNS or shDRAM2 using polybrene (8 μg/ml). (Left) After 36 h, cells were infected with Mtb-ERFP for 4 h and then treated with AICAR (0.5 mM) for 24 h. (Left) Cells were fixed, stained with anti-LC3 (Alexa Fluor 488; green), and assayed for the colocalization of Mtb-ERFP with LC3 by confocal microscopy. (Right) Quantitative analysis of colocalization of Mtb-ERFP with LC3. Scale bars: 5 μm. (H and I) Human MDMs were transduced with lentivirus expressing shNS or shDRAM2 using polybrene (8 μg/ml). After 36 h, cells were infected with Mtb, followed by treatment with AICAR (0.5 mM). Intracellular survival of Mtb was determined by CFU assay. Experiments were performed 3 times, and data are presented as means ± SD. *P < 0.05 and **P < 0.01. U, untreated control; A, AICAR; V, vitamin D3; M, mock vector; D, DRAM2-HA plasmid; SC, solvent control; N, nucleus; ns, not significant.
We then examined whether DRAM2 is required for PRKAA-mediated phagosomal acidification and protection against intracellular Mtb. AICAR and vitamin D3 treatment increased the colocalization between Mtb phagosomes and LC3 autophagosomes. In contrast, knockdown of DRAM2 by shDRAM2 significantly reduced this colocalization (Fig. 7G). In addition, transduction of human MDMs with shDRAM2 significantly decreased the colocalization between Mtb phagosomes with lysosomes, compared with those in shNS-transduced cells (Fig. S13). We further evaluated whether DRAM2 affects the intracellular survival of Mtb in macrophages. Importantly, silencing of DRAM2 significantly increased intracellular survival of mycobacteria in MDMs, even in the absence of autophagy inducers (Fig. 7H and I; shNS vs. shDRAM2 under solvent control conditions; P < 0.05 for MOIs of 1 and 10, respectively). At 72 h postinfection, knockdown of DRAM2 by shDRAM2 also markedly reversed the killing capabilities of AICAR against intracellular Mtb in human MDMs (Fig. 7H and I; shNS vs. shDRAM2 under AICAR-treated conditions; P < 0.05 for MOIs of 1 and 10, respectively). Together, these data indicate that DRAM2 contributes to autophagy activation during the induction and maturation steps, and to enhancement of phagosomal acidification and antimicrobial responses, in human monocytes and macrophages.
MIR144* inhibits phagosomal maturation and antimicrobial responses to Mtb in human macrophages
We further addressed whether MIR144* modulates host defenses against mycobacterial infection. We thus examined the effects of MIR144* on LC3 colocalization with Mtb, phagosomal acidification, and antimicrobial responses against Mtb in human MDMs. Since Mtb infection led to an increase in MIR144* levels in human MDMs (Fig. 1E and F), we transfected MDMs with a MIR144* inhibitor and evaluated its effects on LC3 colocalization with Mtb and phagosomal maturation. Transfection of human MDMs with a MIR144* inhibitor significantly increased the colocalization between Mtb phagosomes and LC3 autophagosomes (Fig. 8A) and the colocalization between Mtb phagosomes and lysosomes (Fig. 8B), compared with those in cells transfected with the vehicle or negative control (Fig. 8A and B).
Figure 8.
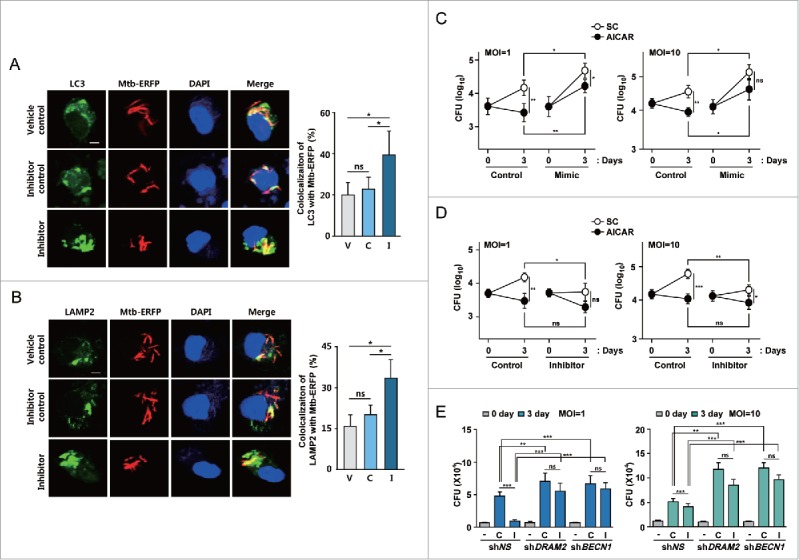
MIR144* is essential for phagosomal maturation and antimicrobial responses against Mtb infection. (A and B) Human MDMs were transfected with vehicle control, inhibitor negative control or MIR144* inhibitor (150 nM) for 24 h and then infected with Mtb-ERFP for 4 h. Cells were then stained with anti-LC3 (for A; Alexa Fluor 488; green) or anti-LAMP2 (for B; Alexa Fluor 488; green). Colocalization of Mtb-ERFP with anti-LC3 (for A) or anti-LAMP2 (for B) was evaluated by confocal microscopy. The image is a representative of at least 3 independent experiments (Left). Scale bar: 5 μm. Quantitative analysis of Mtb-ERFP colocalization with LC3 and LAMP2 (Right A and B, respectively). (C and D) Human MDMs were transfected with mimic negative control or MIR144* mimic (50 nM for C); inhibitor negative control or MIR144* inhibitor (150 nM for D) for 24 h. Cells were infected with Mtb (MOI of 1 or 10), followed by treatment without or with AICAR (0.5 mM). Intracellular survival of Mtb was determined by CFU assay. (E) Human MDMs were transduced with shNS, shDRAM2 or shBECN1 using polybrene (8 μM) for 36 h and then transfected with MIR144* inhibitor (150 nM) for 24 h. Cells were then infected with Mtb (MOI of 1 or 10), and intracellular survival of Mtb was determined by CFU assay. Experiments were performed 3 times, and data are presented as means ± SD. *P < 0.05, **P < 0.01, and ***P < 0.001. V, vehicle control; C, inhibitor negative control; I, MIR144* inhibitor; ns, not significant; SC, solvent control.
The effects of MIR144* on the regulation of intracellular mycobacterial survival in human MDMs were analyzed next. Importantly, inhibition of MIR144* decreased significantly, whereas overexpression of MIR144* increased, intracellular Mtb growth, even in the absence of autophagy inducers, compared with the corresponding control conditions. This demonstrates that MIR144* is essential for intracellular survival of Mtb in human MDMs (Fig. 8C, Ctrl. vs. Mimic under solvent control conditions, P < 0.05 for both MOIs of 1 and 10; Fig. 8D, Ctrl vs. Inhibitor under solvent control conditions, P < 0.05 and P < 0.01 for MOIs of 1 and 10, respectively). Moreover, overexpression of MIR144* in AICAR-treated MDMs significantly increased the survival of intracellular Mtb, compared with those transfected with the mimic negative control (Fig. 8C, Ctrl vs. Mimic under AICAR-treated conditions; P < 0.01 and P < 0.05, for both MOIs of 1 and 10, respectively). However, treatment of human MDMs with MIR144* inhibitor did not exert significant antimicrobial effects, compared with those transfected with an inhibitor negative control (Fig. 8D, Ctrl vs. Inhibitor under AICAR-treated conditions; not significant for both MOIs of 1 and 10).
In addition, we examined whether the intracellular survival rates of Mtb are modulated by knockdown of DRAM2 or BECN1 in the presence of a MIR144* inhibitor. As shown in Figure 8E, silencing of DRAM2 or BECN1 led to a significant increase in intracellular mycobacterial growth in human MDMs at 72 h postinfection. It was noted that the MIR144* inhibitor did not affect the intracellular survival of Mtb in human MDMs transduced with shDRAM2 or shBECN1, compared with those in shNS-transduced MDMs (Fig. 8E). Thus, these data suggest that MIR144* negatively regulates phagosomal maturation and antimicrobial effects against Mtb by targeting DRAM2.
Discussion
Autophagy, a lysosome-dependent degradation process, is a critical innate host defense mechanism in macrophages against intracellular bacteria, especially Mtb.38,39 Numerous miRNAs are emerging as regulators of autophagy pathways.40 Recent studies have shown that several miRNAs (e.g., Mir125a-3p/mmu-mir-125a-3p, Mir155/mmu-mir-155, Mir17-5p/mmu-mir-17-5p, Mir31/mmu-mir-31, and Mir33/mmu-mir-33/mmu-mir-33*) can modulate autophagy and host defense mechanisms against mycobacteria in murine cells and tissues.41-45 At present, little is known about the precise autophagy-regulating functions of miRNAs relevant to human TB infection. Here we describe a previously unknown function of MIR144*: inhibition of autophagy activation and antimicrobial responses by targeting DRAM2 in human monocytes/macrophages. Our results also demonstrate a novel relationship between DRAM2 and activation of the autophagic machinery, which promotes antimycobacterial immunity.
Our data demonstrate that MIR144* was upregulated in PBMCs and disease sites in pulmonary and extrapulmonary TB patients, compared with control samples. These data are similar to previous reports of upregulated MIR144* expression found in PBMCs from TB patients.13 Recent genome-wide, cohort studies reported marked downregulation of MIR144* in 1,049 samples from patients with various disease conditions (10 cancers and 9 noncancer diseases), suggesting that it may serve as a general disease state marker.46 However, in previous studies, the expression patterns of several miRNAs, including MIR144*, were different from those in PBMCs and pleural fluid mononuclear cells from TB patients.47 Levels of MIR144* were lower in cells obtained from pleural fluids of TB patients versus HCs, whereas MIR144* levels were comparable in peripheral blood cells between TB patients and HCs.47 We also found that infection with other mycobacterial strains (M. abscessus, M. bovis BCG, and Mtb H37Ra) led to a substantial increase in MIR144* expression in human MDMs; Mtb H37Rv infection led to the highest MIR144* level. Therefore, MIR144* is unlikely to be useful as a specific biomarker for the diagnosis of TB. Despite this, the current discovery of the role of MIR144* in the inhibition of antimycobacterial host defenses suggests a mechanism of TB pathogenesis in terms of modulation of host cell autophagy. The mechanisms by which Mtb or other mycobacterial strains induce MIR144* in human MDMs are not well understood. Recent studies have shown that TLR2 and nuclear factor-κB signaling are required for biogenesis of Mir125a-5p and Mir33/Mir33* in murine macrophages during Mtb infection, respectively.43,45 Thus, TLR inflammatory signaling triggered by Mtb infection may play a role in the induction of MIR144* expression in human macrophages.
During infection, Mtb interferes with the normal phagosome maturation process in macrophages, resulting in vacuoles with characteristics similar to those of early endosomes.48 Importantly, we found that MIR144* plays an important role in suppression of phagosomal maturation and antimicrobial responses in human macrophages infected with Mtb by targeting DRAM2. Current studies focus on enhancing the elimination of intracellular mycobacteria by determining the mechanisms of the antibacterial autophagy that overcomes Mtb-induced arrest of phagosomal maturation.6,49 Several autophagy inducers have been reported to enhance antimicrobial effects against mycobacteria.6,49 More specifically, TLR signals,50,51 IFNG,52 vitamin D3,27 and AMPK activation28 have been reported to activate autophagy as part of innate effector pathways against Mtb. Vitamin D3-induced autophagy increases the expression of the target antimicrobial peptide CAMP LL-37, which is also required for induction of autophagosome and phagosome colocalization, as well as antimicrobial effects against Mtb in human monocytes and macrophages.27 However, the molecular mechanisms of regulation of antibacterial autophagy in human monocytes/macrophages during Mtb infection, and the clinical relevance thereof, remain largely unknown. Our results reveal a central role for DRAM2 as an important target of MIR144* in the regulation of antibacterial autophagy induced by various autophagic stimulators (e.g., AICAR, vitamin D3, and MTOR inhibition) in human monocytes and macrophages.
DRAM2 is a transmembrane lysosomal protein that plays a role in the initiation of starvation-induced autophagy.26 However, the precise function of DRAM2 is unclear. In this study, we found that DRAM2 plays a critical role in autophagy induction and maturation in response to PRKAA-mediated autophagy stimulators and classical autophagy activators. Our results agree in part with previous studies26 that have revealed the function of DRAM2 in the initiation of autophagy activation. We found that DRAM2 overexpression increased, whereas silencing of DRAM2 decreased, autophagosome formation and the LC3-II/I ratio in human monocytic cells. A recent study has reported disease-causing variants of DRAM2 in families with retinal dystrophy, suggesting a role for DRAM2 in photoreceptor renewal and preservation of visual function.53 Another study highlights the role of DRAM2 as a target of MIR125B1-mediated oncogenic pathogenesis in acute promyelocytic leukemia, particularly its regulatory effects on the autophagy-lysosomal pathway.54 Several autophagy genes have been identified as targets of MIR125B1.54 We found that MIR144* affected the LAMP2 mRNA level (see Fig. S4A), suggesting a role for MIR144* in lysosomal biogenesis and function during mycobacterial infection. Future studies should investigate other targets of MIR144* and the functions thereof.
Our data provide new insight into the mechanisms by which DRAM2 contributes to autophagy activation in human cells, as follows: 1) DRAM2 interaction with BECN1 and UVRAG; 2) the correlation between DRAM2 expression and autophagy activation; 3) the finding that enhancement of DRAM2 leads to displacement of RUBCN, a known inhibitor of autophagy maturation,33,34 from the BECN1 complex; and 4) the interaction between DRAM2 and LAMP1 and LAMP2, which is required for autophagy maturation. The observation that DRAM2 interacts with both BECN1 and UVRAG suggests that DRAM2 crosstalk with the BECN1 complex is an essential part of autophagy. BECN1 was shown to form a core complex with PtdIns3K and was also associated with other physiological binding partners under various conditions.31 BECN1 contains a BH3 domain at its N terminus, a central coiled-coil domain (CCD), and an evolutionarily conserved domain at its C terminus.55 BECN1 regulates autophagy pathways at multiple steps by interacting with different binding partners. For example, the CCD domain of BECN1 is responsible for interactions with UVRAG and is required for promotion of autophagosome formation and maturation.55-57 In contrast, interaction of the BECN1-UVRAG complex with RUBCN negatively regulates autophagy.55 We observed that the overexpression of DRAM2 attenuated the interactions of BECN1 and UVRAG with RUBCN, leading to RUBCN displacement from the BECN1-Ptdlns3K-UVRAG complex. Moreover, DRAM2 was required for colocalization of Mtb phagosomes with LC3 autophagosomes or lysosomes. These results indicate a critical role for DRAM2 in the enhancement of phagosomal maturation against Mtb, which is based on existing literature showing that live Mtb prevents phagosome-lysosome fusion.58
Our data also suggest a somewhat consistent and different role for DRAM2 compared with its homolog DRAM1, a TP53-induced modulator of autophagy and apoptosis,59 in autophagy activation during mycobacterial infection.60 DRAM1 and DRAM2 have partially redundant functions in autophagy-mediated host defenses against mycobacterial infection and enhancement of antimicrobial responses.60 Although DRAM1 was required for selective autophagy activation against mycobacterial infection through SQSTM1/p62,60 DRAM2 contributes to initiation and maturation of autophagy processes. In addition, DRAM2 interacts with BECN1 and UVRAG, resulting in the displacement of RUBCN and enhancement of Ptdlns3K activity. In addition, DRAM1 expression was not modulated by MIR144* in human primary monocytes, suggesting no direct relationship between MIR144* and DRAM1.
A major finding associated with our study is that MIR144* not only regulates autophagy but also represses phagosomal maturation and intracellular killing of Mtb by targeting DRAM2. Indeed, we identified MIR144* as a potential contributor to TB pathogenesis, as indicated by their effects on the enhanced intracellular mycobacterial growth via suppression of autophagy. To our knowledge, this is the first report of the expression of autophagy genes in tuberculosis patients and its inverse correlation with miRNA levels and the first to suggest a mechanism of TB pathogenesis. Understanding the role of specific miRNAs during the regulation of autophagy may provide insight into the pathogenetic mechanisms of various infectious diseases through post-transcriptional regulation of the autophagy process. Furthermore, these studies may shed light on anti-TB therapeutics, especially with regard to host-directed therapies, because a series of targeted agents used to enhance antimycobacterial activities via activation of the autophagy pathway are inevitably associated with host defenses in Mtb infection.
Materials and methods
Bioinformatics analysis
To perform miRNA profiling assays, we downloaded 2 independent miRNA expression datasets (GSE 29190, GSE34608). The raw data are available on the National Center for Biotechnology Information Gene Expression Omnibus website (http://www.ncbi.nlm.nih.gov/geo/). miRNAs considered to be upregulated (fold change >1 .5 or <0 .666666, P value <0 .05) were selected. A Venn diagram was generated using VennPlex version 1.0.0.2 (National Institutes of Health, http://www.irp.nia.nih.gov/bioinformatics/vennplex.html). The heatmap was analyzed using MultiExperiment Viewer version 4.8.1 (The Institute for Genomic Research, http://www.tm4.org/mev/). miRNA targets were identified using miRanda (http://www.microrna.org), and miRDB (http://mirdb.org/miRDB/) and DIANA-microT (http://diana.cslab.ece.ntua.gr/microT/) were used to predict miRNA sequences and targets. The hybridization package (http://www.bioinfo.rpi.edu/applications/following) was used to further determine ΔG, following the instructions provided online.
Study population
Two types of samples were included in this study. All patients and HCs provided informed consent, and the patients were enrolled based on their diagnosis prior to chemotherapy treatment. We collected peripheral blood from 69 individuals: 37 HCs (median age 46.6 ± 12.7 y; male 43.2%) and 32 TB patients (median age 49.0 ± 18.4 y; male 43.8%). In addition, disease site samples were obtained from 91 formalin-fixed paraffin-embedded (FFPE) tissues: 47 control samples from nontuberculous and nonmalignant patients (median age 54.0 ± 16.5 y; male 42.6%) and 44 samples from pulmonary and extrapulmonary TB patients (median age 45.1 ± 16.1 y; male 40.9%). Detailed information regarding the patients and controls is shown in Tables S3 and S4. Individual samples were diagnosed for Mtb by chest x-ray, Ziehl-Neelsen staining, mycobacterial culture, and PCR. All samples were HIV negative. All patients provided informed consent, and the protocol conformed to the guidelines of the Declaration of Helsinki. The Chungnam National University Hospital Bioethics Committee approved this study protocol, and informed written consent was obtained from all participants (CNUH 2014-04-039-009). The biospecimens and data used for this study were provided by the Biobank of Chungnam University Hospital, a member of the Korea Biobank Network.
RNA extraction from formalin-fixed paraffin-embedded tissues
For the initial evaluation, total miRNA and RNA were isolated from FFPE lung and lymph node tissue blocks, which were sectioned at a thickness of 20 μm. miRNA and RNA were isolated from FFPE blocks using the miRNeasy FFPE Kit (Qiagen, 217504) and RNeasy FFPE Kit (Qiagen, 217504), according to the instructions of the respective manufacturers.
Cell cultures
Human PBMCs were isolated from heparinized venous blood using Ficoll-Hypaque (Lymphoprep; Axis-Shield, 1114545) as described previously.61 For macrophage differentiation, adherent monocytes were incubated in RPMI 1640 (Lonza, 12-702F) with 10% pooled human serum (Lonza, 14-402), 1% L-glutamine, 50 IU/ml penicillin, and 50 μg/ml streptomycin for 1 h at 37°C, and nonadherent cells were removed. Human MDMs were prepared by culturing peripheral blood monocytes for 4 d in the presence of 4 ng/ml human CSF/macrophage colony-stimulating factor (Sigma-Aldrich, M6518) as described previously.27 293T (ATCC, 11268), and human monocytic THP-1 (ATCC, TIB-202) cells were maintained in RPMI 1640 medium supplemented with 10% fetal bovine serum (FBS; Lonza, BW14-503E) and antibiotics. THP-1 cells were treated with 20 nM phorbol-12-myristate-13-acetate (Sigma-Aldrich, P8139) for 24 h to induce differentiation into macrophage-like cells. Human Phoenix AMPHO (ATCC, CRL-3213) cells were maintained in Dulbecco's modified Eagle's medium (Lonza, 12-604F) containing 4 mM glutamine, penicillin (100 IU/ml), streptomycin (100 μg/ml), and 10% FBS. Cells were incubated in a 37°C humidified atmosphere with 5% CO2. All experimental procedures were approved by the Chungnam National University Institutional Research and Ethics Committee.
Bacterial strains and conditions
Mtb H37Rv was kindly provided by Dr. R L Friedman (University of Arizona, Tucson, AZ, USA) and was grown at 37°C with shaking in Middlebrook 7H9 broth (Difco, 271310) supplemented with 0.5% glycerol, 0.05% Tween-80 (Sigma-Aldrich, P1754), and oleic albumin dextrose catalase (BD Biosciences, 212240). Bacterial cultures were harvested by centrifugation at 500 × g for 20 min, and the pellets were resuspended in bacterial culture medium. Bacterial cultures were divided into 1-ml aliquots and stored at −80°C. Mtb-enhanced red fluorescent protein (ERFP) was described previously.62 We used 50 μg/ml kanamycin (Sigma-Aldrich, 60615) to culture the Mtb-ERFP strain. For all experiments, mid-log-phase bacteria (absorbance 0.4) were used. Representative vials were thawed and colony-forming units (CFUs) enumerated by serially diluting and plating on Middlebrook 7H10 agar (Difco, 262710).
Bacterial infections
Bacterial clumps were removed by passing the washed suspension through a 22-gauge syringe. The optical density at 600 nm of the culture was measured to calculate the required inoculum for infection. Cells were infected for 4 h with Mtb H37Rv or Mtb-ERFP at the indicated MOIs. Cells were washed 3 times with phosphate-buffered saline (PBS; Sigma, P4417) to remove extracellular bacteria and incubated with fresh medium at 37°C and 5% CO2.
Reagents, plasmids and antibodies
AICAR (A9978), 1α,25-dihydroxyvitamin D3 (vitamin D3, D1530) and 4′,6-diamidino-2-phenylindole (DAPI, D9542) were purchased from Sigma-Aldrich. Rapamycin (553211) was purchased from Calbiochem. For real-time PCR, a MIR144* primer (MS00008701) was purchased from Qiagen. For immunofluorescence analysis, anti-LC3A/B (PM036) was purchased from Medical & Biological Laboratories International. Alexa Fluor 488-conjugated anti-rabbit IgG (A17041) was purchased from Molecular Probes. pBABE-puro mCherry-EGFP-LC3B was from Addgene (22418 deposited by Jayanta Debnath). Anti-LC3A/B (L8918) for immunoblotting was purchased from Sigma-Aldrich. Anti-DRAM2 (sc-241076), anti-ACTB (sc-1616), anti-HA (sc-805), anti-Flag (sc-807), anti-GFP (sc-8334), anti-BECN1 (sc-11427), anti-V5 (sc-83849), anti-LAMP1 (sc-20011), and anti-LAMP2 (sc-18822) were purchased from Santa Cruz Biotechnology. Anti-PRKAA1/2/AMPKα (2532), anti-BECN1 (3495) and anti-UVRAG (13115) were purchased from CST Cell Signaling Technology.
Plasmid construction
DNA fragments corresponding to the coding sequences of the human BECN1, UVRAG, ATG16L1, ATG3, and RUBCN genes were amplified by PCR and subcloned into pEF-IRES-puro between the AflII and XbaI sites. HA-tagged human DRAM2 was cloned into the BamHI and NotI sites in pCDH-CMV. All constructs were sequenced using the ABI PRISM 377 automatic DNA sequencer (Applied Biosystems, Inc., Carlsbad, CA USA ) to verify 100% correspondence with the original sequence. The 3′ UTR of the human DRAM2 sequences, containing the MIR144*-binding elements, was amplified by PCR and subcloned into the pmirGLO reporter vector (Promega, E133A). The Δ3 and Δ2,3 sequences were obtained by PCR from full length DRAM2. The primer sequences used were as follows: full length (forward, 5′-ATGTGGTGGTTTCAGCAAGGCCTCAGTTTC-3′, reverse, 5′-ATGGAAGAGCCCACATGAATCCAGGTCTAC-3′), △3 (forward, 5′- ATGTGGTGGTTTCAGCAAGGCCTCAGTTTC-3′, reverse, 5′-AAAAAGTATAGGCATAGGTGTTTTTAATAG-3′), and △2,3 (forward, 5′- ATGTGGTGGTTTCAGCAAGGCCTCAGTTTC-3′, reverse, 5′-AGAATAATCTATCAAATGGCTTCTTTCATG-3′). A mutant form of site 3 was obtained by site-directed mutagenesis (Invitrogen, A14604) of the WT construct.
Cell transfections
The MIR144* mimic (5′-GGAUAUCAUCAUAUACUGUAAG-3′) and MIR144* inhibitor (5′-CUUACAGUAUAUGAUGAUAUCC-3′) were purchased from Genolution. The mimic negative control (4464058) and inhibitor negative control (4464076) were purchased from Ambion. Human monocytes, MDMs grown to 70% confluence in appropriate culture plates, were transfected with a miRNA mimic negative control or MIR144* mimic (50 nM), inhibitor negative control or MIR144* inhibitor (150 nM) using Lipofectamine 2000 (Invitrogen, 12566014) for 24 h according to the manufacturer's instructions. The transfection medium was then replaced with normal medium. THP-1 cells were seeded at 1 × 10⁵ per well in 48-well plates and transfected with mimic negative control or MIR144* mimic (50 nM), inhibitor negative control or MIR144* inhibitor (150 nM), or the NCF4 PX-EGFP plasmid. To assay luciferase activity, THP-1 cells were cotransfected with the pmiR-DRAM2 3′ UTR WT or mutated vector and MIR144* mimic using Lipofectamine 2000 for 24 h.
RNA preparation and quantitative real-time polymerase chain reaction
For quantitative real-time PCR analysis, total RNA from cells was isolated using QIAzol lysis reagent (Qiagen, 79306), and purification of miRNA was performed using the Qiagen miRNeasy Mini Kit (Qiagen, 217004) according to the manufacturer's instructions. After RNA quantitation, cDNA was synthesized by reverse transcription using the miScriptII RT Kit (Qiagen, 218161). Real-time PCR was performed using the miScript SYBR Green PCR Kit (Qiagen, 218073), and samples were amplified for 50 cycles as follows: 95°C for 15 s, 55°C for 30 s, and 72°C for 30 s. The expression of MIR144* was calculated relative to RNU6-6P/RNU6B, a ubiquitous small nuclear RNA.
Two-step real-time PCR was performed using the Rotor-Gene SYBR Green PCR Kit (Qiagen, 204074) using the real-time PCR cycler Rotor-Gene Q 2plex system (Qiagen GmbH, 9001620, Hilden, Germany). The samples were amplified for 40 cycles as follows: 95°C for 5 s and 60°C for 10 s. The following primer sequences were used: HsDRAM2 (forward, 5′-CCTTTCCTACCAAATGCAGCCC-3′, reverse, 5′-GCCACTGTGCAAAACTGATGAGC-3′), HsDRAM1 (forward, 5′-CATCTCTGCCGTTTCTTGCG-3′, reverse, 5′-GGGTGACACTCTTTTCTCTTGG-3′), HsGAPDH (forward, 5′-TCTCCTGCGACTTCAACA-3′, reverse, 5′-TGGTCCAGGGTTTCTTACT-3′), HsPRKAA1 (forward, 5′-AGGAAGAATCCTGTGACAAGCAC-3′, reverse, 5′- CCGATCTCTGTGGAGTAGCAGT-3′), and MIR144* (5′-GGATATCATCATATACTGTAAG-3′).
Immunofluorescence and confocal microscopy
Immunofluorescence and confocal microscopy were performed as described previously.62 After the appropriate treatment, cells on coverslips were washed 3 times with fresh PBS, fixed with 4% paraformaldehyde for 15 min, permeabilized with 0.25% Triton X-100 (Sigma, T8787) for 10 min, and incubated with primary antibodies—anti-LC3A/B, anti-LAMP2, anti-DRAM2, and anti-BECN1—for 2 h at room temperature. Cells were washed with PBS to remove excess primary antibodies and then incubated with secondary antibodies for 1 h at room temperature. Nuclei were stained with DAPI for 1 min. After mounting, fluorescence images were acquired using a confocal laser-scanning microscope (LSM 710; Zeiss, CLSM, Jena, Germany), with constant excitation, emission, pinhole and exposure time parameters.
To quantify autophagy, LC3 punctate dots were determined using ImageJ software. Each condition was assayed in triplicate, and at least 100 cells per well were counted. Colocalization of autophagosome and lysosome markers with mycobacterial phagosomes were analyzed as described previously.63,64 To quantify the percentage of mycobacterial phagosomes, autophagosomes (LC3) and/or lysosomes (LAMP2), Mtb-infected cells were visualized directly by confocal laser scanning microscopy, and the images were captured using the ZEN 2009 software (version 5.5 SP1; Zeiss). Quantification of mycobacterial colocalization with autophagosomes and lysosomes was performed by counting the red (noncolocalized) and yellow (colocalized) mycobacteria. A minimum of 300 bacterial phagosomes or autophagosome and lysosome markers were analyzed per coverslip for each experiment. Each experiment was completed on triplicate coverslips and expressed as the average and standard deviation. For autophagic flux analysis, human monocytes were transduced with a retrovirus expressing an LC3B plasmid and miRNA (e.g., the negative control, mimic, or inhibitor) and then analyzed. Images of dynamic cell colocalization were recorded as vertical z-stacks. LAS X small 2.0 and Adobe Photoshop 7 (Adobe Systems) were used for image processing.
In vitro assay of Ptdlns3K activity
Ptdlns3K activity was assayed as described previously.65 Briefly, Ptdlns3K immunoprecipitates were obtained using an antibody against-PIK3C3/VPS34 (Echelon Biosciences, Z-R015) in lysis buffer (50 mM Tris, pH 7.4, 7.5% glycerol, 150 mM NaCl, 1 mM EDTA, and protease inhibitors [Roche, 11697498001]). The immunoprecipitates were incubated with beads for 4 h at 4°C. The beads were then washed 4 times with lysis buffer and once in substrate buffer (75 mM Tris, pH 7.5, 125 mM NaCl, 12.5 mM MnCl2). The beads were resuspended in substrate buffer containing 250 μg/ml phosphoinositol (Sigma, 79403) on ice for 15 min. The kinase reaction was started by addition of 10 μM ATP (Sigma, A6559) for 30 min at 20°C. The reaction mixtures were spotted on nitrocellulose membranes, blocked for 1 h in PBS containing 1% low-fat dry milk, and incubated with 0.5 μg/ml PtdIns3P Grip (Echelon Biosciences, G-0302) for 2 h. The membrane was incubated with an anti-GST antibody (Sigma, G1160) for 2 h and then an anti-mouse secondary antibody (Calbiochem, 401215).
Lentiviral shRNA production and transduction
For silencing of human DRAM2 and PRKAA1 in primary cells, packaging plasmids (pRSV-Rev; 12253, pMD2. G; 12259 and pMDLg/pRRE; 12251, purchased from Addgene, deposited by Dr. Didier Trono) and pLKO.1-based target shRNA plasmids [HsDRAM2, sc-88105-SH and HsPRKAA1, sc-29673-SH], purchased from Santa Cruz Biotechnology) were cotransfected into 293T cells using Lipofectamine 2000. After 72 h, virus-containing medium was collected and filtered. Human primary monocytes (5 × 10⁵/well) in RPMI 1640 medium supplemented with 10% FBS were seeded into 24-well plates and then infected with lentiviral vectors in the presence of 8 μg/ml polybrene (Sigma-Aldrich, H9268). On the following day, the medium was replaced with fresh medium. After 3 d, transduction efficiency was analyzed by PCR.
Generation of a tandem LC3B retroviral vector (mCherry-EGFP-LC3B) for measurement of autophagic flux in primary cells
For recombinant retroviral production, Phoenix amphotropic cells were seeded at 70–80% confluence into a 6-well plate and cotransfected with 0.75 μg of packaging plasmid pCL-Eco (Addgene, 12371), 0.25 μg of envelope plasmid pMDG (Addgene, 12259), and 1 μg of pBABE-puro mCherry-EGFP-LC3B plasmid using Lipofectamine 2000. After 6 h, the medium was replaced with fresh culture medium. The retrovirus-containing medium was harvested at 24 h and 48 h post-transfection and filtered through a 0.45-μm syringe filter.
Immunoblotting and immunoprecipitation
Cells were lysed in radioimmunoprecipitation assay (RIPA) buffer (50 mM Tris-HCl, pH 7.4, 150 mM NaCl, 1% NP40 (Invitrogen, FNN0021), and 0.25% Na-deoxycholate (Invitrogen, 89904) supplemented with complete protease inhibitor cocktail. Proteins were separated by 12% or 15% SDS-PAGE and transferred to a polyvinylidene difluoride membrane (PVDF; Millipore, IPVH0001). Membranes were blocked in 5% nonfat milk in PBST (3.2 mM Na2HPO4, 0.5 mM KH2PO4, 1.3 mM KCl, 135 mM NaCl, 0.05% Tween 20 [Sigma, P9416], pH 7.4) for 1 h and incubated with the following primary antibodies: anti-DRAM2, anti-LC3A/B, anti-Flag, anti-HA, anti-V5, anti-BECN1, anti-UVRAG, anti-LAMP1, anti-LAMP2, and anti-ACTB. After incubation with the appropriate antibodies, immunoreactive band analysis was performed using an ECL reagent (Millipore, WBKL S0 500), and bands were detected using a Vilber chemiluminescence analyzer (Vilber Lourmat, Fusion SL 3, Eberhardzell, Germany). Immunoprecipitation was performed as described previously66 with minor modifications. We collected and lysed human monocytes and THP-1 cells using RIPA buffer supplemented with a complete protease inhibitor cocktail. After preclearing with protein A/G agarose beads (GE Healthcare, GE17-0708-01) for 2 h at 4°C, whole-cell lysates were used for immunoprecipitation with the indicated antibodies. In general, 1 to 2 μg of commercial antibody was added to 1 ml cell lysate and incubated at 4°C for 18 h. After incubation with protein A/G agarose beads for 6 h, immunoprecipitates were washed extensively with lysis buffer and eluted with SDS loading buffer by boiling for 5 min. The samples were separated by SDS-PAGE and transferred to PVDF membranes. Proteins were detected by immunoblotting.
Autophagy analysis
LC3-II protein levels were evaluated by immunoblotting using an antibody against LC3A/B (Sigma; L8918). LC3 punctate staining was quantified in triplicate from at least 100 randomly chosen cells using ImageJ software. Autophagic flux assays were performed using a retrovirus expressing a tandem LC3B plasmid.
Luciferase reporter assays
Vectors containing full-length, Δ3, Δ2,3, WT, or mutated binding site 3 from the DRAM2 3′ UTR were cotransfected with vehicle control, mimic negative control or MIR144* mimic into THP-1 cells. After 24 h, cells were lysed in lysis reagent (Promega, E1531) and luciferase activities analyzed using the Dual-Luciferase Reporter System (Promega, E1910), according to the manufacturer's instructions.
CFU assay
To assess bacterial viability within human MDMs, cells were infected with Mtb at an MOI of 1 or 10 for 4 h. The infected cells were washed 3 times with PBS to remove extracellular bacteria. The infected cells were incubated for the indicated periods and then lysed with 0.3% saponin (Sigma, 47036) to release intracellular bacteria. Thereafter, bacteria were harvested and inoculated onto Middlebrook 7H10 agar with oleic albumin dextrose catalase. Plates were incubated for 3 wk, and colonies were counted.
Statistical analysis
All analyses were performed using SPSS 20.0 for Windows (SPSS Inc., Chicago, IL, USA) and GraphPad Prism 5.03 for Windows (GraphPad Software Inc., San Diego, CA, USA). For comparisons of 2 treatment groups, the Student t test was used. For comparisons of 3 or more groups, one-way ANOVA was used with the Bonferroni post-hoc test for comparison of 2 selected treatment groups; the Dunnett post-hoc test was used for comparisons of the other treatment groups with the corresponding controls. Data are presented as means ± standard deviation (SD) or medians with ranges. Comparison between HCs and TB patients was performed using the Student t test. Pearson correlation analysis was also performed to evaluate correlations between MIR144* and DRAM2. A value of P < 0 .05 was considered to indicate statistical significance.
Supplementary Material
Abbreviations
- AICAR
AMP-mimetic 5-aminoimidazole-4-carboxamide-1-β-D-ribofuranoside
- AMPK
AMP-activated protein kinase
- ATG
autophagy related
- BCG
Mycobacterium bovis-Bacillus Calmette-Guérin
- CCD
coiled-coil domain
- CFUs
colony-forming units
- DRAM2
DNA damage-regulated autophagy modulator 2
- FFPE
formalin-fixed paraffin-embedded
- GFP
green fluorescent protein
- HA
hemagglutinin
- HCs
healthy controls
- LAMP
lysosomal-associated membrane protein
- MAP1LC3/LC3
microtubule-associated protein 1 light chain 3
- MDMs
monocyte-derived macrophages
- miRNAs
microRNAs
- MIR144*
hsa-miR-144-5p
- MOI
multiplicity of infection
- Mtb
Mycobacterium tuberculosis H37Rv
- PBMCs
peripheral blood mononuclear cells
- PCR
polymerase chain reaction
- PIK3C3/Vps34
phosphatidylinositol 3-kinase catalytic subunit type 3
- PtdIns3K
phosphatidylinositol 3-kinase
- PRKAA1/2/AMPKα
protein kinase AMP-activated catalytic subunit α
- RUBCN
RUN and cysteine rich domain containing Beclin 1 interacting protein
- TB
tuberculosis
- TNF/TNF-α
tumor necrosis factor
- ULK1
unc-51 like autophagy activating kinase 1
- 3′ UTR
3′-untranslated region
- UVRAG
ultraviolet radiation resistance associated
- WT
wild type
Disclosure of potential conflicts of interest
No potential conflicts of interest were disclosed.
Acknowledgments
We thank H. S. Jin (Chungnam National University, Korea), T. Y. Kim (Kyung Hee University, Korea) for helpful discussion and reagents; R. L. Friedman (University of Arizona, AZ) for mycobacterial strains; S. J. Shin (Yonsei University, Korea) for Mtb-ERFP; J. U. Jung (University of Southern California, CA) for BECN1 and UVRAG plasmids; and D. Ray for critical reading of the manuscript.
Funding
This work was supported by Basic Science Research Program through the National Research Foundation of Korea (NRF) funded by the Ministry of Education (NRF-2013R1A1A2058116) and Korea Science & Engineering Foundation through the Korea Health Technology R&D Project through the Korea Health Industry Development Institute (KHIDI), funded by the Ministry of Health & Welfare, Republic of Korea (HI15C0395) at Chungnam National University. This work was supported by the National Research Foundation of Korea (NRF) grant funded by the Korea government (MSIP) (No.2011-0030049). This work was also supported by a research fund (2015) of Chungnam National University.
References
- [1].Deretic V. Autophagy in immunity and cell-autonomous defense against intracellular microbes. Immunol Rev 2011; 240:92-104; PMID:21349088; http://dx.doi.org/ 10.1111/j.1600-065X.2010.00995.x [DOI] [PMC free article] [PubMed] [Google Scholar]
- [2].Levine B, Mizushima N, Virgin HW. Autophagy in immunity and inflammation. Nature 2011; 469:323-35; PMID:21248839; http://dx.doi.org/ 10.1038/nature09782 [DOI] [PMC free article] [PubMed] [Google Scholar]
- [3].Cemma M, Brumell JH. Interactions of pathogenic bacteria with autophagy systems. Curr Biol 2012; 22:R540-5; PMID:22790007; http://dx.doi.org/ 10.1016/j.cub.2012.06.001 [DOI] [PubMed] [Google Scholar]
- [4].Deretic V. Autophagy, an immunologic magic bullet: Mycobacterium tuberculosis phagosome maturation block and how to bypass it. Future Microbiol 2008; 3:517-24; PMID:18811236; http://dx.doi.org/ 10.2217/17460913.3.5.517 [DOI] [PMC free article] [PubMed] [Google Scholar]
- [5].Manzanillo PS, Ayres JS, Watson RO, Collins AC, Souza G, Rae CS, Schneider DS, Nakamura K, Shiloh MU, Cox JS. The ubiquitin ligase parkin mediates resistance to intracellular pathogens. Nature 2013; 501:512-6; PMID:24005326; http://dx.doi.org/ 10.1038/nature12566 [DOI] [PMC free article] [PubMed] [Google Scholar]
- [6].Jo EK, Yuk JM, Shin DM, Sasakawa C. Roles of autophagy in elimination of intracellular bacterial pathogens. Front Immunol 2013; 4:97; PMID:23653625; http://dx.doi.org/ 10.3389/fimmu.2013.00097 [DOI] [PMC free article] [PubMed] [Google Scholar]
- [7].Fabri M, Stenger S, Shin DM, Yuk JM, Liu PT, Realegeno S, Lee HM, Krutzik SR, Schenk M, Sieling PA, et al.. Vitamin D is required for IFN-gamma-mediated antimicrobial activity of human macrophages. Sci Transl Med 2011; 3:104ra102; PMID:21998409; http://dx.doi.org/ 10.1126/scitranslmed.3003045 [DOI] [PMC free article] [PubMed] [Google Scholar]
- [8].Verway M, Bouttier M, Wang TT, Carrier M, Calderon M, An BS, Devemy E, McIntosh F, Divangahi M, Behr MA, et al.. Vitamin D induces interleukin-1β expression: paracrine macrophage epithelial signaling controls M. tuberculosis infection. PLoS Pathog 2013; 9:e1003407; PMID:23762029; http://dx.doi.org/ 10.1371/journal.ppat.1003407 [DOI] [PMC free article] [PubMed] [Google Scholar]
- [9].Deretic V, Delgado M, Vergne I, Master S, De Haro S, Ponpuak M, Singh S. Autophagy in immunity against Mycobacterium tuberculosis: a model system to dissect immunological rolesof autophagy. Curr Top Microbiol Immunol 2009; 335:169-88; PMID:19802565 [DOI] [PMC free article] [PubMed] [Google Scholar]
- [10].Bartel DP. MicroRNAs: genomics, biogenesis, mechanism, and function. Cell 2004; 116:281-97; PMID:14744438; http://dx.doi.org/ 10.1016/S0092-8674(04)00045-5 [DOI] [PubMed] [Google Scholar]
- [11].Xie X, Lu J, Kulbokas EJ, Golub TR, Mootha V, Lindblad-Toh K, Lander ES, Kellis M. Systematic discovery of regulatory motifs in human promoters and 3' UTRs by comparison of several mammals. Nature 2005; 434:338-45; PMID:15735639; http://dx.doi.org/ 10.1038/nature03441 [DOI] [PMC free article] [PubMed] [Google Scholar]
- [12].Wu J, Lu C, Diao N, Zhang S, Wang S, Wang F, Gao Y, Chen J, Shao L, Lu J, et al.. Analysis of microRNA expression profiling identifies miR-155 and miR-155* as potential diagnostic markers for active tuberculosis: a preliminary study. Hum Immunol 2012; 73:31-7; PMID:22037148; http://dx.doi.org/ 10.1016/j.humimm.2011.10.003 [DOI] [PubMed] [Google Scholar]
- [13].Liu Y, Wang X, Jiang J, Cao Z, Yang B, Cheng X. Modulation of T cell cytokine production by miR-144* with elevated expression in patients with pulmonary tuberculosis. Mol Immunol 2011; 48:1084-90; PMID:21367459; http://dx.doi.org/ 10.1016/j.molimm.2011.02.001 [DOI] [PubMed] [Google Scholar]
- [14].Liu PT, Wheelwright M, Teles R, Komisopoulou E, Edfeldt K, Ferguson B, Mehta MD, Vazirnia A, Rea TH, Sarno EN, et al.. MicroRNA-21 targets the vitamin D-dependent antimicrobial pathway in leprosy. Nat Med 2012; 18:267-73; PMID:22286305; http://dx.doi.org/ 10.1038/nm.2584 [DOI] [PMC free article] [PubMed] [Google Scholar]
- [15].Kumar M, Sahu SK, Kumar R, Subuddhi A, Maji RK, Jana K, Gupta P, Raffetseder J, Lerm M, Ghosh Z, et al.. MicroRNA let-7 modulates the immune response to Mycobacterium tuberculosis infection via control of A20, an inhibitor of the NF-kappaB pathway. Cell Host Microbe 2015; 17:345-56; PMID:25683052; http://dx.doi.org/ 10.1016/j.chom.2015.01.007 [DOI] [PubMed] [Google Scholar]
- [16].Wang C, Yang S, Sun G, Tang X, Lu S, Neyrolles O, Gao Q. Comparative miRNA expression profiles in individuals with latent and active tuberculosis. PLoS One 2011; 6:e25832; PMID:22003408; http://dx.doi.org/ 10.1371/journal.pone.0025832 [DOI] [PMC free article] [PubMed] [Google Scholar]
- [17].Maertzdorf J, Weiner J 3rd, Mollenkopf HJ, TBornotTB Network, Bauer T, Prasse A, Müller-Quernheim J, Kaufmann SH. Common patterns and disease-related signatures in tuberculosis and sarcoidosis. Proc Natl Acad Sci U S A 2012; 109:7853-8; PMID:22547807; http://dx.doi.org/ 10.1073/pnas.1121072109 [DOI] [PMC free article] [PubMed] [Google Scholar]
- [18].Crighton D, Wilkinson S, Ryan KM. DRAM links autophagy to p53 and programmed cell death. Autophagy 2007; 3:72-4; PMID:17102582; http://dx.doi.org/ 10.4161/auto.3438 [DOI] [PubMed] [Google Scholar]
- [19].Fu Y, Yi Z, Wu X, Li J, Xu F. Circulating microRNAs in patients with active pulmonary tuberculosis. J Clin Microbiol 2011; 49:4246-51; PMID:21998423; http://dx.doi.org/ 10.1128/JCM.05459-11 [DOI] [PMC free article] [PubMed] [Google Scholar]
- [20].Korkmaz G, le Sage C, Tekirdag KA, Agami R, Gozuacik D. miR-376b controls starvation and mTOR inhibition-related autophagy by targeting ATG4C and BECN1. Autophagy 2012; 8:165-76; PMID:22248718; http://dx.doi.org/ 10.4161/auto.8.2.18351 [DOI] [PubMed] [Google Scholar]
- [21].Betel D, Koppal A, Agius P, Sander C, Leslie C. Comprehensive modeling of microRNA targets predicts functional non-conserved and non-canonical sites. Genome Biol 2010; 11:R90; PMID:20799968; http://dx.doi.org/ 10.1186/gb-2010-11-8-r90 [DOI] [PMC free article] [PubMed] [Google Scholar]
- [22].Zhao Y, Samal E, Srivastava D. Serum response factor regulates a muscle-specific microRNA that targets Hand2 during cardiogenesis. Nature 2005; 436:214-20; PMID:15951802; http://dx.doi.org/ 10.1038/nature03817 [DOI] [PubMed] [Google Scholar]
- [23].Zhao Y, Ransom JF, Li A, Vedantham V, von Drehle M, Muth AN, Tsuchihashi T, McManus MT, Schwartz RJ, Srivastava D. Dysregulation of cardiogenesis, cardiac conduction, and cell cycle in mice lacking miRNA-1-2. Cell 2007; 129:303-17; PMID:17397913; http://dx.doi.org/ 10.1016/j.cell.2007.03.030 [DOI] [PubMed] [Google Scholar]
- [24].Kuhn DE, Martin MM, Feldman DS, Terry AV Jr, Nuovo GJ, Elton TS. Experimental validation of miRNA targets. Methods 2008; 44:47-54; PMID:18158132; http://dx.doi.org/ 10.1016/j.ymeth.2007.09.005 [DOI] [PMC free article] [PubMed] [Google Scholar]
- [25].O'Prey J, Skommer J, Wilkinson S, Ryan KM. Analysis of DRAM-related proteins reveals evolutionarily conserved and divergent roles in the control of autophagy. Cell Cycle 2009; 8:2260-5; PMID:19556885; http://dx.doi.org/ 10.4161/cc.8.14.9050 [DOI] [PubMed] [Google Scholar]
- [26].Yoon JH, Her S, Kim M, Jang IS, Park J. The expression of damage-regulated autophagy modulator 2 (DRAM2) contributes to autophagy induction. Mol Biol Rep 2012; 39:1087-93; PMID:21584698; http://dx.doi.org/ 10.1007/s11033-011-0835-x [DOI] [PubMed] [Google Scholar]
- [27].Yuk JM, Shin DM, Lee HM, Yang CS, Jin HS, Kim KK, Lee ZW, Lee SH, Kim JM, Jo EK. Vitamin D3 induces autophagy in human monocytes/macrophages via cathelicidin. Cell Host Microbe 2009; 6:231-43; PMID:19748465; http://dx.doi.org/ 10.1016/j.chom.2009.08.004 [DOI] [PubMed] [Google Scholar]
- [28].Yang CS, Kim JJ, Lee HM, Jin HS, Lee SH, Park JH, Kim SJ, Kim JM, Han YM, Lee MS, et al.. The AMPK-PPARGC1A pathway is required for antimicrobial host defense through activation of autophagy. Autophagy 2014; 10:785-802; PMID:24598403; http://dx.doi.org/ 10.4161/auto.28072 [DOI] [PMC free article] [PubMed] [Google Scholar]
- [29].Mizushima N, Yoshimori T, Levine B. Methods in mammalian autophagy research. Cell 2010; 140:313-26; PMID:20144757; http://dx.doi.org/ 10.1016/j.cell.2010.01.028 [DOI] [PMC free article] [PubMed] [Google Scholar]
- [30].Saitoh T, Fujita N, Jang MH, Uematsu S, Yang BG, Satoh T, Omori H, Noda T, Yamamoto N, Komatsu M, et al.. Loss of the autophagy protein Atg16L1 enhances endotoxin-induced IL-1β production. Nature 2008; 456:264-8; PMID:18849965; http://dx.doi.org/ 10.1038/nature07383 [DOI] [PubMed] [Google Scholar]
- [31].Funderburk SF, Wang QJ, Yue Z. The Beclin 1-VPS34 complex–at the crossroads of autophagy and beyond. Trends Cell Biol 2010; 20:355-62; PMID:20356743; http://dx.doi.org/ 10.1016/j.tcb.2010.03.002 [DOI] [PMC free article] [PubMed] [Google Scholar]
- [32].Wirth M, Joachim J, Tooze SA. Autophagosome formation–the role of ULK1 and Beclin1-PI3KC3 complexes in setting the stage. Semin Cancer Biol 2013; 23:301-9; PMID:23727157; http://dx.doi.org/ 10.1016/j.semcancer.2013.05.007 [DOI] [PubMed] [Google Scholar]
- [33].Matsunaga K, Noda T, Yoshimori T. Binding rubicon to cross the rubicon. Autophagy 2009; 5:876-7; PMID:19550146; http://dx.doi.org/ 10.4161/auto.9098 [DOI] [PubMed] [Google Scholar]
- [34].Zhong Y, Wang QJ, Li X, Yan Y, Backer JM, Chait BT, Heintz N, Yue Z. Distinct regulation of autophagic activity by Atg14L and Rubicon associated with Beclin 1-phosphatidylinositol-3-kinase complex. Nat Cell Biol 2009; 11:468-76; PMID:19270693; http://dx.doi.org/ 10.1038/ncb1854 [DOI] [PMC free article] [PubMed] [Google Scholar]
- [35].Sun Q, Zhang J, Fan W, Wong KN, Ding X, Chen S, Zhong Q. The RUN domain of rubicon is important for hVps34 binding, lipid kinase inhibition, and autophagy suppression. J Biol Chem 2011; 286:185-91; PMID:21062745; http://dx.doi.org/ 10.1074/jbc.M110.126425 [DOI] [PMC free article] [PubMed] [Google Scholar]
- [36].Vieira OV, Botelho RJ, Rameh L, Brachmann SM, Matsuo T, Davidson HW, Schreiber A, Backer JM, Cantley LC, Grinstein S. Distinct roles of class I and class III phosphatidylinositol 3-kinases in phagosome formation and maturation. J Cell Biol 2001; 155:19-25; PMID:11581283; http://dx.doi.org/ 10.1083/jcb.200107069 [DOI] [PMC free article] [PubMed] [Google Scholar]
- [37].Liang Q, Chang B, Brulois KF, Castro K, Min CK, Rodgers MA, Shi M, Ge J, Feng P, Oh BH, et al.. Kaposi's sarcoma-associated herpesvirus K7 modulates Rubicon-mediated inhibition of autophagosome maturation. J Virol 2013; 87:12499-503; PMID:24027317; http://dx.doi.org/ 10.1128/JVI.01898-13 [DOI] [PMC free article] [PubMed] [Google Scholar]
- [38].Weiss G, Schailble UE. Macrophage defense mechanisms against intracellular bacteria. Immunol Rev 2015; 264:182-203; PMID:25703560; http://dx.doi.org/ 10.1111/imr.12266 [DOI] [PMC free article] [PubMed] [Google Scholar]
- [39].Jo EK. Autophagy as an innate defense against mycobacteria. Pathog Dis 2013; 67:108-18; PMID:23620156; http://dx.doi.org/ 10.1111/2049-632X.12023 [DOI] [PubMed] [Google Scholar]
- [40].Frankel LB, Lund AH. MicroRNA regulation of autophagy. Carcinogenesis 2012; 33:2018-25; PMID:22902544; http://dx.doi.org/ 10.1093/carcin/bgs266 [DOI] [PubMed] [Google Scholar]
- [41].Holla S, Kurowska-Stolarska M, Bayry J, Balaji KN. Selective inhibition of IFNG-induced autophagy by Mir155- and Mir31-responsive WNT5A and SHH signaling. Autophagy 2014; 10:311-30; PMID:24343269; http://dx.doi.org/ 10.4161/auto.27225 [DOI] [PMC free article] [PubMed] [Google Scholar]
- [42].Wang J, Yang K, Zhou L, Minhaowu , Wu Y, Zhu M, Lai X, Chen T, Feng L, Li M, et al.. MicroRNA-155 promotes autophagy to eliminate intracellular mycobacteria by targeting Rheb. PLoS Pathog 2013; 9:e1003697; PMID:24130493; http://dx.doi.org/ 10.1371/journal.ppat.1003697 [DOI] [PMC free article] [PubMed] [Google Scholar]
- [43].Kim JK, Yuk JM, Kim SY, Kim TS, Jin HS, Yang CS, Jo EK. MicroRNA-125a inhibits autophagy activation and antimicrobial responses during mycobacterial Infection. J Immunol 2015; 194:5355-65; PMID:25917095; http://dx.doi.org/ 10.4049/jimmunol.1402557 [DOI] [PubMed] [Google Scholar]
- [44].Duan X, Zhang T, Ding S, Wei J, Su C, Liu H, Xu G. microRNA-17-5p modulates Bacille Calmette-Guerin growth in RAW264.7 cells by targeting ULK1. PLoS One 2015; 10:e0138011; PMID:26384021; http://dx.doi.org/ 10.1371/journal.pone.0138011 [DOI] [PMC free article] [PubMed] [Google Scholar]
- [45].Ouimet M, Koster S, Sakowski E, Ramkhelawon B, van Solingen C, Oldebeken S, Karunakaran D, Portal-Celhay C, Sheedy FJ, Ray TD, et al.. Mycobacterium tuberculosis induces the miR-33 locus to reprogram autophagy and host lipid metabolism. Nat Immunol 2016; 6:677-686; PMID:NOT_FOUND; http://dx.doi.org/ 10.1038/ni.3434 [DOI] [PMC free article] [PubMed] [Google Scholar]
- [46].Keller A, Leidinger P, Vogel B, Backes C, ElSharawy A, Galata V, Mueller SC, Marquart S, Schrauder MG, Strick R, et al.. miRNAs can be generally associated with human pathologies as exemplified for miR-144. BMC Med 2014; 12:224; PMID:25465851; http://dx.doi.org/ 10.1186/s12916-014-0224-0 [DOI] [PMC free article] [PubMed] [Google Scholar]
- [47].Spinelli SV, Diaz A, D'Attilio L, Marchesini MM, Bogue C, Bay ML, Bottasso OA. Altered microRNA expression levels in mononuclear cells of patients with pulmonary and pleural tuberculosis and their relation with components of the immune response. Mol Immunol 2013; 53:265-9; PMID:22964481; http://dx.doi.org/ 10.1016/j.molimm.2012.08.008 [DOI] [PubMed] [Google Scholar]
- [48].Rohde K, Yates RM, Purdy GE, Russell DG. Mycobacterium tuberculosis and the environment within the phagosome. Immunol Rev 2007; 219:37-54; PMID:17850480; http://dx.doi.org/ 10.1111/j.1600-065X.2007.00547.x [DOI] [PubMed] [Google Scholar]
- [49].Bradfute SB, Castillo EF, Arko-Mensah J, Chauhan S, Jiang S, Mandell M, Deretic V. Autophagy as an immune effector against tuberculosis. Curr Opin Microbiol 2013; 16:355-65; PMID:23790398; http://dx.doi.org/ 10.1016/j.mib.2013.05.003 [DOI] [PMC free article] [PubMed] [Google Scholar]
- [50].Delgado MA, Elmaoued RA, Davis AS, Kyei G, Deretic V. Toll-like receptors control autophagy. EMBO J 2008; 27:1110-21; PMID:18337753; http://dx.doi.org/ 10.1038/emboj.2008.31 [DOI] [PMC free article] [PubMed] [Google Scholar]
- [51].Sanjuan MA, Dillon CP, Tait SW, Moshiach S, Dorsey F, Connell S, Komatsu M, Tanaka K, Cleveland JL, Withoff S, et al.. Toll-like receptor signalling in macrophages links the autophagy pathway to phagocytosis. Nature 2007; 450:1253-7; PMID:18097414; http://dx.doi.org/ 10.1038/nature06421 [DOI] [PubMed] [Google Scholar]
- [52].Gutierrez MG, Master SS, Singh SB, Taylor GA, Colombo MI, Deretic V. Autophagy is a defense mechanism inhibiting BCG and Mycobacterium tuberculosis survival in infected macrophages. Cell 2004; 119:753-66; PMID:15607973; http://dx.doi.org/ 10.1016/j.cell.2004.11.038 [DOI] [PubMed] [Google Scholar]
- [53].El-Asrag ME, Sergouniotis P, McKibbin M, Plagnol V, Sheridan E, Waseem N, Abdelhamed Z, McKeefry D, Van Schil K, Poulter JA, et al.. Biallelic mutations in the autophagy regulator DRAM2 cause retinal dystrophy with early macular involvement. Am J Hum Genet 2015; 96:948-54; PMID:25983245; http://dx.doi.org/ 10.1016/j.ajhg.2015.04.006 [DOI] [PMC free article] [PubMed] [Google Scholar]
- [54].Zeng CW, Chen ZH, Zhang XJ, Han BW, Lin KY, Li XJ, Wei PP, Zhang H, Li Y, Chen YQ. MIR125B1 represses the degradation of the PML-RARA oncoprotein by an autophagy-lysosomal pathway in acute promyelocytic leukemia. Autophagy 2014; 10:1726-37; PMID:25126724; http://dx.doi.org/ 10.4161/auto.29592 [DOI] [PMC free article] [PubMed] [Google Scholar]
- [55].Kang R, Zhe HJ, Lotze MT, Tang D. The Beclin 1 network regulates autophagy and apoptosis. Cell Death Differ 2011; 18:571-80; PMID:21311563; http://dx.doi.org/ 10.1038/cdd.2010.191 [DOI] [PMC free article] [PubMed] [Google Scholar]
- [56].Liang C, Feng P, Ku B, Dotan I, Canaani D, Oh BH, Jung JU. Autophagic and tumour suppressor activity of a novel Beclin1-binding protein UVRAG. Nat Cell Biol 2006; 8:688-99; PMID:16799551; http://dx.doi.org/ 10.1038/ncb1426 [DOI] [PubMed] [Google Scholar]
- [57].Liang C, Lee JS, Inn KS, Gack MU, Li Q, Roberts EA, Vergne I, Deretic V, Feng P, Akazawa C, et al.. Beclin1-binding UVRAG targets the class C Vps complex to coordinate autophagosome maturation and endocytic trafficking. Nat Cell Biol 2008; 10:776-87; PMID:18552835; http://dx.doi.org/ 10.1038/ncb1740 [DOI] [PMC free article] [PubMed] [Google Scholar]
- [58].Clemens DL, Horwitz MA. Characterization of the Mycobacterium tuberculosis phagosome and evidence that phagosomal maturation is inhibited. J Exp Med 1995; 181:257-70; PMID:7807006; http://dx.doi.org/ 10.1084/jem.181.1.257 [DOI] [PMC free article] [PubMed] [Google Scholar]
- [59].Crighton D, Wilkinson S, O'Prey J, Syed N, Smith P, Harrison PR, Gasco M, Garrone O, Crook T, Ryan KM. DRAM, a p53-induced modulator of autophagy, is critical for apoptosis. Cell 2006; 126:121-34; PMID:16839881; http://dx.doi.org/ 10.1016/j.cell.2006.05.034 [DOI] [PubMed] [Google Scholar]
- [60].van der Vaart M, Korbee CJ, Lamers GE, Tengeler AC, Hosseini R, Haks MC, Ottenhoff TH, Spaink HP, Meijer AH. The DNA damage-regulated autophagy modulator DRAM1 links mycobacterial recognition via TLR-MYD88 to authophagic defense. Cell Host Microbe 2014; 15:753-67; PMID:24922577; http://dx.doi.org/ 10.1016/j.chom.2014.05.005 [DOI] [PubMed] [Google Scholar]
- [61].Yang CS, Shin DM, Kim KH, Lee ZW, Lee CH, Park SG, Bae YS, Jo EK. NADPH oxidase 2 interaction with TLR2 is required for efficient innate immune responses to mycobacteria via cathelicidin expression. J Immunol 2009; 182:3696-705; PMID:19265148; http://dx.doi.org/ 10.4049/jimmunol.0802217 [DOI] [PubMed] [Google Scholar]
- [62].Kim JJ, Lee HM, Shin DM, Kim W, Yuk JM, Jin HS, Lee SH, Cha GH, Kim JM, Lee ZW, et al.. Host cell autophagy activated by antibiotics is required for their effective antimycobacterial drug action. Cell Host Microbe 2012; 11:457-68; PMID:22607799; http://dx.doi.org/ 10.1016/j.chom.2012.03.008 [DOI] [PubMed] [Google Scholar]
- [63].Watson RO, Manzanillo PS, Cox JS. Extracellular M. tuberculosis DNA targets bacteria for autophagy by activating the host DNA-sensing pathway. Cell 2012; 150:803-15; PMID:22901810; http://dx.doi.org/ 10.1016/j.cell.2012.06.040 [DOI] [PMC free article] [PubMed] [Google Scholar]
- [64].Mariotti S, Pardini M, Gagliardi MC, Teloni R, Giannoni F, Fraziano M, Lozupone F, Meschini S, Nisini R. Dormant Mycobacterium tuberculosis fails to block phagosome maturation and shows unexpected capacity to stimulate specific human T lymphocytes. J Immunol 2013; 191:274-82; PMID:23733870; http://dx.doi.org/ 10.4049/jimmunol.1202900 [DOI] [PubMed] [Google Scholar]
- [65].Farkas T, Daugaard M, Jäättelä M. Identification of small molecule inhibitors of phosphatidylinositol 3-kinase and autophagy. J Biol Chem 2011; 286:38904-12; PMID:21930714; http://dx.doi.org/ 10.1074/jbc.M111.269134 [DOI] [PMC free article] [PubMed] [Google Scholar]
- [66].Yang CS, Kim JJ, Kim TS, Lee PY, Kim SY, Lee HM, Shin DM, Nguyen LT, Lee MS, Jin HS, et al.. Small heterodimer partner interacts with NLRP3 and negatively regulates activation of the NLRP3 inflammasome. Nat Commun 2015; 6:6115; PMID:25655831; http://dx.doi.org/ 10.1038/ncomms7115 [DOI] [PMC free article] [PubMed] [Google Scholar]
Associated Data
This section collects any data citations, data availability statements, or supplementary materials included in this article.