
Figure 2.
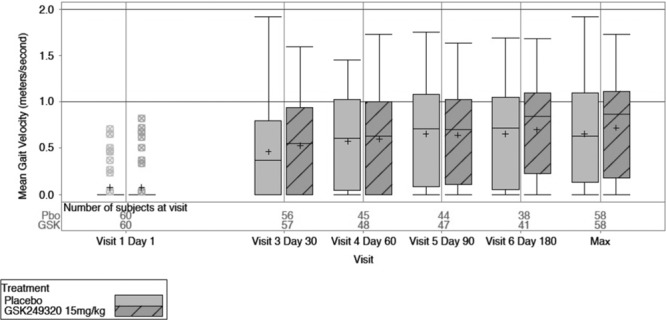
Box-and-whisker plots of gait velocity change over time and maximum value for the 2 treatment arms (intent-to-treat group).
Official websites use .gov
A
.gov website belongs to an official
government organization in the United States.
Secure .gov websites use HTTPS
A lock (
) or https:// means you've safely
connected to the .gov website. Share sensitive
information only on official, secure websites.
Box-and-whisker plots of gait velocity change over time and maximum value for the 2 treatment arms (intent-to-treat group).