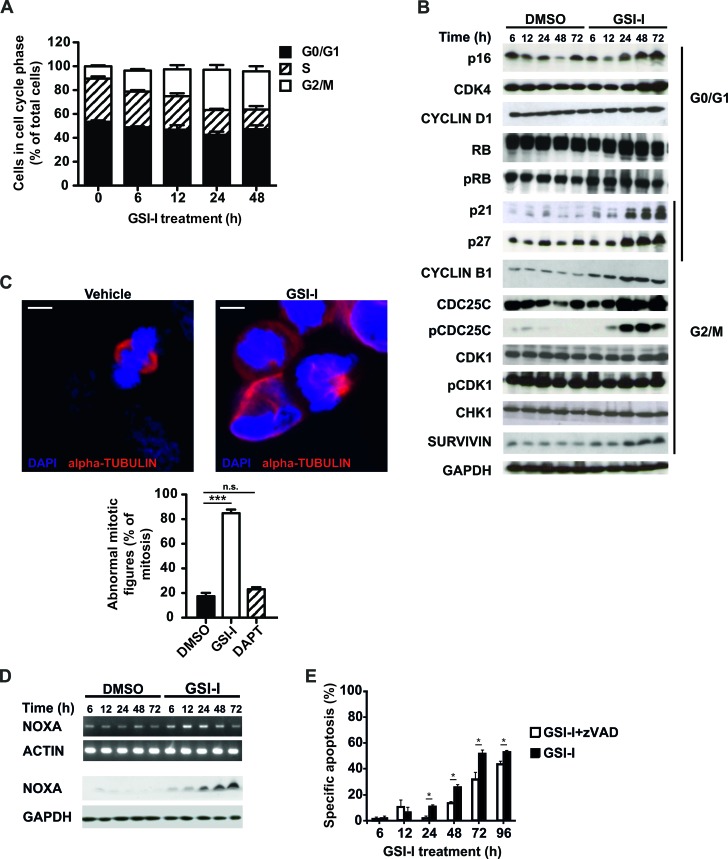
Figure 4. GSI-I activates the G2/M checkpoint and induces mitotic dysfunction in SK-N-BE(2)C NB cells.
A. GSI-I induces G2/M cell cycle arrest. SK-N-BE(2)C cells were treated with 1.5 μM GSI-I for the indicated times. Cells in G1, S and G2/M phases were determined by FACS analysis. Means and SD were calculated from three independent experiments. B. GSI-I-induced cell cycle arrest is p53-independent and associated with increased p16, CDK4, p21, p27, CYCLIN B1, CDC25C, pCDC25C and SURVIVIN. Protein lysates of SK-N-BE(2)C cells treated with 1.5 μM GSI-I were subjected to Western blot analysis. Experiments were repeated three times, with similar results. C. GSI-I induces mitotic dysfunction. SK-N-BE(2)C cells were treated on cover slips with 1.5 μM GSI-I or DAPT for 24 h. Formalin-fixed samples were stained for α-tubulin (red) and DNA (blue). The graph shows the quantification of aberrant mitotic figures and is presented as percent of total mitotic figures. Bars equal 5 μm. Experiments were repeated three times, with similar results. Shown are means and SD from three independent experiments and p-values were calculated using the t-test. *** p<0.001; n.s. not significant. D. GSI-I increases NOXA mRNA and protein. NOXA in GSI-I-treated SK-N-BE(2)C cells was determined by semi-quantitative RT-PCR (upper panels) and Western blot (lower panels). Experiments were repeated three times, with similar results. E. GSI-I-induced apoptosis is partially dependent on caspases. SK-N-BE(2)C cells were treated with 1.5 μM GSI-I in the presence or absence of zVAD.fmk. Hypodiploid propidium iodide-stained nuclei were determined by FACS analysis. Means and SD were calculated from three independent experiments and p-values were determined using the unpaired t-test; *p<0.05.

