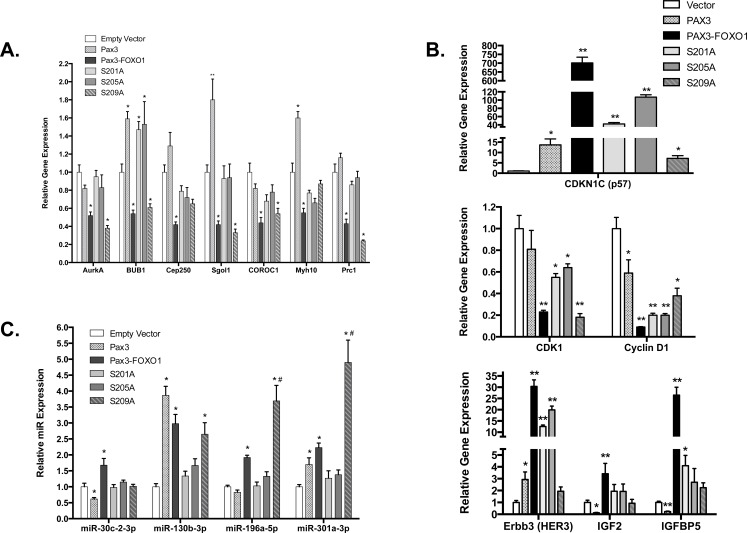
Figure 3. Quantitative RT-PCR analysis for aneuploidy mRNA (A), proliferation mRNA (B) and miRNA (C).
Total RNA was isolated from stably transduced cells [empty vector (white), PAX3 (stippled), PAX3-FOXO1 (black), or the phosphomutants S201A (light gray), S205A (medium gray), or S209A (hashed gray). Quantitative RT-PCR was performed using primers specific for the indicated mRNA A. and B. or microRNA C., as described in the Materials and Methods. Error bars represent the standard deviation from three independent determinations and P-values were computed using non-parametric two-way ANOVA analyses. The asterisk indicates statistical comparisons between empty vector and each sample (*P = 0.001, **P < 0.0001). The hash-tap indicates comparisons between wild-type PAX3-FOXO1 and the sample (#P = 0.001).

