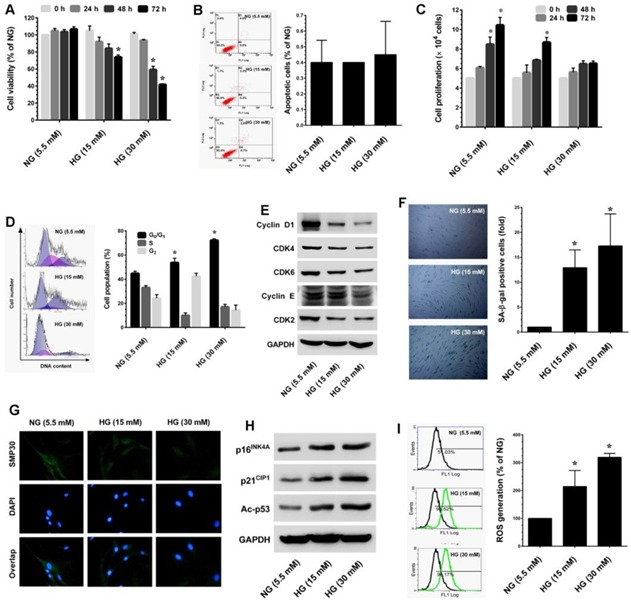
Figure 1. High-glucose (HG) accelarates stess-induced premature senescence in dermal fiboblasts.

A. HNDFs were incubated with increasing concentrations of HG (15 and 30 mM) for 24-72 h. Cell viability was measured by MTT assay. The percentage of viable cells was compared with normal glucose (NG, 5.5 mM). B. Apoptosis was determined by Annexin-V/PI staining. Percentages of apoptotic cells are shown in the histogram. C. To determine cell proliferation, HNDFs 5 × 10⁴ cells/well in a 6-well plate were incubated with HG for 72 h. Number of viable cells was quantified by the tryphan blue exclusion method using a hemocytometer. D. Cell-cycle distribution was measured by flow cytometer using propidium iodide (PI). Percentage of cell population are shown in the histogram. E. Immunoblotting was performed to determine the expression levels of cell-cycle regulatory proteins including cyclin D1, cyclin E, CDK4, CDK6 and CDK2. GAPDH served as an internal control. F. Cellular senescence was determined by senescence-associated β-galactosidase (SA-β-gal) assay as desceribed in Materials and Methods. The left panel shows representative figures and the right panel shows quantitative analysis of SA-β-gal positive cells per microscopic field. G. Immunofluroscence analysis shows expression and localization of SMP30 in HG-treated HNDFs. H. Western blot analysis shows the protein expression levels of p16INK4A, p21CIP1, and p53 acetylation in HG-induced HNDFs. GAPDH served as an internal control. I. The intracellular ROS level was dertermined by flow cytometry using DCH-DA flurogenic probe. Left panel shows representative figures and the right pane shows quantitative analysis of intracellular ROS in HG-treated HNDFs. Results are expressed as mean ± S.E.M of three indipendent expriments. Statistical significance was set at *P < 0.05 compared to NG vs. HG.
