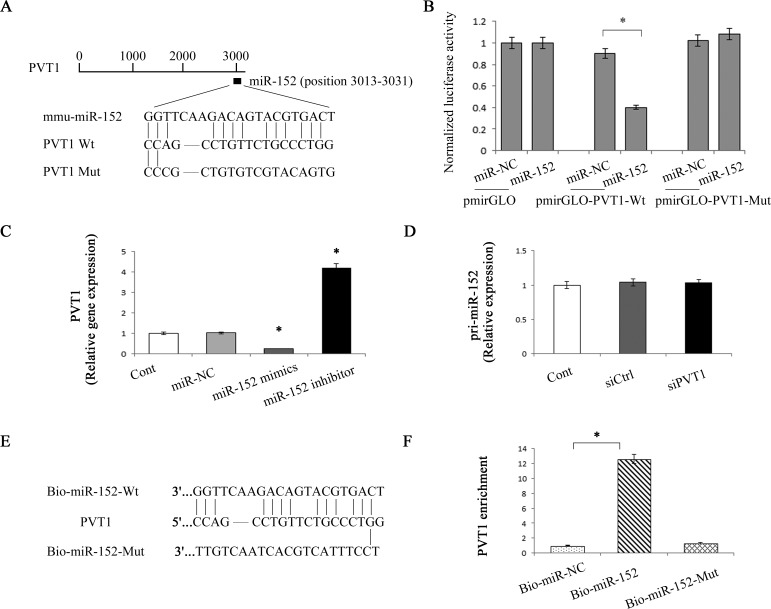
Figure 6. Interaction between PVT1 and miR-152.
A. Schematic diagram of the miR-152 binding site in the PVT1 based on RNA22 software. B. Relative luciferase activities of luciferase reporters harboring the wild-type or mutant PVT1 were analyzed 48 h following transfection with the miR-152 mimics or miR-NC. C. Relative gene expression of PVT1 was analyzed by qRT-PCR in cells transfected with miR-152 mimics or inhibitor. D. Relative gene expression of pri-miR-152 was analyzed by qRT-PCR in cells transfected with siPVT1. E. Schematic diagram of wild type and the mutated form of miR-152 sequence. F. Pull down assay to validate the direct interaction between PVT1 and miR-152. Bio-miR-NC is not complementary to PVT1. *P < 0.05 compared to the control. Each value is the mean ± SD of three experiments.

