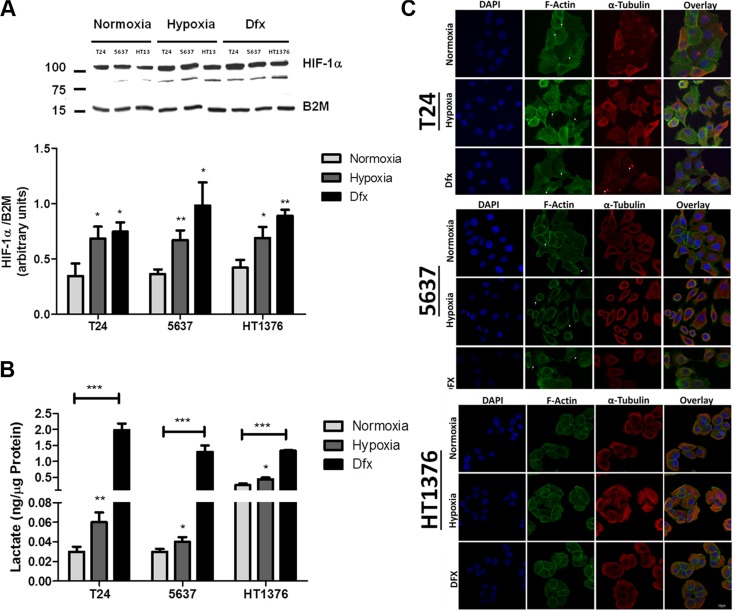
Figure 2. Molecular and morphological changes induced by hypoxia in bladder cancer cell lines.
(A) Variations in HIF-1α in bladder cancer cells (T24, 5637, HT1376) exposed to hypoxia (0.1% O2; 24 h for T24 and 5637 and 6 h for HT1376) and Dfx in relation to normoxia (21.0% O2). All cell lines significantly increased the levels of HIF-1α in hypoxia and Dfx when compared to normoxia. (B) Lactate production in bladder cancer cells under normoxia, hypoxia and Dfx exposure. Growth under hypoxia or in the presence of Dfx promoted a significant increase in lactate production, which was more pronounced for Dfx conditions. These observations denote a shift towards anaerobic metabolism. (C) Effect of hypoxia on bladder cancer cell morphology and actin/tubulin cytoskeleton organization. F-actin and tubulin staining was performed in PFA fixed cells after exposure to normoxic, hypoxic and DFX conditions for 24 h (T24 and 5637) or 6 h (HT1376). F-actin was stained with Phalloidin-FITC (green), while α-tubulin was stained with a monoclonal antibody following incubation with an AlexaFluor594 secondary antibody (red). In turn, nuclei were counterstained with DAPI (blue). Scale bar represents 10 μm. Normoxic T24 cells form aggregated islands with evident actin staining at cell-cell adhesion sites (arrowheads). Membranes of outer cells present reduced projections and some actin stress fibbers are visible (arrows). Under hypoxic conditions, these cells present dissociated and scattered cell aggregates with pronounced and abundant actin filopodia (arrows) present at cell periphery. In comparison to normoxic conditions, less stress fibbers are visible. When exposed to DFX, T24 cells present an intermediate cell morphology between normoxia and hypoxia. Cell aggregates are not as cohesive as in normoxia and not as scattered as in hypoxia. Cells show reduced cell filopodia and exhibit abundant stress fibbers (arrows) co-localized with α-tubulin-rich focal adhesions (arrows). Under normoxia, 5637 cells present loosed islands with fewer cell-cell contact points (arrows) than the other cell lines. Short filopodia is seen at the cell periphery (arrows). In hypoxic conditions, 5637 cells appear as isolated cells with heterogeneous morphology. Pronounced, abundant and long actin filopodia (arrows) is present at cell periphery and no stress fibbers are visible. DFX exposure of these cells results in an intermediate cell morphology between normoxia and hypoxia. Cell islands seem to disperse and adhesion contacts are mainly established through cellular projections (arrows). Cell periphery exhibits lamellipodia and long filopodia. In both normoxic and hypoxic conditions, HT1376 cells form small cell islands, establishing cell contact through minor cell projections. Cell-cell adhesion areas are less enriched in actin filaments and no stress fibbers are visible. Under DFX exposure, cell islands are more cohesive with intense actin staining at cell-cell adhesion contacts. Cell periphery does not present filopodia nor lamellipodia. In resume, exposure to hypoxia drives cells to accumulate hypoxia marker HIF-1α, shift towards an anaerobic metabolism and to significant morphological alterations towards a less cohesive cell phenotype. These alterations are significantly more pronounced under Dfx exposure, highlighting the role of HIF-1α in the establishment of molecular alterations associated with hypoxia. Graphs represent average value of three independent experiments, *p < 0.05; **p < 0.01; ***p < 0.001 (Student's T-test).

