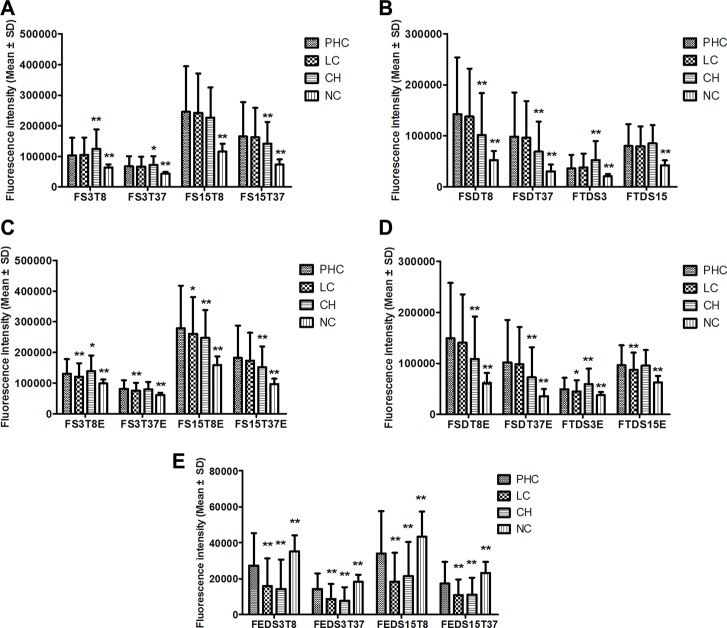
Figure 2. The serum fluorescence intensities of the PHC, LC, CH and NC groups.
(A–E) The comparisons of different sub-groups of fluorescence indicators between PHC and LC, CH or NC. *P < 0.05, **P < 0.01, compared with the PHC group by multiple comparisons (Dunnett's T3 test) after ANOVA. PHC: primary hepatic carcinoma; LC: liver cirrhosis; CH: chronic hepatitis; NC: normal control. The names of the fluorescence indicators are combinations of several abbreviations representing the fluorescence intensity (F) of 3 μL (S3) or 15 μL (S15) of serum at a detection temperature of 8°C (T8) or 37°C (T37) in the presence of EvaGreen (E). Moreover, the names indicate differences for two indicators between 3 μL and 15 μL (SD) of serum, for two temperatures of 8°C and 37°C (TD) and for the presence or absence of EvaGreen (ED).

