

Abstract
Cancer is the leading cause of death among Asian Americans, Native Hawaiians, and Pacific Islanders (AANHPIs). In this report, the American Cancer Society presents AANHPI cancer incidence from the National Cancer Institute, the Centers for Disease Control and Prevention, and the North American Association of Central Cancer Registries and mortality from the National Center for Health Statistics. Among AANHPIs in 2016, there will be an estimated 57,740 new cancer cases and 16,910 cancer deaths. While AANHPIs have 30%–40% lower incidence and mortality rates than NHWs for all cancers combined, they have higher rates for some infection-related cancers (stomach, liver, nasopharynx).The aggregation of AANHPI subgroups conceals the diversity of these heterogeneous populations. AANHPI cancer rates vary by subgroup, with the lowest rates generally in Asian Indians/Pakistanis and the highest in Native Hawaiians, Samoans, and Japanese (except for infection-related cancers). The male-to-female incidence rate ratio among AANHPIs declined from 1.43 (95% confidence interval [95% CI], 1.36-1.49) in 1992 to 1.04 (95% CI, 1.01-1.07) in 2012 due to declining prostate and lung cancer rates in males and increasing breast cancer rates in females. Liver cancer death rates among AANHPIs declined from 2003 to 2012, in contrast to increases in NHWs. Variation in cancer rates in AANHPIs are related to risk factors including lifestyle factors, use of screening and preventive services, and exposure to cancer-causing infections. Cancer control strategies include improved use of vaccination and screening; interventions to increase physical activity and reduce excess body weight, tobacco use, and alcohol consumption; and subgroup-level research on burden and risk factors.
Introduction
Asian Americans represented 6.3% of the total US population (20 million/318.7 million) in 2014, and are the fastest-growing racial/ethnic group in the US.1, 2 In contrast to Hispanics, the rapid growth in the Asian American population is driven by immigration as opposed to native births.3 The Native Hawaiian and Pacific Islander (NHPI) population (1.5 million) is also one of the fastest-growing populations in the US.1, 4 The term “Asian” refers to a person with origins in the Far East, Southeast Asia, or the Indian subcontinent. This group includes, but is not limited to, Asian Indian, Cambodian, Chinese, Filipino, Hmong, Japanese, Korean, Pakistani, and Vietnamese.2 The term NHPI refers to people with origins in Hawaii, Guam, Samoa, or other Pacific Islands.4 While Asian and NHPI origins have been recognized as distinct racial groups in the US Census since 2000,4 demographic and health data for these two groups are usually combined due to small numbers or for continuity with historical statistics and referred to as “Asian Americans, Native Hawaiians, and Pacific Islanders” (AANHPI). The largest Asian American subpopulation in the US is Chinese (23%), followed by Filipino (20%), Asian Indian (18%), Vietnamese (10%), and Korean (10%).2 The largest NHPI subpopulation is Native Hawaiian (43%), followed by Samoan (15%), Guamanian or Chamorro (12%), and Tongan (5%).4 Ten US states are home to 73% of the AANHPI population; California has the largest proportion with 32%, followed by New York (9%), Texas (7%), Hawaii (5%), and New Jersey (5%).
AANHPI subgroups are diverse in geographic origin, language, immigration and nativity history, and acculturation. Despite this heterogeneity, statistics are generally available only for the aggregate AANHPI group, which masks the vast diversity in the cancer burden between subgroups. In aggregate, the cancer profile of the AANHPI population is distinct from those of other racial and ethnic groups in the United States. While overall and most site-specific cancer rates are lower in this population than in non-Hispanic whites (NHWs), rates of some cancers, such as stomach and liver, are substantially higher. Moreover, cancer rates and risk factors in the AANHPI population and its distinct subpopulations vary by immigration and nativity history, origin, acculturation, and socioeconomic status.5 The American Cancer Society published a report on cancer burden and risk factors in five Asian American subgroups in California in 2007.6 This report updates and expands upon that report using national data including NHPIs and expanded subgroups where possible. Aggregated AANHPI data presented here can be compared to other US aggregated population groups (e.g., NHWs) and historical AANHPI statistics.
Materials and Methods
Incidence and Mortality
Cancer incidence data in the United States are collected and reported by the National Cancer Institute’s (NCI’s) Surveillance, Epidemiology, and End Results (SEER) program and the Centers for Disease Control and Prevention’s (CDC’s) National Program of Cancer Registries (NPCR). The SEER program reports long-term, high-quality, population-based incidence data covering approximately 28% of the US population, including 50% of Asians and 67% of Hawaiian/Pacific Islanders,7 and began coding Asian/Pacific Islander race in 1992. A customized database with incidence data for detailed AANHPI subgroups from the SEER 11 registries (Connecticut, Hawaii, Iowa, New Mexico, Utah, and the metropolitan areas of Atlanta, Detroit, Los Angeles, San Francisco-Oakland, San Jose-Monterey, and Seattle-Puget Sound) plus Greater California and New Jersey for 1990–2010 was the source for 5-year (2006–2010) average annual incidence rates by AANHPI subgroup. This database includes Chinese, Filipinos, Asian Indians/Pakistanis (grouped together according to SEER coding rules), Vietnamese, Koreans, Japanese, Cambodians, Laotians, Native Hawaiians, and Samoans.8 The SEER 13 registries (SEER 11 plus Rural Georgia and the Alaska Native Tumor Registry [except for non-Hispanic Whites]) were the source for graphs of incidence trends from 1992 through 2012.9 The SEER 18 registries (SEER 13 registries plus Greater Georgia, Greater California, Kentucky, Louisiana, and New Jersey) were the source for the lifetime probability of developing cancer (2010–2012), age-adjusted stage distribution10 (2008–2012), and 5-year cause-specific survival rates (2005–2011).11 Cause-specific survival is a net survival measure that relies on specified diagnosis and cause of death instead of life tables, which are necessary for calculation of relative survival and historically unavailable for populations other than whites and blacks.12 Stage at diagnosis was classified based on SEER summary stage 2000. The lifetime probability of developing cancer was calculated using the NCI’s DevCan software (version 6.7.3).
The North American Association of Central Cancer Registries (NAACCR) compiles and reports incidence data for 1995 onward from cancer registries that participate in the SEER program and/or the NPCR (5 states receive funding from both programs). Population coverage for these data has increased over time and is 96% overall and 97% for AANHPIs during 2008 through 2012. Data that met NAACCR high-quality standards were the source for 5-year average annual incidence rates (2008–2012) and the 2016 new cancer case projections (2003–2012).13 Data from 24 states (Arizona, California, Colorado, Connecticut, Delaware, Florida, Hawaii, Idaho, Illinois, Iowa, Kentucky, Louisiana, Maine, Michigan, Nebraska, New Jersey, New Mexico, New York, Pennsylvania, Rhode Island, Utah, Washington, Wisconsin, Wyoming) and one metro area (Atlanta) meeting NAACCR’s standards, which represent about 77% of the AANHPI population in the US, were the source for Joinpoint analyses using data from 1995 to 2012 to produce ten-year incidence trends (2003–2012).13
Mortality data were obtained from the CDC’s National Center for Health Statistics (NCHS).14 Data from all 50 states and the District of Columbia were the source for Joinpoint analyses using data from 1992 to 2012 to produce ten-year incidence trends (2003–2012). Long-term mortality trends for non-Hispanic Whites from 1992–2012 exclude both Oklahoma and New Hampshire because these states did not collect information on Hispanic origin for one or more years between 1992 and 1996 (Oklahoma, 1992–1996; New Hampshire, 1992). All other mortality statistics were based on data from all 50 states and the District of Columbia.
All cancer cases were classified according to the International Classification of Diseases for Oncology.15, 16 Causes of death were classified according to the International Classification of Diseases (9th and 10th revisions).17, 18 Incidence and death rates for the US were age-adjusted to the 2000 US standard population. All rates are expressed per 100,000 population. SEER*Stat software (version 8.2.1) was used to calculate all US incidence and death rates using population denominator data from US Census Bureau population estimates. Ten-year incidence and death trends are described in terms of the average annual percent change based on the NCI’s Joinpoint regression analysis program (version 4.2.0.1). Trends were deemed increasing or decreasing when the slope of the trend was statistically different from zero (2-sided P value <.05).
Projected Cancer Cases and Deaths in 2016
The precise number of cancer cases diagnosed in the current year is unknown because the availability of incidence and mortality data lags 2 to 4 years due to the time required for data collection, compilation, and dissemination. In addition, cancer registration is incomplete in some states. Therefore, we projected the numbers of new cancer cases and deaths among AANHPIs in the United States in 2016 to provide an estimate of the contemporary cancer burden.
To predict the number of cancer cases diagnosed in AANHPIs in 2016, we estimated the number of cases diagnosed each year from 2003 through 2012 and then projected these counts 4 years ahead. First, age- and sex-specific incidence rates, based on data from 44 states and the District of Columbia that met the NAACCR’s high-quality standards, were applied to the corresponding US Census Bureau’s population estimates to obtain estimated counts. Then, case counts were projected to 2016 based on the average annual percent change from 2003 through 2012 generated by the Joinpoint regression model. Delay adjustment factors from the SEER 18 registries for AANHPIs by sex and cancer site were applied to correct for delayed reporting or updated cases. The number of cancer deaths was estimated using the annual percent change for the most recent Joinpoint trend based on the actual numbers of cancer deaths from 1998 through 2012. For the complete details of this methodology, please refer to Chen et al.19
Risk factor and screening data
Data on behavioral risk factors (cigarette smoking, excess body weight, physical inactivity, and alcohol consumption), receipt of cancer screening, and vaccination coverage (human papillomavirus [HPV] and hepatitis B virus [HBV]) were obtained from national population-based surveys. For adults, we used the National Health Interview Survey (NHIS)20 and the National Health and Nutrition Examination Survey (NHANES)21 and for adolescents, we used the National Immunization Survey of Teens.22, 23 NHANES is the preferred source of information for body mass index in the United States because height and weight are measured rather than reported by survey participants. Information on adults by AANHPI subgroup from the NHIS allowed for estimates of risk factors and screening for the three largest Asian subgroups (Chinese, Filipinos, and Asian Indians). In contrast, information by AANHPI subgroup is not collected in national surveys of adolescents. The years of risk factor and screening estimates vary based on the availability of data. In some cases, data for 2–3 years were aggregated to achieve a sufficient sample size to produce reliable estimates. All surveys were analyzed using SUDAAN statistical software (version 11.0.1; RTI International, Research Triangle Park, NC) to obtain weighted prevalence estimates.
Selected Findings
Overall cancer occurrence
Incidence
In 2016, an estimated 57,740 new cancer cases are expected to be diagnosed among AANHPIs (Figure 1). According to these estimates, the most commonly diagnosed cancers among males will be prostate (18%), followed by lung (14%) and colorectum (12%). Among females, the three most commonly diagnosed cancers will be breast (34%), thyroid (10%), and lung (9%).
Figure 1. Leading sites of new cancer cases and deaths among AANHPIs, 2016 estimates.

AANHPI = Asian American, Native Hawaiian, and Pacific Islander
*Excludes basal cell and squamous cell skin cancers and in situ carcinoma except urinary bladder.
The lifetime probability of developing cancer among AANHPIs is lower in both males and females compared with NHWs (Table 1). Cancer risk among AANHPIs is lower than that among NHWs overall and for the four most common cancers (breast, lung, colorectum, and prostate) (Table 2). However, AANHPIs have higher risk for some infection-related cancers, such as stomach, liver, and nasopharynx.
Table 1.
Probability (%) of Developing Invasive Cancer Among AANHPIs over Selected Age Intervals by Sex, US, 2010-2012*
| Birth to 49 | 50 to 59 | 60 to 69 | 70 and Older | Birth to Death | ||
|---|---|---|---|---|---|---|
| All Sites† | Male | 2.2 (1 in 46) | 3.8 (1 in 26) | 9.0 (1 in 11) | 29.2 (1 in 3) | 36.2 (1 in 3) |
| Female | 4.5 (1 in 22) | 4.7 (1 in 21) | 7.1 (1 in 14) | 22.6 (1 in 4) | 33.3 (1 in 3) | |
|
| ||||||
| Breast | Female | 1.8 (1 in 56) | 2.0 (1 in 50) | 2.7 (1 in 37) | 4.7 (1 in 21) | 10.3 (1 in 10) |
|
| ||||||
| Colon & rectum | Male | 0.3 (1 in 347) | 0.6 (1 in 159) | 1.2 (1 in 86) | 3.9 (1 in 25) | 5.3 (1 in 19) |
| Female | 0.3 (1 in 377) | 0.5 (1 in 214) | 0.8 (1 in 130) | 3.5 (1 in 29) | 4.6 (1 in 22) | |
|
| ||||||
|
Liver & intrahepatic
bile duct |
Male | 0.2 (1 in 644) | 0.4 (1 in 249) | 0.6 (1 in 157) | 1.7 (1 in 59) | 2.6 (1 in 39) |
| Female | 0.0 (1 in 2828) | 0.1 (1 in 1152) | 0.2 (1 in 431) | 1.0 (1 in 96) | 1.3 (1 in 78) | |
|
| ||||||
| Lung & bronchus | Male | 0.1 (1 in 789) | 0.4 (1 in 229) | 1.3 (1 in 78) | 6.0 (1 in 17) | 6.8 (1 in 15) |
| Female | 0.1 (1 in 823) | 0.3 (1 in 318) | 0.8 (1 in 128) | 3.6 (1 in 28) | 4.4 (1 in 23) | |
|
| ||||||
| Prostate | Male | 0.1 (1 in 1086) | 0.8 (1 in 122) | 3.0 (1 in 33) | 7.0 (1 in 14) | 9.4 (1 in 11) |
|
| ||||||
| Stomach | Male | 0.1 (1 in 1411) | 0.2 (1 in 640) | 0.4 (1 in 273) | 1.8 (1 in 57) | 2.1 (1 in 49) |
| Female | 0.1 (1 in 1500) | 0.1 (1 in 1155) | 0.2 (1 in 491) | 1.2 (1 in 84) | 1.4 (1 in 70) | |
|
| ||||||
| Thyroid | Male | 0.2 (1 in 605) | 0.1 (1 in 878) | 0.2 (1 in 683) | 0.2 (1 in 420) | 0.6 (1 in 163) |
| Female | 0.7 (1 in 136) | 0.3 (1 in 291) | 0.3 (1 in 302) | 0.5 (1 in 209) | 1.8 (1 in 55) | |
|
| ||||||
| Uterine cervix | Female | 0.2 (1 in 537) | 0.1 (1 in 917) | 0.1 (1 in 901) | 0.3 (1 in 372) | 0.6 (1 in 156) |
AANHPI = Asian American, Native Hawaiian, and Pacific Islander
For those free of cancer at beginning of each age interval. Based on cancer cases diagnosed during 2010 to 2012.
All Sites exclude basal and squamous cell skin cancers and in situ cancers except urinary bladder.
Source: DevCan: Probability of Developing or Dying of Cancer Software, Version 6.7.3. Statistical Research and Applications Branch, National Cancer Institute, 2013.
Table 2.
Cancer incidence and mortality rates and rate ratios comparing AANHPIs with NHWs, 2008 to 2012
| Incidence | Mortality | |||||||||||
|---|---|---|---|---|---|---|---|---|---|---|---|---|
|
|
||||||||||||
| Male | Female | Male | Female | |||||||||
|
|
||||||||||||
| AANHPI | NHW | Rate ratio* | AANHPI | NHW | Rate ratio* | AANHPI | NHW | Rate ratio* | AANHPI | NHW | Rate ratio* | |
| All sites | 316.8 | 528.9 | 0.6† | 287.5 | 436.2 | 0.7† | 128.4 | 210.6 | 0.6† | 91.2 | 149.2 | 0.6† |
| Breast | - | - | - | 88.3 | 128.1 | 0.7† | - | - | - | 11.4 | 21.9 | 0.5† |
| Colorectum | 39.0 | 47.4 | 0.8† | 29.2 | 36.2 | 0.8† | 13.0 | 18.2 | 0.2† | 9.4 | 12.9 | 0.2† |
| Liver and intrahepatic bile duct | 20.6 | 9.3 | 2.2† | 7.9 | 3.2 | 2.5† | 14.5 | 7.6 | 1.9† | 6.1 | 3.1 | 2.0† |
| Lung and bronchus | 47.4 | 79.3 | 0.6† | 28.3 | 58.7 | 0.5† | 34.0 | 62.2 | 0.5† | 18.2 | 41.4 | 0.4† |
| Nasopharynx | 3.5 | 0.6 | 5.8† | 1.2 | 0.2 | 6.0† | 1.3 | 0.2 | 5.9† | 0.4 | 0.1 | 4.6† |
| Prostate | 67.8 | 123.0 | 0.6† | - | - | - | 9.4 | 19.9 | 0.5† | - | - | - |
| Stomach | 14.5 | 7.8 | 1.9† | 8.5 | 3.5 | 2.4† | 7.9 | 3.6 | 2.2† | 4.7 | 1.8 | 2.6† |
| Thyroid | 6.3 | 7.7 | 0.8† | 20.4 | 21.9 | 0.9† | 0.5 | 0.5 | 1.0 | 0.8 | 0.5 | 1.7† |
| Uterine cervix | - | - | - | 6.3 | 7.1 | 0.9† | - | - | - | 1.8 | 2.0 | 0.9† |
AANHPI = Asian American, Native Hawaiian, and Pacific Islander. NHW= non-Hispanic white.
Rates are per 100,000 and age-adjusted to the 2000 US standard population.
Ratio is the unrounded AANHPI rate divided by the corresponding NHW rate
The difference between the rates for AANHPIs and NHWs is significant (P<.05).
Sources: Incidence: North American Association of Central Cancer Registries (NAACCR), 2015. Incidence data for NHWs are based on the NAACCR Hispanic Identification Algorithm (NHIA) and data for AANHPIs are based on the NAACCR Asian Pacific Islander Identification Algorithm (NAPIIA). Mortality: National Center for Health Statistics, Centers for Disease Control and Prevention, 2015. Mortality: National Center for Health Statistics, Centers for Disease Control and Prevention, 2015.
Overall cancer incidence rates are 30% to 40% lower in AANHPIs than in NHWs (Table 2). There is striking variation in cancer incidence rates among AANHPI subgroups. Among males, all-sites incidence rates (per 100,000) in 2006-2010 range from 216.8 among Asian Indians/Pakistanis to 526.5 among Samoans, similar to rates in NHWs (554.1; Figure 2). Among females, rates range from 212.0 among Asian Indians/Pakistanis to 442.8 among Samoans, also similar to NHWs (444.6). For both males and females, the highest rates following Samoans were among Native Hawaiians and Japanese.
Figure 2. Cancer incidence rates* by cancer site, sex, and Asian American, Native Hawaiian, and Pacific Islander ethnic group, 2006–2010.

*Rates based on <25 cases are omitted.
Source: Surveillance, Epidemiology, and End Results (SEER) Program, National Cancer Institute, 2015.
For all cancers combined, incidence trends in AANHPIs mirror those in NHWs (Figure 3). Although incidence rates continue to be slightly higher in AANHPI males than in females, they have been converging over the past two decades due to declining rates in males and relatively stable rates in females. The male-to-female rate ratio among AANHPIs has declined from 1.43 (95% confidence interval [95% CI], 1.36-1.49) in 1992 to 1.04 (95% CI, 1.01-1.07) in 2012. From 2003-2012, overall cancer incidence rates declined by 1.9% among AANHPI males and by 1.5% among NHW males, compared with stable trends in women in both groups (Figure 3, Table 3). Trends in cancer occurrence, particularly among Asian Americans, are influenced not only by the risk factor profiles of those living in the US, but also by the continual stream of newly arrived immigrants.
Figure 3. Trends in incidence and mortality rates for all cancers combined among non-Hispanic whites (NHWs) and Asian Americans, Native Hawaiians, and Pacific Islanders (AANHPIs), 1990–2012.

Sources: Incidence: Surveillance, Epidemiology, and End Results (SEER) Program, National Cancer Institute, 2015. Mortality: National Center for Health Statistics, 2015.
Table 3.
Fixed-interval trends in cancer incidence and mortality rates among AANHPIs and NHWs, 2003 to 2012
| Male | Female | ||||
|---|---|---|---|---|---|
| AANHPI | NHW | AANHPI | NHW | ||
| All sites | Incidence | −1.9* | −1.5* | 0.1 | −0.1 |
| Mortality | −1.6* | −1.6* | −0.9* | −1.3* | |
| Colorectum | Incidence | −2.1* | −3.6* | −2.7* | −3.2* |
| Mortality | −1.8* | −3.0* | −1.5* | −2.9* | |
| Female Breast | Incidence | 0.8* | −0.1 | ||
| Mortality | −1.0* | −1.8* | |||
| Liver & intrahepatic bile duct | Incidence | −1.6 | 3.4* | −1.2 | 2.7* |
| Mortality | −0.8* | 2.9* | −0.6* | 2.0* | |
| Lung & bronchus | Incidence | −1.5* | −2.4* | 0.2 | −0.7* |
| Mortality | −1.6* | −2.5* | −0.4* | −1.2* | |
| Prostate | Incidence | −4.5* | −3.9 | ||
| Mortality | −3.4* | −3.4* | |||
| Stomach | Incidence | −3.0* | −1.2* | −2.8* | −1.7* |
| Mortality | −3.7* | −3.6* | −3.6* | −3.2* | |
| Thyroid | Incidence | 5.0* | 5.6* | 5.3* | 5.5* |
| Mortality | 0.5 | 1.5* | −0.9 | −0.7 | |
| Uterine cervix | Incidence | −3.3* | −1.0 | ||
| Mortality | −3.7* | −0.5 | |||
The average annual percent change from 2003 to 2012 is statistically significantly different from zero
AANHPI = Asian American, Native Hawaiian, and Pacific Islander. NHW = Non-Hispanic White.
Sources: Incidence: North American Association of Central Cancer Registries (NAACCR), 2015. Mortality: National Center for Health Statistics, Centers for Disease Control and Prevention, 2015. Mortality: National Center for Health Statistics, Centers for Disease Control and Prevention, 2015.
Stage at diagnosis and survival
AANHPIs are less likely than NHWs to be diagnosed with cancer at a localized stage (Figure 4). The largest absolute differences are for cancers of the thyroid (10%), cervix (8%), prostate (5%), and lung (3%). The disparity for cervical cancer is attributable to lower access to screening among AANHPIs,24 while it is likely due to less access to healthcare and diagnostic services for thyroid cancer.25
Figure 4. Age-adjusted stage distribution for selected cancers among AANHPIs and NHWs, 2008–2012.

AANHPI= Asian American, Native Hawaiian, and Pacific Islander; NHW= non-Hispanic white
Source: Surveillance, Epidemiology, and End Results (SEER) Program, National Cancer Institute, 2015.
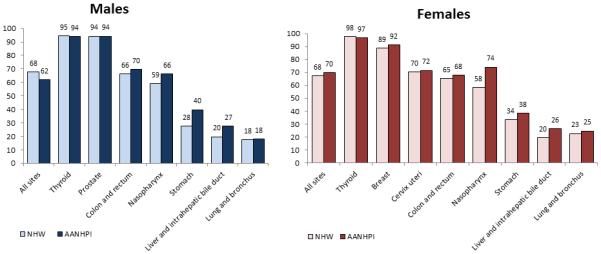
Overall five-year cancer-specific survival among AANHPIs compared with NHWs is lower for males (62% versus 68%) and similar for females (70% versus 68%; Figure 5). Survival is notably higher among AANHPIs for stomach and liver cancers, while it is similar for other major cancer sites (Figure 5). AANHPIs appear to have a paradoxical survival advantage for sites with a relatively poor stage distribution (thyroid, lung, prostate) compared with NHWs. The reasons for this are not well understood, but could be due to differences in tumor biology or lifestyle factors in AANHPIs.26 It could also reflect overestimation of survival in AANHPIs because of a higher likelihood of incomplete follow-up of patients due to lost contact or inability to link to death registries, which is more common for minority groups than NHWs.27 Loss to follow-up is sometimes the result of return migration of the terminally ill, referred to as the “salmon bias”.28 As such, comparisons of survival between racial/ethnic groups should be interpreted with caution.
Figure 5. Five-year cause-specific survival (%) by sex and site for AANHPIs and NHWs, 2005–2011.
AANHPI= Asian American, Native Hawaiian, and Pacific Islander; NHW= non-Hispanic white
Source: Surveillance, Epidemiology, and End Results (SEER) Program, National Cancer Institute, 2015.
Mortality
Cancer has been the leading cause of death among AANHPIs since 2000 (Table 4).29 In 2016, an estimated 16,910 cancer deaths are expected to be occur among AANHPIs (Figure 1). The three leading causes of cancer death are lung (27%), liver (14%), and colorectum (11%) among males, and lung (21%), breast (14%), and colorectum (11%) among females.
Table 4.
Leading Causes of Death among Asian Americans, Native Hawaiians, and Pacific Islanders and Non-Hispanic Whites, US, 2012
|
Asian American, Native Hawaiian,
and Pacific Islander |
Non-Hispanic White | |||||||
|---|---|---|---|---|---|---|---|---|
|
|
||||||||
| Rank |
Number of
deaths |
Percent of total
deaths |
Death rate | Rank |
Number of
deaths |
Percent of total
deaths |
Death rate | |
| Cancer | 1 | 15,340 | 27.2 | 104.2 | 2 | 462,499 | 22.9 | 170.2 |
| Heart disease | 2 | 12,266 | 21.8 | 92.0 | 1 | 481,991 | 23.9 | 171.2 |
| Cerebrovascular diseases | 3 | 4,108 | 7.3 | 30.8 | 4 | 100,154 | 5.0 | 35.5 |
| Accidents (unintentional injuries) | 4 | 2,372 | 4.2 | 15.0 | 5 | 99,288 | 4.9 | 43.7 |
| Diabetes | 5 | 2,158 | 3.8 | 15.7 | 7 | 50,443 | 2.5 | 18.5 |
| Influenza and pneumonia | 6 | 1,745 | 3.1 | 13.9 | 8 | 40,460 | 2.0 | 14.3 |
| Chronic lower respiratory diseases | 7 | 1,624 | 2.9 | 12.8 | 3 | 127,116 | 6.3 | 46.2 |
| Alzheimer's disease | 8 | 1,379 | 2.4 | 11.6 | 6 | 72,772 | 3.6 | 24.9 |
| Suicide | 9 | 1,152 | 2.0 | 6.2 | 9 | 33,727 | 1.7 | 15.7 |
| Nephritis, nephrotic syndrome, & nephrosis | 10 | 1,054 | 1.9 | 8.0 | 10 | 33,105 | 1.6 | 11.8 |
| All causes | 56,352 | 100.0 | 406.1 | 2,016,896 | 100.0 | 742.3 | ||
Rates are per 100,000 and age-adjusted to the 2000 US standard population.
Note: Death rates are no directly comparable to those published in prior years due to updated population denominator data.
Source: National Center for Health Statistics, Centers for Disease Control and Prevention, 2015.
Similar to incidence rates, overall cancer death rates are 40% lower in AANHPIs compared with NHWs, although there is substantial variation by cancer site (Table 2). The rate ratios for mortality are generally consistent with those for incidence, with the exception of thyroid cancer. Compared with NHWs, AANHPIs are 10% to 20% less likely to be diagnosed with thyroid cancer, but equally (males) or more likely (females) to die from the disease. These racial disparities could be attributable to differences in access to early intervention and appropriate, high quality care.30
Cancer death rates have been decreasing since 1992 in AANHPIs, mirroring trends in NHWs (Figure 3). Unlike incidence trends, however, mortality rates in males and females have only slightly converged. The male-to-female rate ratio among AANHPIs has declined from 1.67 (95% CI, 1.58-1.78) in 1990 to 1.36 (95% CI, 1.31-1.41) in 2012. Mortality rates during 2003 to 2012 declined by 1.6% and 0.9% annually among AANHPI males and females, respectively similar to declines in NHWs.
The 4 major cancer sites in the US
Female Breast
Invasive breast cancer is the most commonly diagnosed cancer and the second leading cause of cancer death among AANHPI women, as is the case among NHW women, with a total of 11,090 new cases and 1,180 deaths expected in 2016 (Figure 1). About one in 10 AANHPI women will be diagnosed with breast cancer in her lifetime (Table 1). Age-standardized breast cancer incidence and mortality rates are 30% and 50% lower, respectively, than those in NHWs (Table 2). There is substantial variation in breast cancer incidence rates within the AANHPI population, ranging from 35.0 (per 100,000) in Cambodian women to 135.9 in Native Hawaiian women (Figure 2). Higher rates among those who immigrated more recently are thought to be related to extent of adoption of western behaviors that increase breast cancer risk, such as a later age at childbirth, lower parity, and higher body weight.31 Compared to the US, overall breast cancer incidence rates are generally substantially lower in AANHPI countries of origin;32 however, breast cancer rates among younger cohorts of Asian women are approaching those of US women.33
Breast cancer incidence rates among AANHPI women have been increasing gradually, compared to stable rates in NHWs (Figure 6); from 2003 to 2012, rates in AANHPIs increased by 0.8% annually (Table 3). Reasons for this increase are thought to include changes in factors such as body weight and reproductive patterns following immigration and acculturation,34-36 as well as uptake of mammography.31, 37, 38 Increases in incidence of in situ breast cancers among AANHPIs since 1992 are consistent with increased screening.39 In contrast, breast cancer mortality rates have decreased among AANHPI women. From 1990 to 2012, breast cancer mortality rates decreased by 16% in AANHPIs and 36% in NHW women (Figure 7). These reductions have been attributed to improvements in both treatment and early detection.40
Figure 6. Trends in cancer incidence rates among Asian Americans, Native Hawaiians, and Pacific Islanders by site and sex, 1992–2012.

Source: Surveillance, Epidemiology, and End Results (SEER) Program, National Cancer Institute, 2015.
Figure 7. Trends in cancer mortality rates among Asian Americans, Native Hawaiians, and Pacific Islanders by site and sex, 1990–2012.

Source: National Center for Health Statistics, 2015.
The distribution of breast cancer stage at diagnosis is similar in AANHPIs and NHWs (Figure 4), although 5-year cause-specific survival rates are slightly higher among AANHPI women (Figure 5). However, there are some notable differences in survival by nativity and between AANHPI subgroups in population-based studies. A study in California showed that US-born Asian women are more likely to be diagnosed with breast cancer at a localized stage and have higher survival after adjusting for stage and other prognostic factors than foreign-born women.41 Compared with NHWs, survival is higher in Japanese women but lower among NHPI women.42 Factors thought to contribute to the Japanese survival advantage include lower body weight and healthy diet.42, 43 Survival differences may also reflect biological differences in tumor characteristics.26 A study in California showed that risk of HER2-positive breast cancer subtypes was higher among Korean, Filipina, Vietnamese, and Chinese women compared with NHW women.44
Colorectum
Among AANHPI, an estimated 2,990 men and 2,720 women will be diagnosed with colorectal cancer in 2016 (Figure 1). It is the third leading cause of cancer death among both AANHPI men and women. Incidence and death rates are 20% and 30% lower, respectively, compared to NHWs (Table 2). Among AANHPI subgroups, colorectal cancer incidence rates are lowest in Asian Indians/Pakistanis and highest in Japanese (Figure 2). Higher incidence rates among US-born compared to foreign-born Chinese and Filipino men in a California study point to a higher prevalence of colorectal cancer risk factors, such as obesity, unhealthy diet, physical inactivity, and smoking.45
From 2003 to 2012, colorectal cancer incidence rates among AANHPIs decreased, although slightly less than among NHWs, and mortality rates also declined (Figure 6, Table 3). Long-term declines in incidence and death rates are attributed to changing patterns in risk factors, the uptake of screening, and improved treatments.46, 47 However, the aggregation of AANHPIs masks differences in trends by subgroup. A California study documented increasing colorectal cancer incidence rates in Koreans, Filipinos, and South Asians in California between 1988 and 2007,48 indicating a need for tailored colorectal cancer prevention and early detection interventions targeting these populations. Koreans have among the lowest rates of colorectal cancer screening in California.48
AANHPIs have slightly higher 5-year colorectal cancer-specific survival rates than NHWs (Figure 5). However, one study found differences in outcomes between subgroups, with the highest survival among Japanese, Asian Indians/Pakistanis, and Other Asians, while rates in other groups were similar to those in NHWs.49 Another study found that the survival advantage among Japanese was primarily due to sociodemographic factors, but also reflected specific disease characteristics including stage, grade, and subsite.50
Lung and bronchus
Among AANHPI, an estimated 3,460 men and 3,030 women will be diagnosed with lung cancer in 2016 (Figure 1). Although lung cancer is the leading cause of cancer death among both men and women, incidence and mortality rates are roughly half those of NHWs (Table 2). The highest lung cancer incidence rate in men is in Samoans (98.9 per 100,000), followed by Native Hawaiians (72.1) and Vietnamese (62.7); Asians Indians/Pakistanis have the lowest rate (21.1) (Figure 2). Among women, Native Hawaiians (44.0) and Samoans (41.8) have the highest rates and Asian Indians/Pakistanis (10.2) the lowest. Data on historical trends in smoking prevalence for AANHPIs are scarce. A survey of smoking status in 2002–2005 found that 42% and 27% of NHPI men and women, respectively, were current smokers compared to 21% of Indian/Pakistani men and 4% of Indian/Pakistani women.51 Notably, lung cancer rates among Chinese women in both Asia and the US are relatively high given the low prevalence of smoking in this group. Reasons are unknown but may include exposure to cooking oils at high heat, secondhand smoke, genetic susceptibility, or other unknown risk factors.6, 52-54
Lung cancer occurrence has been decreasing among AANHPI men and relatively stable among women since the early 1990s (Figure 6, Figure 7).39 Among AANHPI women from 2003 to 2012, incidence rates were stable while death rates declined by 0.4% per year; in contrast, among NHW women, incidence rates decreased by 0.7% annually and death rates decreased by 1.2% annually. Lung cancer trends typically lag behind smoking trends by 2–3 decades. Historical national smoking data for AANHPIs do not exist until 1990, so it is not possible to link lung cancer trends in the past decade among AANHPIs to smoking patterns 3 decades prior. Furthermore, recent trends in lung cancer among AANHPIs are affected by the constant arrival of new immigrants who would not have been captured in prior US smoking statistics.
AANHPIs are more likely than NHWs to be diagnosed with lung cancer at a distant stage of disease (Figure 4); however, five-year cause-specific survival is similar between the two groups (Figure 5). AANHPIs and NHWs are equally likely to receive appropriate treatment for lung cancer.49 The reasons for the roughly equivalent survival in AANHPIs given later stage at diagnosis are unknown, but may include genetic and/or cultural factors, or less complete follow-up.27, 49
Prostate
Prostate cancer is the most commonly diagnosed cancer and the fifth-leading cause of cancer death among AANHPI men, with a total of 4,550 new cases and 520 deaths expected in 2016 (Figure 1). Incidence and mortality rates in AANHPIs are 50% lower than those in NHWs (Table 2). However, incidence rates vary by three-fold among AANHPI subgroups, with rates (per 100,000) of about 30 among Cambodians and Laotians; 45-70 among Vietnamese, Koreans, Asian Indians and Pakistanis, and Chinese; and 100 or more among Japanese, Filipinos, Native Hawaiians, and Samoans (Figure 2).
Prostate cancer incidence rates peaked among AANHPIs in the early 1990s due to the rapid uptake of prostate-specific antigen (PSA) testing, followed by a steady decline (Figure 6).55 Prostate cancer death rates have been generally declining among AANHPIs since 1993 (Figure 7), similar to NHWs. These declines are attributed to early detection and improvements in treatment, although the relative contribution of each is debated.56, 57
NHWs are more likely than AANHPIs to be diagnosed with prostate cancer at the localized stage (Figure 4), but five-year cause-specific survival is roughly the same in both groups (Figure 5).
Cancer Sites with Higher Rates for AANHPI
Liver and intrahepatic bile duct
Among AANHPI, an estimated 1,760 men and 830 women will be diagnosed with liver cancer in 2016 (Figure 1). It is the second-leading cause of cancer death among AANHPI men and the fifth-leading cause of cancer death among AANHPI women. Incidence and death rates among AANHPIs are about twice as high as those in NHWs (Table 2). Rates are particularly elevated in Laotians, Vietnamese, and Cambodians, likely due to recent immigration and a high prevalence of hepatitis B virus (HBV) infection in their countries of origin (Figure 2).6, 10 Chronic infection with HBV or hepatitis C virus (HCV) is the strongest risk factor for hepatocellular carcinoma.58 Hepatocellular carcinoma accounts for about 80% of all liver cancer cases worldwide.58 Other risk factors for liver cancer include certain toxins and parasitic infections in Asian and Pacific Island nations59 and obesity, diabetes, alcoholic liver disease, and tobacco smoking.
Liver cancer is one of the few cancers for which the direction of incidence and mortality trends differ in AANHPIs and NHWs. While it is among the most rapidly increasing cancers among NHWs, incidence rates among both male and female AANHPIs have been stable since the early 1990s (Figure 6, Table 3).39 Death rates are increasing among NHWs by 3% and 2% per year in men and women, respectively, from 2003 to 2012, in contrast to downward trends among AANHPIs (0.8% annually in men and 0.6% in women). The increasing rates among NHWs are thought to be attributable to increased prevalence of chronic infection with HCV as a result of exposure to contaminated blood or medical equipment and injection drug use during the 1960s and 1970s, and possibly increases in obesity and type 2 diabetes more recently.60 Community advocacy for awareness of HBV and motivation to use HBV screening and related therapies among AANHPIs, who have historically had the highest liver cancer rates in the US, may be driving the declining mortality rates.60 Trends may also be affected by the risk profiles of arriving immigrants.
AANHPIs are more likely than NHWs to be diagnosed with liver cancer at a localized stage (Figure 4) and also have higher five-year survival rates (Figure 5). Better survival among AANHPIs may be due to earlier stage at diagnosis, receipt of appropriate treatment, and/or lower prevalence of comorbidities, such as cirrhosis.61, 62
Stomach (gastric)
Among AANHPIs, an estimated 980 men and 820 women will be diagnosed with stomach cancer in 2016 (Figure 1). Stomach cancer incidence and death rates are about twice as high in AANHPIs as in NHWs (Table 2). Incidence is particularly high among Koreans, who have rates roughly twice as high as those among Japanese, who have the second-highest rates (Figure 2). Stomach cancer rates in Korea are the highest in the world.32
The bacterium Helicobacter pylori (H. pylori) is the strongest risk factor for stomach cancer, accounting for about 90% of non-cardia gastric cancer cases worldwide.63, 64 Stomach cancer rates have been declining in the US since the early 20th century, and have also been declining more recently in Asian countries with historically high rates, such as Japan, Korea, and China.65 These declines are thought to be due to changes in risk factors, including improved availability of fresh fruits and vegetables, lower consumption of salt-preserved foods, and reduced prevalence of H. pylori infection through improved sanitation and antibiotic treatment.66 Cigarette smoking is also a risk factor, and declines in smoking may have also contributed.67 From 2003 to 2012, stomach cancer rates incidence and death rates among AANHPIs declined annually by 3% and 4%, respectively (Table 3).
AANHPIs are more likely than NHWs to be diagnosed with stomach cancer at a localized or regional stage (Figure 4), possibly because of awareness of the higher risk of stomach cancer among Asian Americans and/or screening recommendations by some medical societies.68 The American Society for Gastrointestinal Endoscopy states that endoscopic screening may be considered for first-generation immigrants aged 40 years or older from high-risk Asian countries such as Japan or China, especially if there is a history of gastric cancer in a first-degree relative.69 Likely due to this earlier stage at diagnosis, AANHPIs have higher 5-year survival than NHWs, 40% versus 28% in males and 38% versus 34% in females (Figure 5).
Thyroid
Thyroid cancer is the second most frequently diagnosed cancer among AANHPI females, with 3,320 cases estimated in 2016 (Figure 1). While it is a commonly diagnosed cancer, especially among women, it is not a leading cause of cancer death because of high survival (Figure 5). The high burden of thyroid cancer among AANHPIs is driven by elevated rates among Filipinos (Figure 2), the second largest AANHPI population in the US, as well as relatively low incidence for other cancers. The reasons for the elevated rates in Filipinos are not well understood, but are thought to include dietary or environmental factors.70 AANHPIs are less likely than NHWs to be diagnosed with thyroid cancer at a localized stage (Figure 4), despite a similar 5-year survival rate of about 95% (Figure 5).
Thyroid cancer incidence rates have been increasing by more than 5% annually over the past 10 data years among both AANHPIs and NHWs (Table 3, Figure 6). At the same time, mortality remained generally stable (Table 3, Figure 7). The increasing incidence is thought to be partially due to increased detection because of more sensitive diagnostic procedures and increased use of imaging.71 However, increases across demographic and socioeconomic groups, as well as in larger and later-stage tumors, also implicate environmental factors.72
Uterine cervix
Despite lower cervical cancer incidence in AANHPIs overall than in NHWs (Table 2), rates (per 100,000) are twice as high in Cambodians (12.7) as in NHWs (6.8), and 40% higher among Vietnamese women (9.5). Incidence rates are lowest among Chinese (4.5) and Asian Indian/Pakistani (4.2) women. Cervical cancer incidence rates among women in India are relatively high,32 contrasting with the low rates among Asian Indian women in the US. This is likely due to the selectively younger and more educated Asian Indian immigrant population in the US.
Cervical cancer disparities among Asian American women are related primarily to access to screening, as well as prevalence of HPV infection in the country of origin for more recent immigrants.24, 73-75 The widespread uptake of the Pap test resulted in rapid declines in cervical cancer occurrence in the US over the second half of the 20th century, and decreases in incidence since 1990 among Vietnamese, Cambodian, and Laotian women in the US are attributed primarily to increased screening.76
Incidence and death rates among AANHPIs decreased by over 3% annually during the past 10 years of data, while they remained stable in NHW women (Table 3). AANHPI women are less likely than NHW women to be diagnosed with cervical cancer at the localized stage (43% versus 51%), although five-year survival is about 70% for both groups (Figure 5, Figure 4).
Nasopharynx
Nasopharyngeal carcinoma, which is the dominant form of nasopharyngeal cancer, is rare worldwide, although it has elevated incidence in certain regions and populations, including southern China and southeastern Asia.66 Incidence rates among AANHPIs overall are about 5 to 6 times higher than among NHWs (Table 2), and are particularly elevated for men in certain subpopulations, including Chinese, Samoans, Guamanians/Chamorros, and Hmong.77-80 Nasopharyngeal carcinoma is thought to be caused by a combination of viral, environmental, and genetic factors.81 It has been estimated that about 98% of nasopharyngeal carcinoma cases worldwide are related to infection with Epstein-Barr virus (EBV),66 although only a small fraction of people who are infected with EBV go on to develop nasopharyngeal carcinoma. Other environmental risk factors include smoking, alcohol consumption, occupational exposures, and certain preserved foods.82 Cantonese salted fish, which is high in nitrosamines, was identified as a risk factor for nasopharyngeal carcinoma among southern Chinese in the 1970s,83 leading to its designation by the International Agency for Research on Cancer as a carcinogen.84 While previous studies reported stable rates through the 1990s in AANHPI populations, incidence and mortality rates declined by about 2% to 3% annually from 2003 to 2012. Rates have also been declining among some high-risk populations in Asia, possibly due to decreased smoking or consumption of salted fish.85, 86 The recent declines among AANHPIs are not well understood, but may be attributable to dietary factors and decreased smoking.85 Five-year cause-specific survival is higher for AANHPIs than NHWs (Figure 5) for reasons that are unknown, but may include lower prevalence of other health conditions and/or less complete follow-up of AANHPI patients after diagnosis due to lost contact by cancer registries or inability to link to death registries.27, 87
Risk factors for cancer
The heterogeneity within the AANHPI population in terms of socioeconomic status, immigration patterns, and English proficiency is reflected in differences in risk factor prevalence and the use of preventive services between subgroups.88 Asian Americans have been described as having a bimodal socioeconomic distribution.5 For example, more than a third of Japanese, Filipinos, and Asian Indians, have a bachelor’s degree or higher and only about 5% live in poverty, compared with 12% and 20%, respectively, of Cambodians and Hmong.89 NHPIs have generally lower socioeconomic status than NHWs.90 As with other lower socioeconomic status groups in the US, the NHPI population also has a higher prevalence of cancer risk factors, including smoking and excess body weight.90 Both lower socioeconomic status and longer duration of US residence are associated with a higher prevalence of cancer risk factors, such as smoking and excess body weight.91, 92 In addition, about 40% of Chinese, Vietnamese, Koreans, Cambodians, and Hmong report speaking English less than “very well”,89 which may limit ability to access preventive and health care services, such as cancer screening.93 Several community-driven interventions focused on providing culturally competent, linguistically appropriate approaches have been successful in addressing cancer risk factors and screening among AANHPIs.
Tobacco
National smoking estimates are only available for Asian Americans (excluding NHPIs) as a group and for the three largest subgroups (Chinese, Filipinos, and Asian Indians). Local data on smoking among AANHPI subgroups are also scarce.94 Smoking among AANHPIs varies by sex, nativity, acculturation, and ethnicity. Overall, 10% of Asian Americans smoked in 2014, compared with 19% of NHWs.20 While smoking prevalence among NHW men (20%) and women (18%) is similar, Asian American men (14%) are more than twice as likely to smoke as women (6%).20 While among men, US-born and foreign-born Asian Americans are equally likely to smoke, among women, the US-born are five times more likely to smoke — 16% versus 3% of the foreign-born.20 These gender differences reflect smoking practices in home countries, where smoking is more accepted among men than women, and acculturation in the US, where female smoking is equally accepted.91 Current smoking is more common among Filipinos (12%) than Chinese (7%) or Asian Indians (6%).95 In Hawaii, where 55% of US Native Hawaiians reside, 27% of Native Hawaiians report being current smokers.96 Smoking prevalence within subgroups varies by location. For example, among men in New York City, 10% of Asian Indians smoke, compared with 18% of Chinese and 36% of Koreans.97 Several studies using community-based sampling and culturally appropriate methods have documented smoking prevalence among AANHPI subgroups that vary substantially from aggregated data.97 Data are scarce on other forms of tobacco use; however, it is well-known that use of various forms of smokeless tobacco is common in some Asian countries such as India.98
Smoking prevalence in Asian American men decreased from 25% in 1990-1992 to 14% in 2014,99 in contrast to women, among whom smoking remained stable at 6% from 1990-1992 to 2014.99 However, national trends do not necessarily reflect those in local areas. For instance, while overall smoking in New York City declined from 22% to 14% from 2002 to 2010, it did not decline among Asian males.100
Tobacco control needs among AANHPIs include disaggregated data on subgroups using surveys which include non-English speakers;94 culturally specific discouragement of initiation, especially among youth;101, 102 and culturally and linguistically tailored cessation assistance.103 Local examples of successful tobacco control initiatives can inform implementation on a broader scale. In a clinic serving Chinese immigrants in San Francisco which offered tobacco cessation services including counseling, nicotine replacement therapy, and acupuncture, over 90% of patients chose to include acupuncture; inclusion of this traditional medicinal approach may have increased acceptability of cessation assistance.103 Telephone quitlines are an effective smoking cessation tool, but until 2012 California was the only state in which this service was available in Asian languages.104 Since the nationwide service has been available, almost 6,000 callers have used the line within two years.
Overweight/obesity
Excess body weight increases the risk of several cancers (endometrial, colorectal, liver, kidney, gallbladder, prostate [advanced], ovarian, pancreatic, breast [postmenopausal], esophageal [adenocarcinoma]105), and also contributes to the development of independent risk factors such as nonalcoholic fatty liver disease and type 2 diabetes. As defined by the World Health Organization (WHO), normal weight is defined as a body mass index (BMI, kg/m2) of 18.5-24.9, whereas overweight is 25-29.9 and obese is ≥30. However, it has been shown that Asians have a higher percentage of body fat than whites at the same BMI, as well as a higher risk for type 2 diabetes at a lower BMI.106 For this reason, lower BMI cutpoints established by the American Diabetes Association are used for assessing diabetic risk in Asian Americans,107, 108 and some researchers have hypothesized that cancer risk among Asians may also be elevated at a lower BMI. While some studies indicate this may be true, especially for colon cancer,109, 110 others do not.111, 112 Moreover, three large pooled studies did not find Asians to be at a higher risk for cancer death at a lower BMI.113-115 Thus, more research is needed to clarify the association between cancer and body fatness in this population.
About one-third of Asian Americans are overweight or obese compared with two-thirds of NHWs.116 However, 76% of Native Hawaiians in Hawaii are overweight or obese.96 Asian American men (43%) are more likely to be overweight or obese than women (33%).116 Body fatness has been increasing among US-born Asian Americans, as well as recent and long-term immigrants. For instance, the prevalence of overweight among US-born Filipinos increased from 36% in 1992-1995 to 55% in 2003-2008.117 Prevalence of overweight and obesity vary by Asian American subgroup; a study in California found that only 8% of South Asian and 9% of Chinese children were overweight, compared to 16% of Japanese and Korean children and 18% of Filipino children.118
Alcohol
Alcohol consumption is associated with increased risk of several cancers (oral cavity, pharyngeal, laryngeal, colorectal, breast, esophageal, liver119), and it also may interact with HBV and HCV to further promote the development of liver cancer.120 This is of special concern among Asian Americans, who have a higher prevalence of HBV infection. Fewer Asian Americans (49%) consume alcohol than NHWs (72%), although prevalence in Asian American men (60%) is much higher than Asian American women (39%).20 US-born Asian Americans (61%) are also more likely to consume alcohol than those who are foreign-born (46%).20
Screening, brief intervention, and referral to treatment by a clinician for alcohol use, including use which does not constitute an alcohol use disorder but does put the patient at risk for alcohol-related diseases, can be effective in reducing alcohol use.121 Culturally specific approaches for addressing alcohol use in Asian Americans include using translated materials, addressing any misunderstandings about alcohol use, and recognizing familial consequences.121
Infectious agents
H. pylori
Chronic infection with H. pylori is highly endemic in Asia and prevalence patterns mirror gastric cancer risk.122 H. pylori seroprevalence is close to 60% in China and Korea,122 compared to about 30% in the United States.123 Compared to the Japanese living in Japan, the risk of stomach cancer is lower among long-term Japanese immigrants in the US and even lower among US-born Japanese.124 Although the spread of H. pylori is not well understood, it is known that infection occurs primarily during childhood and risk of infection is higher in lower socioeconomic groups.123 Due to lack of evidence, there are currently no interventions aimed at prevention. Preliminary studies in Asia have shown that eradication of H. pylori infection with antibiotics can reduce the risk of stomach cancer, although further studies are needed before application of this measure for prevention.125
Hepatitis B virus (HBV) and hepatitis C virus (HCV)
Prevalence of hepatitis B surface antigen seropositivity is estimated to be about 9% to 15% among Asian Americans, with prevalence as high as 25% among some recent immigrants.126 Nearly 70% of AANHPIs living in the US were born or have parents who were born in a country where HBV is highly prevalent.127 AANHPIs account for more than 50% of those infected with HBV in the United States, although most who harbor the virus are unaware.127 HBV vaccination in the US among AANHPI teens (86%) is slightly lower than other racial/ethnic groups, which all have HBV vaccination coverage above 90%.22 The HBV vaccine was introduced in the early 1980s. Taiwan achieved HBV vaccine coverage of 89% to 97% among birth cohorts from 1984 to 2010, which resulted in dramatic declines of about 80% in hepatocellular carcinoma incidence rates among vaccinated cohorts.128 While HBV is the leading liver cancer risk factor among Asian Americans in the US, HCV is also an important risk factor for some Asian American populations, including Pakistanis and older Japanese and Taiwanese.129-131
The United States Preventive Services Task Force (USPSTF) recommends screening all those born in regions with a prevalence of HBV infection ≥2%, which includes all countries of Asia and the Pacific Islands except Australia and New Zealand.132 Among adults 18 years of age and older, about 28% of both Asian Americans and NHWs had received a hepatitis B test.95 The USPSTF also recommends HCV screening for all adults born between 1945 and 1965, who account for three-quarters of HCV-infected individuals and HCV-related deaths in the United States.133 HCV testing coverage in this cohort is 13% among NHWs and 10% among Asian Americans.95
HBV screening among Asian Americans can be increased through culturally appropriate interventions in communities and the healthcare system. In a community-based randomized controlled trial among Hmong using bilingual/bicultural lay health workers, 24% of intervention participants reported receipt of HBV testing compared with 10% of controls.134 A church-based randomized controlled trial among Koreans with sessions led by lay health educators resulted in 19% of intervention participants reporting HBV testing, compared with 6% of controls.135 A study among Vietnamese Americans found that those who had received a physician’s recommendation or requested HBV testing were 4 and 8 times more likely, respectively, to receive testing, indicating the need for both provider and patient education.136 As such, health system-based interventions also have the potential to improve HBV testing by leveraging the importance of provider recommendation and integrating electronic medical records. In one randomized controlled trial, providers with Asian American patients received electronic messaging prompts for patients indicated for HBV screening, which resulted in 34% of intervention patients receiving HBV testing, compared with 0% of control patients.137
Human papillomavirus (HPV)
HPV causes nearly all cervical cancers in the United States, as well as many oropharyngeal cancers and anogenital cancers.138 A clinic-based study in 2003-2005 found that 17% of AANHPI women had a high-risk HPV infection, compared with 23% of white women.139 More recent HPV prevalence data reflecting the introduction of the HPV vaccine in 2006 are not yet available for AANHPIs in the US. Data by AANHPI subgroup is also not available; however, worldwide, it has been estimated that 5% of women in North America are infected with any type of HPV, compared with 11% of women in Eastern Asia, 7% in Southern Asia, and 14% in Southeastern Asia.73 Routine HPV vaccination is recommended for boys and girls at 11 to 12 years of age. While HPV vaccination is low in the US compared to recommended levels, coverage among Asian American girls is similar to that in NHW girls, with 36% of girls 13-17 years of age receiving the three recommended doses and 72% of girls who receive the first dose completing all three doses.22 HPV vaccination uptake in Asian American boys is higher than in NHWs, with 27% of Asian American boys 13-17 years of age receiving the three recommended doses (compared with 19% in NHW boys) and 63% of boys who receive the first dose completing all three doses (compared with 58% in NHW boys).22
HPV vaccine uptake is influenced by caregiver awareness and varies by local context. In a study in Los Angeles, California, only 64% and 44% of Chinese and Korean mothers, respectively, with HPV vaccine-eligible daughters were aware of the vaccine.140 A Seattle study of Cambodian mothers also found that lack of awareness; lack of physician recommendation; and a belief that the HPV vaccine is not necessary in the absence of health problems were primary barriers to vaccination of eligible girls.141 Physician education of caregivers and recommendation of the HPV vaccine are important steps which can be taken to increase HPV vaccination among AANHPIs.
Cancer screening
Access to health care influences the use of preventive services such as screening.142 Among Asian Americans, 13% of adults 18-64 years of age had no health insurance coverage, including 16% of those who were foreign-born, while 21% of men and 14% of women had no regular source of medical care.20 Among Native Hawaiians in Hawaii, 8% had no health insurance coverage and 16% had no regular source of medical care.96 Interventions to promote cancer screening among Asian American groups have been successful, especially those using lay health workers, one-on-one communications, translated materials, and approaches that not only involve Asian American community members, but also health care providers.143 Trained medical interpreters and patient navigators can help to overcome barriers to access among AANHPI,93 and patient navigators in particular have been shown to improve the receipt of recommended screening as well as follow-up and initiation of treatment.144
Cervical cancer screening
Seventy-one percent of Asian American women overall (21-65 years of age) reported having a Pap test within the past 3 years, compared with 83% of NHWs.145 However, prevalence varies by subgroup. In a California study using electronic health records of insured women in 2012-2013, 76% of AANHPI women overall were up to date on cervical cancer screening, with a range of 70% among NHPI women to 81% among Vietnamese women.146
Cervical cancer incidence rates among Cambodian, Vietnamese, and Laotian women decreased dramatically from 1990 to 2008, a change that has been attributed to increases in screening and treatment of precancerous lesions in these groups.76 For example, from 2001 to 2007 in California, cervical cancer screening among Vietnamese women increased from 69% to 85%.38 Increases in screening among Vietnamese women have been achieved through Vietnamese language media campaigns and lay health worker interventions.147 Cervical cancer screening can also be improved among AANHPIs through regular access to healthcare and physician recommendation. In a California study, Asian American patients were 13% more likely to receive recommended cervical cancer screening for each primary care visit attended in the past two years,146 and a Seattle study found that Vietnamese American women were about 4 times more likely to receive a Pap smear if they received a recommendation from their doctor.148
Breast cancer screening
Slightly more than two-thirds of Asian American (68%) and NHW (69%) women 45 years of age or older report having a mammogram within the past two years. However, uninsured Asian Americans (52%) are more likely to have had a recent mammogram than uninsured NHWs (40%). This is consistent with a California study that found that insurance was not a significant predictor of mammography receipt among Asian American women, which could be due to programs specifically targeting Asian American women.38 Breast cancer screening varies by subgroup; more than 80% of Vietnamese and Japanese women were current for mammography compared to 67% of Asian Indian and NHPI women and around 75% of Korean, Filipino, and Chinese women in a California healthcare organization in 2012-2013.146
A mammography intervention among Filipina women by the Hawaii Asian American Network for Cancer Awareness and Training (AANCART) provides an example of a successful intervention. A culturally appropriate intervention including a multimedia campaign, engagement of Filipino medical professionals and community organizations, and a partnership with the Hawaii Breast and Cervical Cancer Screening Program was implemented from 2004 to 2008. During this time, the proportion of Hawaii Filipina women who had never had a mammogram decreased from 18% in 2004 to 10% in 2008.149 In addition to community factors, mammography participation among AANHPIs is also influenced by physician recommendation, access to healthcare, and availability of trained medical interpreters and patient navigators.93, 144, 146
Colorectal cancer screening
Only about half of Asian Americans (52%) 50 years of age and older had received recommended colorectal cancer screening in 2013, compared with 61% of NHWs.145 Screening varies by subgroup; In California in 2009, adherence ranged from 61% in South Asians, Koreans, and Vietnamese to 71% in Japanese.150 Asian Americans are more likely than NHWs to use fecal occult blood test (11% versus 7%) and less likely to use endoscopy (48% versus 58%).145
Community-based interventions have been successful in increasing colorectal cancer screening among AANHPI populations. A church-based program among Koreans that used Korean-language education and patient navigation resulted in 77% of intervention participants receiving colorectal cancer screening within one year, compared with 11% of control group participants.151 Among Asian Americans, having regular access to healthcare increases the likelihood of receiving recommended colorectal cancer screening, as does the recommendation of a family member or friend.152
Prostate cancer screening
Currently, routine screening for prostate cancer is not recommended for men at average risk. The American Cancer Society guidelines for the early detection of prostate cancer promote informed choice for men aged 50 years and older who have a life expectancy of at least ten years.153 Overall, 26% of Asian men aged 50 years and older underwent PSA testing within the past year compared with 37% of NHWs.154 There is no nationwide data on the use of shared decision-making for PSA testing among AANHPIs, although it is likely suboptimal given the low use of informed decision-making overall.155
Lung cancer screening
Screening with low-dose spiral computed tomography (LDCT) has been shown to reduce lung cancer mortality by 20% among those at high risk for the disease.156 In 2013, the American Cancer Society recommended that clinicians with access to high-volume, high-quality lung cancer screening and treatment centers initiate a discussion about lung cancer screening with health patients aged 55 to 74 years who have at least a 30 pack-year smoking history and currently smoke or have quit within the past 15 years.157 Data are limited concerning the use of LDCT for lung cancer screening in community practice. However, a study of 2010 National Health Interview Survey data indicated there was little absolute difference in use of CT screening for lung cancer between Asians (1.0%) and whites (1.3%) among high-risk former and current smokers.158
Text box: Asian Pacific Islander Cancer Education Materials Tool
The Asian Pacific Islander Cancer Education Materials (APICEM) tool is a searchable web tool where users can access over four hundred patient-focused cancer education materials encompassing 26 cancer sites and 23 cancer topics in 22 Asian and Pacific Islander languages along with their English translations. The tool was created to help clinicians provide information to their Asian and Pacific Islander patients and is continually updated by its contributors, which include cancer research organizations and AANHPI health advocacy and community organizations. APICEM is made possible through the cooperation of the American Cancer Society; the Asian American Network for Cancer Awareness, Research and Training; and the National Cancer Institute.
Visit cancer.org/apicem for more information.
Limitations
The data presented here have several limitations and should be interpreted with caution. First, although “AANHPI” is a term that encompasses an extremely heterogeneous population with varying lifestyle behaviors and cancer risks, conventionally reported AANHPI cancer data in the US are reported in aggregate, masking important differences between subpopulations. NHPIs in particular have very different cancer risk profiles and cancer rates, but these differences are obscured by aggregation with Asian Americans. There is increasing recognition of the need to disaggregate health data for AANHPIs. The US Department of Health and Human Services has developed new standards for collecting data on race and ethnicity which will allow for disaggregation of data for the largest AANHPI subgroups in the future.159 At present, health data on AANHPIs is imperfect.159
Second, much of the demographic information in health records, such as place of birth and racial/ethnic identity, is often incorrect or incomplete for minority patients. This can occur when information is assigned by a health care worker instead of obtained directly from the patient or his/her family. The resulting misclassification leads to inaccurate, often underestimated cancer rates. Similarly, it has been shown that a small percentage of decedents who had self-reported as AANHPIs were not recorded as such on death certificates. The standard US death certificate was revised in 2003 to include several AANHPI subgroups and had been adopted by 44 states by 2012. This change will improve the availability of disaggregated data for AANHPIs, although issues of misclassification may persist.
Third, there are challenges when calculating statistics for racial/ethnic subgroups, especially those that are rapidly growing and changing. For example, population size, which is necessary for computing rates, is often difficult to estimate. Also, rates for subpopulations that are based on small numbers may be unreliable. Additional complexity is added to the classification of AANHPI race/ethnicity and calculation of statistics due to the high proportion of AANHPIs of mixed race; about 15% of Asian Americans and 56% of NHPIs report more than one race.2, 4
In addition, survey data on behaviors and cancer risk factors are relatively scarce for AANHPIs, particularly for subgroups. Due to the small size of the AANHPI population relative to other groups, it is difficult for national population-based surveys to reach a sufficient number of participants to report reliable estimates, so information is confined to the three largest subgroups (Chinese, Filipino, and Asian Indian). While national risk factor data for NHPI are especially scarce at present, the first NHPI National Health Interview Survey data are expected to be released in late 2015.160 In addition, many survey questionnaires are available only in English or in a limited selection of Asian languages, which excludes a considerable proportion of the Asian population. Moreover, much health behavior data rely on self-reports, which are subject to inaccurate recall.
Finally, the estimated numbers of new cancer cases and deaths among AANHPIs in the US in 2016 should be interpreted with caution. While they provide a reasonably accurate portrayal of the contemporary cancer burden, they are projections four years beyond actual data based on temporal trends in incidence and mortality as far back as 2003 and 1998, respectively. Therefore, we recommend the use of age-standardized or age-specific cancer death rates from the NCHS or cancer incidence rates from SEER or NAACCR for tracking changes in cancer occurrence over time.
Conclusions
Asian Americans and NHPIs are two of the fastest-growing populations in the US. AANHPIs as a group have a generally lower risk of cancer than NHWs, with the exception of select infection-related cancer sites (stomach, liver, nasopharynx). However, aggregating data for AANHPIs masks important differences in cancer risk within this heterogeneous population. NHPIs, who are small in number, but have a higher cancer burden than Asian Americans, are particularly disadvantaged by data aggregation. It is essential that cancer control strategies acknowledge the diversity of the AANHPI population because tailored interventions have demonstrated success. These include translation into native languages, consideration of cultural appropriateness, provider recommendation, improved access to healthcare and patient navigation, and improved knowledge about cancer prevention. Further research is needed among the subgroups of this highly diverse population to better understand the cancer burden and associated risk factors.
Acknowledgments
The authors would like to acknowledge Dr. Reginald Ho for suggestions to the article.
M. Chen’s effort on this paper was supported by U54 CA153499 from the Center to Reduce Cancer Health Disparities of the National Cancer Institute. However, the views are those of the author and do not represent the views of the National Cancer Institute.
References
- 1.Colby SL, Ortman JM. Projections of the Size and Composition of the U.S. Population: 2014 to 2060, Current Population Reports, P25-1143. U.S. Census Bureau; Washington, DC: 2014. [Google Scholar]
- 2.Hoeffel EM, Rastogi S, Kim MO, Shahid H. 2010 Census Briefs. U.S. Department of Commerce, Economics and Statistics Administration, U.S. Census Bureau; 2012. The Asian Population: 2010. [Google Scholar]
- 3.Brown A. U.S. Hispanic and Asian populations growing, but for different reasons. Available at: http://www.pewresearch.org/fact-tank/2014/06/26/u-s-hispanic-and-asian-populations-growing-but-for-different-reasons/. Accessed September 15, 2015.
- 4.Hixson L, Hepler BB, Kim MO. 2010 Census Briefs. U.S. Department of Commerce, Economics and Statistics Administration, U.S. Census Bureau; 2012. The Native Hawaiian and Other Pacific Islander Population: 2010. [Google Scholar]
- 5.Kagawa-Singer M, Kho C. Asian-American Health and Disease: An Overview. In: Huff RM, Kline MV, Peterson DV, editors. Health Promotion in Multicultural Populations. Third Sage Publications; Washington, DC: 2015. [Google Scholar]
- 6.McCracken M, Olsen M, Chen MS, Jr., et al. Cancer incidence, mortality, and associated risk factors among Asian Americans of Chinese, Filipino, Vietnamese, Korean, and Japanese ethnicities. CA Cancer J Clin. 2007;57:190–205. doi: 10.3322/canjclin.57.4.190. [DOI] [PubMed] [Google Scholar]
- 7.Surveillance, Epidemiology, and End Results (SEER) Program Number of Persons by Race and Hispanic Ethnicity for SEER Participants (2010 Census Data) Available at: http://seer.cancer.gov/registries/data.html. Accessed September 10, 2015.
- 8.Surveillance, Epidemiology, and End Results (SEER) Program . SEER*Stat Database: Incidence - SEER 11, plus Greater CA and NJ, Nov 2012 Sub (1990-2010) detailed API plus White Non-Hispanic - pops projected from populations. National Cancer Institute, DCCPS, Surveillance Research Program, Cancer Statistics Branch; www.seer.cancer.gov. released May 2013, based on the November 2012 submission. [Google Scholar]
- 9.Surveillance, Epidemiology, and End Results (SEER) Program . SEER*Stat Database: Incidence - SEER 13 Regs Research Data with Delay-Adjustment, Malignant Only, Nov 2014 Sub (1992-2012) <Katrina/Rita Population Adjustment> - Linked To County Attributes - Total U.S., 1969-2013 Counties, National Cancer Institute, DCCPS, Surveillance Research Program, Surveillance Systems Branch; www.seer.cancer.gov. released February 2015, based on the November 2014 submission. [Google Scholar]
- 10.Miller BA, Chu KC, Hankey BF, Ries LA. Cancer incidence and mortality patterns among specific Asian and Pacific Islander populations in the U.S. Cancer Causes Control. 2008;19:227–256. doi: 10.1007/s10552-007-9088-3. [DOI] [PMC free article] [PubMed] [Google Scholar]
- 11.Surveillance, Epidemiology, and End Results (SEER) Program . SEER*Stat Database: Incidence - SEER 18 Regs Research Data + Hurricane Katrina Impacted Louisiana Cases, Nov 2014 Sub (1973-2012 varying) - Linked To County Attributes - Total U.S., 1969-2013 Counties. National Cancer Institute, DCCPS, Surveillance Research Program, Surveillance Systems Branch; www.seer.cancer.gov. released April 2015, based on the November 2014 submission. [Google Scholar]
- 12.Arias E. United States life tables, 2010. Natl Vital Stat Rep. 2014;63:1–63. [PubMed] [Google Scholar]
- 13.Surveillance, Epidemiology and End Results (SEER) Program . SEER*Stat Database: NAACCR Incidence - CiNA Analytic File, 1995-2012, for NHIAv2 Origin and for Expanded Races. Custom File With County, ACS Facts and Figures Projection Project, North American Association of Central Cancer Registries; www.seer.cancer.gov. [Google Scholar]
- 14.Surveillance, Epidemiology, and End Results (SEER) Program . SEER*Stat Database: Mortality-All COD, Aggregated With State, Total US (1990-2012) <Katrina/Rita Population Adjustment>. National Cancer Institute, Division of Cancer Control and Population Sciences, Surveillance Research Program, Surveillance Systems Branch; Bethesda, MD: 2015. Underlying mortality data provided by National Center for Health Statistics (cdc.gov/nchs) [Google Scholar]
- 15.Fritz A, Percy C, Jack A, et al., editors. International Classification of Diseases for Oncology. third. World Health Organization; Geneva: 2000. edition T. [Google Scholar]
- 16.Percy C, Van Holten V, Muir C, editors. International Classification of Diseases for Oncology. second. World Health Organization; Geneva: 1990. edition s. [Google Scholar]
- 17.World Health Organization . Manual of the International Statistical Classification of Diseases Injuries and Causes of Death. Vol. 1. World Health Organization; Geneva, Switzerland: 1990. 10th rev. [Google Scholar]
- 18.World Health Organization . Manual of the International Statistical Classification of Diseases Injuries and Causes of Death. Vol. 1. World Health Organization; Geneva, Switzerland: 1975. 9th rev. [Google Scholar]
- 19.Chen HS, Portier K, Ghosh K, et al. Predicting US- and state-level cancer counts for the current calendar year: Part I: evaluation of temporal projection methods for mortality. Cancer. 2012;118:1091–1099. doi: 10.1002/cncr.27404. [DOI] [PMC free article] [PubMed] [Google Scholar]
- 20.National Center for Health Statistics, Centers for Disease Control and Prevention . National Health Interview Survey Public Use Data File 2014. National Center for Health Statistics, Centers for Disease Control and Prevention; Atlanta, GA: 2015. [Google Scholar]
- 21.Centers for Disease Control and Prevention, National Center for Health Statistics National Health and Nutrition Examination Survey. Available at: http://www.cdc.gov/nchs/nhanes.htm. Accessed September 11, 2015.
- 22.Reagan-Steiner S, Yankey D, Jeyarajah J, et al. National, Regional, State, and Selected Local Area Vaccination Coverage Among Adolescents Aged 13-17 Years - United States, 2014. MMWR Morb Mortal Wkly Rep. 2015;64:784–792. doi: 10.15585/mmwr.mm6429a3. [DOI] [PMC free article] [PubMed] [Google Scholar]
- 23.Centers for Disease Control and Prevention National Immunization Survey: Datasets and related documentation for the National Immunization Survey-Teen, 2008-2014. Available at: http://www.cdc.gov/nchs/nis/data_files_teen.htm. Accessed September 11, 2015.
- 24.Wang SS, Carreon JD, Gomez SL, Devesa SS. Cervical cancer incidence among 6 asian ethnic groups in the United States, 1996 through 2004. Cancer. 2010;116:949–956. doi: 10.1002/cncr.24843. [DOI] [PMC free article] [PubMed] [Google Scholar]
- 25.Harari A, Li N, Yeh MW. Racial and socioeconomic disparities in presentation and outcomes of well-differentiated thyroid cancer. J Clin Endocrinol Metab. 2014;99:133–141. doi: 10.1210/jc.2013-2781. [DOI] [PMC free article] [PubMed] [Google Scholar]
- 26.Iqbal J, Ginsburg O, Rochon PA, Sun P, Narod SA. Differences in breast cancer stage at diagnosis and cancer-specific survival by race and ethnicity in the United States. JAMA. 2015;313:165–173. doi: 10.1001/jama.2014.17322. [DOI] [PubMed] [Google Scholar]
- 27.Pinheiro PS, Morris CR, Liu L, Bungum TJ, Altekruse SF. The impact of follow-up type and missed deaths on population-based cancer survival studies for Hispanics and Asians. J Natl Cancer Inst Monogr. 2014;2014:210–217. doi: 10.1093/jncimonographs/lgu016. [DOI] [PMC free article] [PubMed] [Google Scholar]
- 28.Turra CM, Elo IT. The Impact of Salmon Bias on the Hispanic Mortality Advantage: New Evidence from Social Security Data. Popul Res Policy Rev. 2008;27:515–530. doi: 10.1007/s11113-008-9087-4. PMC - PMC2546603. [DOI] [PMC free article] [PubMed] [Google Scholar]
- 29.Centers for Disease Control and Prevention, National Center for Health Statistics Underlying Cause of Death 1999-2013 on CDC WONDER Online Database, released 2015. Data are from the Multiple Cause of Death Files, 1999-2013, as compiled from data provided by the 57 vital statistics jurisdictions through the Vital Statistics Cooperative Program. Accessed at http://wonder.cdc.gov/ucd-icd10.html on Oct 27, 2015 1:51:50 PM.
- 30.Golden SH, Brown A, Cauley JA, et al. Health disparities in endocrine disorders: biological, clinical, and nonclinical factors--an Endocrine Society scientific statement. J Clin Endocrinol Metab. 2012;97:E1579–1639. doi: 10.1210/jc.2012-2043. [DOI] [PMC free article] [PubMed] [Google Scholar]
- 31.Keegan TH, Gomez SL, Clarke CA, Chan JK, Glaser SL. Recent trends in breast cancer incidence among 6 Asian groups in the Greater Bay Area of Northern California. Int J Cancer. 2007;120:1324–1329. doi: 10.1002/ijc.22432. [DOI] [PubMed] [Google Scholar]
- 32.Ferlay J, Soerjomataram I, Ervik M, et al. GLOBOCAN 2012 v1.0, Cancer Incidence and Mortality Worldwide: IARC CancerBase No. 11 [Internet] International Agency for Research on Cancer. Available at: http://globocan.iarc.fr. Accessed July 30, 2015.
- 33.Sung H, Rosenberg PS, Chen WQ, et al. Female breast cancer incidence among Asian and Western populations: more similar than expected. J Natl Cancer Inst. 2015;107(7):pii. doi: 10.1093/jnci/djv107. djv107. [DOI] [PMC free article] [PubMed] [Google Scholar]
- 34.Gomez SL, Quach T, Horn-Ross PL, et al. Hidden breast cancer disparities in Asian women: disaggregating incidence rates by ethnicity and migrant status. Am J Public Health. 2010;100(Suppl 1):S125–131. doi: 10.2105/AJPH.2009.163931. [DOI] [PMC free article] [PubMed] [Google Scholar]
- 35.Stanford JL, Herrinton LJ, Schwartz SM, Weiss NS. Breast cancer incidence in Asian migrants to the United States and their descendants. Epidemiology (Cambridge, Mass) 1995;6:181–183. doi: 10.1097/00001648-199503000-00017. [DOI] [PubMed] [Google Scholar]
- 36.Ziegler RG, Hoover RN, Pike MC, et al. Migration patterns and breast cancer risk in Asian-American women. J Natl Cancer Inst. 1993;85:1819–1827. doi: 10.1093/jnci/85.22.1819. [DOI] [PubMed] [Google Scholar]
- 37.Breen N, Gentleman JF, Schiller JS. Update on mammography trends: comparisons of rates in 2000, 2005, and 2008. Cancer. 2011;117:2209–2218. doi: 10.1002/cncr.25679. [DOI] [PMC free article] [PubMed] [Google Scholar]
- 38.Chawla N, Breen N, Liu B, Lee R, Kagawa-Singer M. Asian American women in California: a pooled analysis of predictors for breast and cervical cancer screening. Am J Public Health. 2015;105:e98–e109. doi: 10.2105/AJPH.2014.302250. [DOI] [PMC free article] [PubMed] [Google Scholar]
- 39.Howlader N, Noone AM, Krapcho M, Garshell J, Miller D, Altekruse SF, Kosary CL, Yu M, Ruhl J, Tatalovich Z, Mariotto A, Lewis DR, Chen HS, Feuer EJ, Cronin KA, editors. SEER Cancer Statistics Review, 1975-2012. National Cancer Institute; Bethesda, MD: http://seer.cancer.gov/csr/1975_2012/, based on November 2014 SEER data submission, posted to the SEER web site, April 2015. [Google Scholar]
- 40.Berry DA, Cronin KA, Plevritis SK, et al. Effect of screening and adjuvant therapy on mortality from breast cancer. New Engl J Med. 2005;353:1784–1792. doi: 10.1056/NEJMoa050518. [DOI] [PubMed] [Google Scholar]
- 41.Gomez SL, Clarke CA, Shema SJ, Chang ET, Keegan TH, Glaser SL. Disparities in breast cancer survival among Asian women by ethnicity and immigrant status: a population-based study. Am J Public Health. 2010;100:861–869. doi: 10.2105/AJPH.2009.176651. [DOI] [PMC free article] [PubMed] [Google Scholar]
- 42.Yi M, Liu P, Li X, et al. Comparative analysis of clinicopathologic features, treatment, and survival of Asian women with a breast cancer diagnosis residing in the United States. Cancer. 2012;118:4117–4125. doi: 10.1002/cncr.27399. [DOI] [PubMed] [Google Scholar]
- 43.Rock CL, Doyle C, Demark-Wahnefried W, et al. Nutrition and physical activity guidelines for cancer survivors. CA Cancer J Clin. 2012;62:243–274. doi: 10.3322/caac.21142. [DOI] [PubMed] [Google Scholar]
- 44.Telli ML, Chang ET, Kurian AW, et al. Asian ethnicity and breast cancer subtypes: a study from the California Cancer Registry. Breast Cancer Res Treat. 2011;127:471–478. doi: 10.1007/s10549-010-1173-8. [DOI] [PMC free article] [PubMed] [Google Scholar]
- 45.Ladabaum U, Clarke CA, Press DJ, et al. Colorectal cancer incidence in Asian populations in California: effect of nativity and neighborhood-level factors. Am J Gastroenterol. 2014;109:579–588. doi: 10.1038/ajg.2013.488. [DOI] [PMC free article] [PubMed] [Google Scholar]
- 46.Edwards BK, Ward E, Kohler BA, et al. Annual report to the nation on the status of cancer, 1975-2006, featuring colorectal cancer trends and impact of interventions (risk factors, screening, and treatment) to reduce future rates. Cancer. 2010;116:544–573. doi: 10.1002/cncr.24760. [DOI] [PMC free article] [PubMed] [Google Scholar]
- 47.Siegel R, Desantis C, Jemal A. Colorectal cancer statistics, 2014. CA Cancer J Clin. 2014;64:104–117. doi: 10.3322/caac.21220. [DOI] [PubMed] [Google Scholar]
- 48.Giddings BH, Kwong SL, Parikh-Patel A, Bates JH, Snipes KP. Going against the tide: increasing incidence of colorectal cancer among Koreans, Filipinos, and South Asians in California, 1988-2007. Cancer Causes Control. 2012;23:691–702. doi: 10.1007/s10552-012-9937-6. [DOI] [PubMed] [Google Scholar]
- 49.Trinh QD, Nguyen PL, Leow JJ, et al. Cancer-specific mortality of asian americans diagnosed with cancer: a nationwide population-based assessment. J Natl Cancer Inst. 2015;107(6):pii:djv054. doi: 10.1093/jnci/djv054. [DOI] [PubMed] [Google Scholar]
- 50.Gomez SL, O'Malley CD, Stroup A, Shema SJ, Satariano WA. Longitudinal, population-based study of racial/ethnic differences in colorectal cancer survival: impact of neighborhood socioeconomic status, treatment and comorbidity. BMC Cancer. 2007;7:193. doi: 10.1186/1471-2407-7-193. [DOI] [PMC free article] [PubMed] [Google Scholar]
- 51.Caraballo RS, Yee SL, Gfroerer J, Mirza SA. Adult tobacco use among racial and ethnic groups living in the United States, 2002-2005. Prev Chronic Dis. 2008;5:A78. [PMC free article] [PubMed] [Google Scholar]
- 52.Cheng I, Le GM, Noone AM, et al. Lung cancer incidence trends by histology type among Asian American, Native Hawaiian, and Pacific Islander populations in the United States, 1990-2010. Cancer Epidemiol Biomarkers Prev. 2014;23:2250–2265. doi: 10.1158/1055-9965.EPI-14-0493. [DOI] [PMC free article] [PubMed] [Google Scholar]
- 53.Lam WK, White NW, Chan-Yeung MM. Lung cancer epidemiology and risk factors in Asia and Africa. Int J Tuberc Lung Dis. 2004;8:1045–1057. [PubMed] [Google Scholar]
- 54.Huang V, Li W, Tsai J, Begier E. Cancer Mortality among Asians and Pacific Islanders in New York City, 2001-2010. J Cancer Epidemiol. 2013;2013:986408. doi: 10.1155/2013/986408. [DOI] [PMC free article] [PubMed] [Google Scholar]
- 55.Potosky AL, Miller BA, Albertsen PC, Kramer BS. The role of increasing detection in the rising incidence of prostate cancer. JAMA. 1995;273:548–552. [PubMed] [Google Scholar]
- 56.Andriole GL, Crawford ED, Grubb RL, 3rd, et al. Prostate cancer screening in the randomized Prostate, Lung, Colorectal, and Ovarian Cancer Screening Trial: mortality results after 13 years of follow-up. J Natl Cancer Inst. 2012;104:125–132. doi: 10.1093/jnci/djr500. [DOI] [PMC free article] [PubMed] [Google Scholar]
- 57.Schroder FH, Hugosson J, Roobol MJ, et al. Prostate-cancer mortality at 11 years of follow-up. New Engl J Med. 2012;366:981–990. doi: 10.1056/NEJMoa1113135. [DOI] [PMC free article] [PubMed] [Google Scholar]
- 58.El-Serag HB. Epidemiology of viral hepatitis and hepatocellular carcinoma. Gastroenterology. 2012;142:1264–1273. doi: 10.1053/j.gastro.2011.12.061. e1261. [DOI] [PMC free article] [PubMed] [Google Scholar]
- 59.Torre LA, Siegel RL, Ward EM, Jemal A. Global cancer incidence and mortality rates and trends-- an update. Cancer Epidemiol Biomarkers Prev (in press) 2015 doi: 10.1158/1055-9965.EPI-15-0578. [DOI] [PubMed] [Google Scholar]
- 60.Altekruse SF, Henley SJ, Cucinelli JE, McGlynn KA. Changing hepatocellular carcinoma incidence and liver cancer mortality rates in the United States. Am J Gastroenterol. 2014;109:542–553. doi: 10.1038/ajg.2014.11. [DOI] [PMC free article] [PubMed] [Google Scholar]
- 61.Wong RJ, Corley DA. Survival differences by race/ethnicity and treatment for localized hepatocellular carcinoma within the United States. Dig Dis Sci. 2009;54:2031–2039. doi: 10.1007/s10620-008-0661-8. [DOI] [PMC free article] [PubMed] [Google Scholar]
- 62.Davila JA, El-Serag HB. Racial differences in survival of hepatocellular carcinoma in the United States: a population-based study. Clin Gastroenterol Hepatol. 2006;4:104–110. quiz 104-105. [PubMed] [Google Scholar]
- 63.Colquhoun A, Arnold M, Ferlay J, Goodman KJ, Forman D, Soerjomataram I. Global patterns of cardia and non-cardia gastric cancer incidence in 2012. Gut. 2015 doi: 10.1136/gutjnl-2014-308915. [DOI] [PubMed] [Google Scholar]
- 64.Plummer M, Franceschi S, Vignat J, Forman D, de Martel C. Global burden of gastric cancer attributable to pylori. Int J Cancer. 2015;136:487–490. doi: 10.1002/ijc.28999. [DOI] [PubMed] [Google Scholar]
- 65.Torre LA, Bray F, Siegel RL, Ferlay J, Lortet-Tieulent J, Jemal A. Global cancer statistics, 2012. CA Cancer J Clin. 2015;65:87–108. doi: 10.3322/caac.21262. [DOI] [PubMed] [Google Scholar]
- 66.Parkin DM. The global health burden of infection-associated cancers in the year 2002. Int J Cancer. 2006;118:3030–3044. doi: 10.1002/ijc.21731. [DOI] [PubMed] [Google Scholar]
- 67.Bertuccio P, Chatenoud L, Levi F, et al. Recent patterns in gastric cancer: a global overview. Int J Cancer. 2009;125:666–673. doi: 10.1002/ijc.24290. [DOI] [PubMed] [Google Scholar]
- 68.Taylor VM, Ko LK, Hwang JH, Sin MK, Inadomi JM. Gastric cancer in asian american populations: a neglected health disparity. Asian Pac J Cancer Prev. 2014;15:10565–10571. doi: 10.7314/apjcp.2014.15.24.10565. [DOI] [PubMed] [Google Scholar]
- 69.Wang A, Shaukat A, Acosta RD, et al. Race and ethnicity considerations in GI endoscopy. Gastrointest Endosc. 2015;82:593–599. doi: 10.1016/j.gie.2015.06.002. [DOI] [PubMed] [Google Scholar]
- 70.Kus LH, Shah M, Eski S, Walfish PG, Freeman JL. Thyroid cancer outcomes in Filipino patients. Arch Otolaryngol Head Neck Surg. 2010;136:138–142. doi: 10.1001/archoto.2009.206. [DOI] [PubMed] [Google Scholar]
- 71.O'Grady TJ, Gates MA, Boscoe FP. Thyroid cancer incidence attributable to overdiagnosis in the United States 1981-2011. Int J Cancer. 2015;137:2664–2673. doi: 10.1002/ijc.29634. [DOI] [PubMed] [Google Scholar]
- 72.Horn-Ross PL, Lichtensztajn DY, Clarke CA, et al. Continued rapid increase in thyroid cancer incidence in california: trends by patient, tumor, and neighborhood characteristics. Cancer Epidemiol Biomarkers Prev. 2014;23:1067–1079. doi: 10.1158/1055-9965.EPI-13-1089. [DOI] [PMC free article] [PubMed] [Google Scholar]
- 73.Bruni L, Diaz M, Castellsague X, Ferrer E, Bosch FX, de Sanjose S. Cervical human papillomavirus prevalence in 5 continents: meta-analysis of 1 million women with normal cytological findings. J Infect Dis. 2010;202:1789–1799. doi: 10.1086/657321. [DOI] [PubMed] [Google Scholar]
- 74.Forman D, de Martel C, Lacey CJ, et al. Global burden of human papillomavirus and related diseases. Vaccine. 2012;30(Suppl 5):F12–23. doi: 10.1016/j.vaccine.2012.07.055. [DOI] [PubMed] [Google Scholar]
- 75.Vaccarella S, Lortet-Tieulent J, Plummer M, Franceschi S, Bray F. Worldwide trends in cervical cancer incidence: Impact of screening against changes in disease risk factors. Eur J Cancer. 2013;0:0. doi: 10.1016/j.ejca.2013.04.024. [DOI] [PubMed] [Google Scholar]
- 76.Gomez SL, Noone AM, Lichtensztajn DY, et al. Cancer Incidence Trends Among Asian American Populations in the United States, 1990 to 2008. J Natl Cancer Inst. 2013 doi: 10.1093/jnci/djt157. [DOI] [PMC free article] [PubMed] [Google Scholar]
- 77.Haddock RL, Talon RJ, Whippy HJ. Ethnic disparities in cancer mortality among residents of Guam. Asian Pac J Cancer Prev. 2006;7:411–414. [PubMed] [Google Scholar]
- 78.Mills PK, Yang RC, Riordan D. Cancer incidence in the Hmong in California, 1988-2000. Cancer. 2005;104:2969–2974. doi: 10.1002/cncr.21525. [DOI] [PubMed] [Google Scholar]
- 79.Cockburn M, Liu L, Deapen D, editors. Cancer in Los Angeles County: Trends by Race/Ethnicity, 1976-2006. Los Angeles Cancer Surveillance Program; University of Southern California: 2009. [Google Scholar]
- 80.Mishra SI, Luce-Aoelua P, Wilkens LR, Bernstein L. Cancer among American-Samoans: site-specific incidence in California and Hawaii. Int J Epidemiol. 1996;25:713–721. doi: 10.1093/ije/25.4.713. [DOI] [PubMed] [Google Scholar]
- 81.Chang ET, Adami HO. The enigmatic epidemiology of nasopharyngeal carcinoma. Cancer Epidemiol Biomarkers Prev. 2006;15:1765–1777. doi: 10.1158/1055-9965.EPI-06-0353. [DOI] [PubMed] [Google Scholar]
- 82.Kamran SC, Riaz N, Lee N. Nasopharyngeal carcinoma. Surg Oncol Clin N Am. 2015;24:547–561. doi: 10.1016/j.soc.2015.03.008. [DOI] [PubMed] [Google Scholar]
- 83.Ho JHC, Huang DP, Fong YY. Salted fish and nasopharyngeal carcinoma in southern Chinese. Lancet. 1978;2:626. doi: 10.1016/s0140-6736(78)92844-1. [DOI] [PubMed] [Google Scholar]
- 84.Secretan B, Straif K, Baan R, et al. A review of human carcinogens--Part E: tobacco, areca nut, alcohol, coal smoke, and salted fish. Lancet Oncol. 2009;10:1033–1034. doi: 10.1016/s1470-2045(09)70326-2. [DOI] [PubMed] [Google Scholar]
- 85.Sun LM, Epplein M, Li CI, Vaughan TL, Weiss NS. Trends in the incidence rates of nasopharyngeal carcinoma among Chinese Americans living in Los Angeles County and the San Francisco metropolitan area, 1992-2002. Am J Epidemiol. 2005;162:1174–1178. doi: 10.1093/aje/kwi345. [DOI] [PubMed] [Google Scholar]
- 86.Luo J, Chia KS, Chia SE, Reilly M, Tan CS, Ye W. Secular trends of nasopharyngeal carcinoma incidence in Singapore, Hong Kong and Los Angeles Chinese populations, 1973-1997. Eur J Epidemiol. 2007;22:513–521. doi: 10.1007/s10654-007-9148-8. [DOI] [PubMed] [Google Scholar]
- 87.Sun LM, Li CI, Huang EY, Vaughan TL. Survival differences by race in nasopharyngeal carcinoma. Am J Epidemiol. 2007;165:271–278. doi: 10.1093/aje/kwk008. [DOI] [PubMed] [Google Scholar]
- 88.Gomez SL, Glaser SL, Horn-Ross PL, et al. Cancer research in Asian American, Native Hawaiian, and Pacific Islander populations: accelerating cancer knowledge by acknowledging and leveraging heterogeneity. Cancer Epidemiol Biomarkers Prev. 2014;23:2202–2205. doi: 10.1158/1055-9965.EPI-14-0624. [DOI] [PMC free article] [PubMed] [Google Scholar]
- 89.US Census Bureau 2011-2013 3-Year American Community Survey. Available at: https://www.census.gov/programs-surveys/acs/. Accessed September 1, 2015.
- 90.Palmer PH. Pacific Islander Health and Disease: An Overview. In: Huff RM, Kline MV, Peterson DV, editors. Health Promotion in Multicultural Populations. Third Sage Publications; Washington, DC: 2015. [Google Scholar]
- 91.An N, Cochran SD, Mays VM, McCarthy WJ. Influence of American acculturation on cigarette smoking behaviors among Asian American subpopulations in California. Nicotine Tob Res. 2008;10:579–587. doi: 10.1080/14622200801979126. [DOI] [PMC free article] [PubMed] [Google Scholar]
- 92.Bates LM, Acevedo-Garcia D, Alegria M, Krieger N. Immigration and generational trends in body mass index and obesity in the United States: results of the National Latino and Asian American Survey, 2002-2003. Am J Public Health. 2008;98:70–77. doi: 10.2105/AJPH.2006.102814. [DOI] [PMC free article] [PubMed] [Google Scholar]
- 93.Dang J, Lee J, Tran JH, et al. The role of medical interpretation on breast and cervical cancer screening among Asian American and Pacific Islander women. J Cancer Educ. 2010;25:253–262. doi: 10.1007/s13187-010-0074-1. [DOI] [PMC free article] [PubMed] [Google Scholar]
- 94.Lew R, Chen WW. Promising practices to eliminate tobacco disparities among Asian American, native Hawaiian and Pacific Islander communities. Health Promot Pract. 2013;14:6S–9S. doi: 10.1177/1524839913497717. [DOI] [PubMed] [Google Scholar]
- 95.National Center for Health Statistics, Centers for Disease Control and Prevention . National Health Interview Survey Public Use Data File, 2013 and 2014. National Center for Health Statistics, Centers for Disease Control and Prevention; Atlanta, GA: 2015. [Google Scholar]
- 96.Nguyen DH, Salvail FR. The Hawaii Behavioral Risk Factor Surveillance System: 2014 Results. Available at: http://health.hawaii.gov/brfss/files/2015/08/HBRFSS_2014_results.pdf. Accessed September 22, 2015.
- 97.Li S, Kwon SC, Weerasinghe I, Rey MJ, Trinh-Shevrin C. Smoking among Asian Americans: acculturation and gender in the context of tobacco control policies in New York City. Health Promot Pract. 2013;14:18S–28S. doi: 10.1177/1524839913485757. [DOI] [PMC free article] [PubMed] [Google Scholar]
- 98.Mukherjea A, Modayil MV. Culturally specific tobacco use and South Asians in the United States: a review of the literature and promising strategies for intervention. Health Promot Pract. 2013;14:48S–60S. doi: 10.1177/1524839913485585. [DOI] [PubMed] [Google Scholar]
- 99.National Center for Health Statistics . Health, United States, 2014: with special feature on adults 55-64. Hyattsville, MD: 2015. [PubMed] [Google Scholar]
- 100.Maslin Nir S. New York Times. New York: 2012. For many Asian New Yorkers, smoking is still a way of life; p. A19. [Google Scholar]
- 101.Tanjasiri SP, Lew R, Mouttapa M, et al. Environmental influences on tobacco use among Asian American and Pacific Islander youth. Health Promot Pract. 2013;14:40S–47S. doi: 10.1177/1524839913484762. [DOI] [PMC free article] [PubMed] [Google Scholar]
- 102.Romero DR, Pulvers K. Cigarette smoking among Asian American and Pacific Islander college students: implications for college health promotion. Health Promot Pract. 2013;14:61S–69S. doi: 10.1177/1524839913482923. [DOI] [PubMed] [Google Scholar]
- 103.Chang E, Fung LC, Li CS, et al. Offering acupuncture as an adjunct for tobacco cessation: a community clinic experience. Health Promot Pract. 2013;14:80S–87S. doi: 10.1177/1524839913485756. [DOI] [PMC free article] [PubMed] [Google Scholar]
- 104.Kuiper N, Zhang L, Lee J, et al. A National Asian-Language Smokers' Quitline - United States, 2012-2014. Prev Chronic Dis. 2015;12:E99. doi: 10.5888/pcd12.140584. [DOI] [PMC free article] [PubMed] [Google Scholar]
- 105.International WCRF. Cancers linked with greater body fatness. Available at: http://www.wcrf.org/int/cancer-facts-figures/link-between-lifestyle-cancer-risk/cancers-linked-greater-body-fatness. Accessed November 5, 2015.
- 106.World Health Organization Expert Consultation Appropriate body-mass index for Asian populations and its implications for policy and intervention strategies. Lancet. 2004;363:157–163. doi: 10.1016/S0140-6736(03)15268-3. [DOI] [PubMed] [Google Scholar]
- 107.Araneta MR, Kanaya AM, Hsu WC, et al. Optimum BMI cut points to screen Asian Americans for type 2 diabetes. Diabetes Care. 2015;38:814–820. doi: 10.2337/dc14-2071. [DOI] [PMC free article] [PubMed] [Google Scholar]
- 108.Hsu WC, Araneta MR, Kanaya AM, Chiang JL, Fujimoto W. BMI cut points to identify at-risk Asian Americans for type 2 diabetes screening. Diabetes Care. 2015;38:150–158. doi: 10.2337/dc14-2391. [DOI] [PMC free article] [PubMed] [Google Scholar]
- 109.Renehan AG, Tyson M, Egger M, Heller RF, Zwahlen M. Body-mass index and incidence of cancer: a systematic review and meta-analysis of prospective observational studies. Lancet. 2008;371:569–578. doi: 10.1016/S0140-6736(08)60269-X. [DOI] [PubMed] [Google Scholar]
- 110.Ning Y, Wang L, Giovannucci EL. A quantitative analysis of body mass index and colorectal cancer: findings from 56 observational studies. Obes Rev. 2010;11:19–30. doi: 10.1111/j.1467-789X.2009.00613.x. [DOI] [PubMed] [Google Scholar]
- 111.Jee SH, Yun JE, Park EJ, et al. Body mass index and cancer risk in Korean men and women. Int J Cancer. 2008;123:1892–1896. doi: 10.1002/ijc.23719. [DOI] [PubMed] [Google Scholar]
- 112.Kuriyama S, Tsubono Y, Hozawa A, et al. Obesity and risk of cancer in Japan. Int J Cancer. 2005;113:148–157. doi: 10.1002/ijc.20529. [DOI] [PubMed] [Google Scholar]
- 113.Park Y, Wang S, Kitahara CM, et al. Body mass index and risk of death in Asian Americans. Am J Public Health. 2014;104:520–525. doi: 10.2105/AJPH.2013.301573. [DOI] [PMC free article] [PubMed] [Google Scholar]
- 114.Parr CL, Batty GD, Lam TH, et al. Body-mass index and cancer mortality in the Asia-Pacific Cohort Studies Collaboration: pooled analyses of 424,519 participants. Lancet Oncol. 2010;11:741–752. doi: 10.1016/S1470-2045(10)70141-8. [DOI] [PMC free article] [PubMed] [Google Scholar]
- 115.Zheng W, McLerran DF, Rolland B, et al. Association between body-mass index and risk of death in more than 1 million Asians. New Engl J Med. 2011;364:719–729. doi: 10.1056/NEJMoa1010679. [DOI] [PMC free article] [PubMed] [Google Scholar]
- 116.Centers for Disease Control and Prevention (CDC), National Center for Health Statistics (NCHS) National Health and Nutrition Examination Survey Data. US Department of Health and Human Services, Centers for Disease Control and Prevention; Hyattsville, MD: 2011-2012. [Google Scholar]
- 117.Singh GK, Siahpush M, Hiatt RA, Timsina LR. Dramatic increases in obesity and overweight prevalence and body mass index among ethnic-immigrant and social class groups in the United States, 1976-2008. J Community Health. 2011;36:94–110. doi: 10.1007/s10900-010-9287-9. [DOI] [PMC free article] [PubMed] [Google Scholar]
- 118.Guerrero AD, Ponce NA, Chung PJ. Obesogenic Dietary Practices of Latino and Asian Subgroups of Children in California: An Analysis of the California Health Interview Survey, 2007-2012. Am J Public Health. 2015;105:e105–e112. doi: 10.2105/AJPH.2015.302618. [DOI] [PMC free article] [PubMed] [Google Scholar]
- 119.IARC Monographs on the Evaluation of Carcinogenic Risks to Humans Vol. 100E Personal Habits and Indoor Combustions. 2012 [PMC free article] [PubMed] [Google Scholar]
- 120.Boffetta P, Hashibe M. Alcohol and cancer. The Lancet Oncology. 2006;7:149–156. doi: 10.1016/S1470-2045(06)70577-0. [DOI] [PubMed] [Google Scholar]
- 121.Manuel JK, Satre DD, Tsoh J, et al. Adapting Screening, Brief Intervention, and Referral to Treatment for Alcohol and Drugs to Culturally Diverse Clinical Populations. J Addict Med. 2015;9:343–351. doi: 10.1097/ADM.0000000000000150. [DOI] [PMC free article] [PubMed] [Google Scholar]
- 122.Fock KM, Ang TL. Epidemiology of Helicobacter pylori infection and gastric cancer in Asia. J Gastroenterol Hepatol. 2010;25:479–486. doi: 10.1111/j.1440-1746.2009.06188.x. [DOI] [PubMed] [Google Scholar]
- 123.Everhart JE, Kruszon-Moran D, Perez-Perez GI, Tralka TS, McQuillan G. Seroprevalence and ethnic differences in Helicobacter pylori infection among adults in the United States. J Infect Dis. 2000;181:1359–1363. doi: 10.1086/315384. [DOI] [PubMed] [Google Scholar]
- 124.Kamineni A, Williams MA, Schwartz SM, Cook LS, Weiss NS. The incidence of gastric carcinoma in Asian migrants to the United States and their descendants. Cancer Causes Control. 1999;10:77–83. doi: 10.1023/a:1008849014992. [DOI] [PubMed] [Google Scholar]
- 125.Herrero R, Parsonnet J, Greenberg ER. Prevention of gastric cancer. JAMA. 2014;312:1197–1198. doi: 10.1001/jama.2014.10498. [DOI] [PubMed] [Google Scholar]
- 126.Pollack HJ, Kwon SC, Wang SH, Wyatt LC, Trinh-Shevrin C. Chronic hepatitis B and liver cancer risks among Asian immigrants in New York City: Results from a large, community-based screening, evaluation, and treatment program. Cancer Epidemiol Biomarkers Prev. 2014;23:2229–2239. doi: 10.1158/1055-9965.EPI-14-0491. [DOI] [PMC free article] [PubMed] [Google Scholar]
- 127.Centers for Disease Control and Prevention Viral hepatitis-CDC recommendations for specific populations: Asian & Pacific Islanders. Available at: http://www.cdc.gov/hepatitis/populations/api.htm. Accessed August 10, 2015.
- 128.Chiang CJ, Yang YW, You SL, Lai MS, Chen CJ. Thirty-year outcomes of the national hepatitis B immunization program in Taiwan. JAMA. 2013;310:974–976. doi: 10.1001/jama.2013.276701. [DOI] [PubMed] [Google Scholar]
- 129.Averhoff FM, Glass N, Holtzman D. Global burden of hepatitis C: considerations for healthcare providers in the United States. Clin Infect Dis. 2012;55(Suppl 1):S10–15. doi: 10.1093/cid/cis361. [DOI] [PubMed] [Google Scholar]
- 130.Tohme RA, Xing J, Liao Y, Holmberg SD. Hepatitis C testing, infection, and linkage to care among racial and ethnic minorities in the United States, 2009-2010. Am J Public Health. 2013;103:112–119. doi: 10.2105/AJPH.2012.300858. [DOI] [PMC free article] [PubMed] [Google Scholar]
- 131.Di Bisceglie AM, Lyra AC, Schwartz M, et al. Hepatitis C-related hepatocellular carcinoma in the United States: influence of ethnic status. Am J Gastroenterol. 2003;98:2060–2063. doi: 10.1111/j.1572-0241.2003.t01-1-07641.x. [DOI] [PubMed] [Google Scholar]
- 132.U.S. Preventive Services Task Force Final recommendation statement: Hepatitis B, nonpregnant adolescents and adults: Screening. 2014 May; Available at: http://www.uspreventiveservicestaskforce.org/Page/Document/RecommendationStatementFinal/hepatitis-b-virus-infection-screening-2014. Accessed August 10, 2015.
- 133.Centers for Disease Control and Prevention CDC Recommendations for the Identification of Chronic Hepatitis C Virus Infection among Persons Born During 1945–1965. Available at: http://www.cdc.gov/hepatitis/HCV/1945-1965.htm. Accessed September 25, 2014.
- 134.Chen MS, Jr., Fang DM, Stewart SL, et al. Increasing hepatitis B screening for Hmong adults: results from a randomized controlled community-based study. Cancer Epidemiol Biomarkers Prev. 2013;22:782–791. doi: 10.1158/1055-9965.EPI-12-1399. [DOI] [PMC free article] [PubMed] [Google Scholar]
- 135.Bastani R, Glenn BA, Maxwell AE, et al. Cluster-Randomized Trial to Increase Hepatitis B Testing among Koreans in Los Angeles. Cancer Epidemiol Biomarkers Prev. 2015;24:1341–1349. doi: 10.1158/1055-9965.EPI-14-1396. [DOI] [PMC free article] [PubMed] [Google Scholar]
- 136.Nguyen TT, McPhee SJ, Stewart S, et al. Factors associated with hepatitis B testing among Vietnamese Americans. J Gen Intern Med. 2010;25:694–700. doi: 10.1007/s11606-010-1285-1. [DOI] [PMC free article] [PubMed] [Google Scholar]
- 137.Hsu L, Bowlus CL, Stewart SL, et al. Electronic messages increase hepatitis B screening in at-risk Asian American patients: a randomized, controlled trial. Dig Dis Sci. 2013;58:807–814. doi: 10.1007/s10620-012-2396-9. [DOI] [PMC free article] [PubMed] [Google Scholar]
- 138.Human papillomavirus-associated cancers - United States, 2004-2008. MMWR Morb Mortal Wkly Rep. 2012;61:258–261. [PubMed] [Google Scholar]
- 139.Datta SD, Koutsky LA, Ratelle S, et al. Human papillomavirus infection and cervical cytology in women screened for cervical cancer in the United States, 2003-2005. Ann Intern Med. 2008;148:493–500. doi: 10.7326/0003-4819-148-7-200804010-00004. [DOI] [PubMed] [Google Scholar]
- 140.Bastani R, Glenn BA, Tsui J, et al. Understanding suboptimal human papillomavirus vaccine uptake among ethnic minority girls. Cancer Epidemiol Biomarkers Prev. 2011;20:1463–1472. doi: 10.1158/1055-9965.EPI-11-0267. [DOI] [PMC free article] [PubMed] [Google Scholar]
- 141.Taylor VM, Burke NJ, Ko LK, et al. Understanding HPV vaccine uptake among Cambodian American girls. J Community Health. 2014;39:857–862. doi: 10.1007/s10900-014-9844-8. [DOI] [PMC free article] [PubMed] [Google Scholar]
- 142.Ward E, Halpern M, Schrag N, et al. Association of insurance with cancer care utilization and outcomes. CA Cancer J Clin. 2008;58:9–31. doi: 10.3322/CA.2007.0011. [DOI] [PubMed] [Google Scholar]
- 143.Hou SI, Sealy DA, Kabiru CW. Closing the disparity gap: cancer screening interventions among Asians--a systematic literature review. Asian Pac J Cancer Prev. 2011;12:3133–3139. [PubMed] [Google Scholar]
- 144.Braun KL, Kagawa-Singer M, Holden AE, et al. Cancer patient navigator tasks across the cancer care continuum. J Health Care Poor Underserved. 2012;23:398–413. doi: 10.1353/hpu.2012.0029. [DOI] [PMC free article] [PubMed] [Google Scholar]
- 145.National Center for Health Statistics, Centers for Disease Control and Prevention . National Health Interview Survey Public Use Data File 2013. National Center for Health Statistics, Centers for Disease Control and Prevention; Atlanta, GA: 2014. [Google Scholar]
- 146.Thompson CA, Gomez SL, Chan A, et al. Patient and provider characteristics associated with colorectal, breast, and cervical cancer screening among Asian Americans. Cancer Epidemiol Biomarkers Prev. 2014;23:2208–2217. doi: 10.1158/1055-9965.EPI-14-0487. [DOI] [PMC free article] [PubMed] [Google Scholar]
- 147.Taylor VM, Nguyen TT, Jackson JC, McPhee SJ. Cervical cancer control research in Vietnamese American communities. Cancer Epidemiol Biomarkers Prev. 2008;17:2924–2930. doi: 10.1158/1055-9965.EPI-08-0386. [DOI] [PMC free article] [PubMed] [Google Scholar]
- 148.Taylor VM, Yasui Y, Nguyen TT, et al. Pap smear receipt among Vietnamese immigrants: the importance of health care factors. Ethn Health. 2009;14:575–589. doi: 10.1080/13557850903111589. [DOI] [PMC free article] [PubMed] [Google Scholar]
- 149.Ho R, Muraoka M, Cuaresma C, Guerrero R, Agbayani A. Addressing the excess breast cancer mortality in Filipino women in Hawai'i through AANCART, an NCI community network program. Hawaii Med J. 2010;69:164–166. [PMC free article] [PubMed] [Google Scholar]
- 150.AskCHIS 2009 California Health Interview Survey. Available at: ask.chis.ucla.edu. Accessed October 22, 2015.
- 151.Ma GX, Shive S, Tan Y, et al. Community-based colorectal cancer intervention in underserved Korean Americans. Cancer Epidemiol. 2009;33:381–386. doi: 10.1016/j.canep.2009.10.001. [DOI] [PubMed] [Google Scholar]
- 152.Hwang H. Colorectal cancer screening among Asian Americans. Asian Pacific journal of cancer prevention : APJCP. 2013;14:4025–4032. doi: 10.7314/apjcp.2013.14.7.4025. [DOI] [PubMed] [Google Scholar]
- 153.Smith RA, Manassaram-Baptiste D, Brooks D, et al. Cancer screening in the United States, 2015: a review of current American cancer society guidelines and current issues in cancer screening. CA Cancer J Clin. 2015;65:30–54. doi: 10.3322/caac.21261. [DOI] [PubMed] [Google Scholar]
- 154.Fedewa SA, Sauer AG, Siegel RL, Jemal A. Prevalence of Major Risk Factors and Use of Screening Tests for Cancer in the United States. Cancer Epidemiol Biomarkers Prev. 2015;24:637–652. doi: 10.1158/1055-9965.EPI-15-0134. [DOI] [PubMed] [Google Scholar]
- 155.Han PK, Kobrin S, Breen N, et al. National evidence on the use of shared decision making in prostate-specific antigen screening. Ann Fam Med. 2013;11:306–314. doi: 10.1370/afm.1539. [DOI] [PMC free article] [PubMed] [Google Scholar]
- 156.Aberle DR, Adams AM, Berg CD, et al. Reduced lung-cancer mortality with low-dose computed tomographic screening. New Engl J Med. 2011;365:395–409. doi: 10.1056/NEJMoa1102873. [DOI] [PMC free article] [PubMed] [Google Scholar]
- 157.Wender R, Fontham ET, Barrera E, Jr., et al. American Cancer Society lung cancer screening guidelines. CA Cancer J Clin. 2013;63:107–117. doi: 10.3322/caac.21172. [DOI] [PMC free article] [PubMed] [Google Scholar]
- 158.Doria-Rose VP, White MC, Klabunde CN, et al. Use of lung cancer screening tests in the United States: results from the 2010 National Health Interview Survey. Cancer Epidemiol Biomarker Prev. 2012;21:1049–1059. doi: 10.1158/1055-9965.EPI-12-0343. [DOI] [PMC free article] [PubMed] [Google Scholar]
- 159.Nguyen AB, Chawla N, Noone AM, Srinivasan S. Disaggregated data and beyond: future queries in cancer control research. Cancer Epidemiol Biomarkers Prev. 2014;23:2266–2272. doi: 10.1158/1055-9965.EPI-14-0387. [DOI] [PMC free article] [PubMed] [Google Scholar]
- 160.Centers for Disease Control and Prevention Native Hawaiian and Pacific Islander National Health Interview Survey. Available at: http://www.cdc.gov/nchs/nhis/nhpi.html. Accessed October 13, 2015.