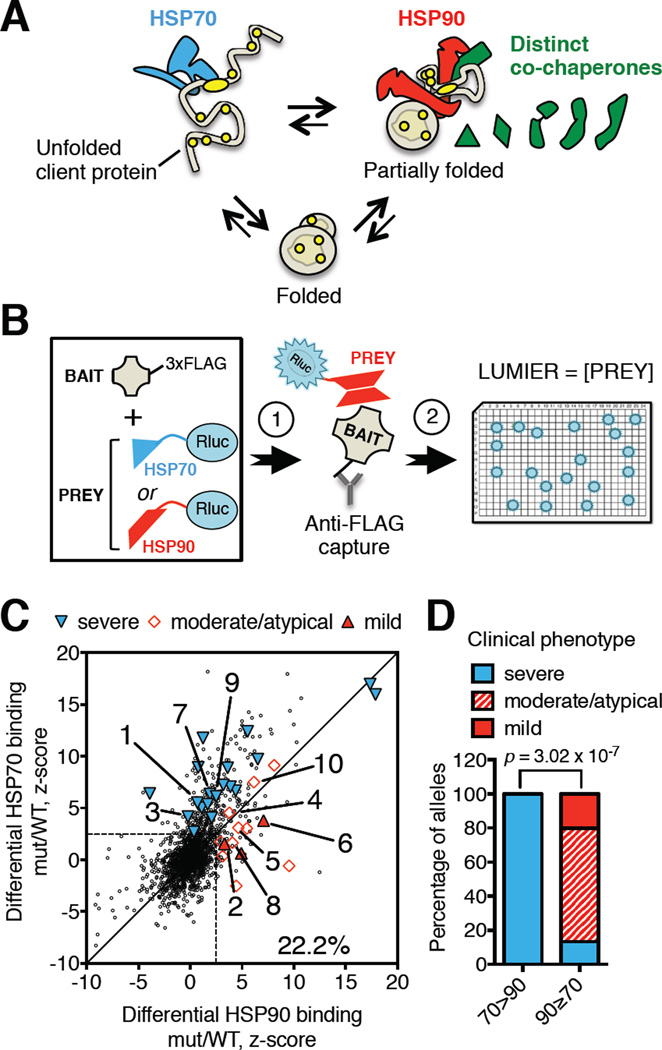
Figure 1. Pattern of increased chaperone engagement reflects mutant severity across diverse human diseases.
(A) Schematic protein-folding pathway modeling HSP70- or HSP90-bound client polypeptide conformations. HSP70 (blue) recognizes an extended hydrophobic (yellow) chain (unfolded client protein). HSP90 (red) recognizes structured polypeptides that are less hydrophobic (partially folded) with assistance from specialized co-chaperones (green). The fully folded, active state (folded) binds neither.
(B) Schematic of LUMIER assays. HEK293T cells stably expressing Renilla luciferase-tagged fusions of the constitutive chaperones HSP90 (HSP90β) or HSP70 (HSPA8) (PREY) are transiently transfected with a library of plasmids encoding FLAG-tagged proteins (BAIT) (arrow 1). Bait proteins are captured by incubation of whole cell lysates on anti-FLAG antibody-coated plates. The relative amount of co-captured chaperone is measured by luciferase assays (arrow 2). Bait protein levels are subsequently measured by FLAG-ELISA to determine expression levels and calculate chaperone interaction scores.
(C) Plot of chaperone interaction scores of 1628 missense mutants relative to the corresponding wild-type protein for HSP90 (x-axis) and HSP70 (y-axis) (dataset from (Sahni et al., 2015)). ∼ 22% of disease-causing mutants exhibit an increased interaction with HSP90 or HSP70 (area outside of the dashed lines). Literature curated clinical phenotypes of comparable mutants are grouped into severe, moderate or mild phenotypic classes. Severe: 1: SOD1-G41S; 3: GGCX-T591K; 7: AKR1D1-L106F, 9: GNAS-I103T. Moderate: 4: GGCX-W157R; 5: AAAS-S263P, 8: AKR1D1-P198L; 10: GNAS-A366S. Mild: 2: SOD1-G37R; 6: AAAS-L430F.
(D) Correlation between reported clinical phenotype and the pattern of chaperone engagement of mutant proteins (HSP70-preferring: 70>90, compared to HSP90-preferring: 90≥70). Reported p value was determined by Fisher’s exact 2×3 extension test.

