

Abstract
Background and aims
TAC is associated with incident CVD and all-cause mortality. Nevertheless, the independent 10-year prognostic value of TAC in individuals with CAC=0 beyond traditional risk factors is not well established.
Methods
3,415 MESA participants with baseline CAC=0 were followed for CHD, CVD events and all-cause mortality. TAC was measured in the ascending and descending aorta in all participants and quantified using Agatston’s score. Multivariable Cox proportional hazards regression models were used to study the associations between TAC and incident CHD, CVD events and all-cause mortality. Likelihood ratio tests were used to compare prediction models including traditional risk factors plus TAC versus risk factors alone.
Results
406 participants (11.9%) had TAC>0 at baseline. Over a median follow-up of 11.3 years, unadjusted event rates per 1000 person-years were higher in TAC>0 than in TAC=0 participants: CHD 2.18 vs. 2.03; CVD 6.85 vs. 3.42; all-cause mortality 12.84 vs. 4.96. However, in multivariable Cox regression analyses adjusting for CVD risk factors, neither TAC>0, TAC>100 nor log(TAC+1) were independently associated with any of the study outcomes, nor improved their prediction compared to traditional risk factors alone (p value of likelihood ratio tests >0.05).
Conclusions
In a multi-ethnic, modern US population of asymptomatic individuals with CAC=0 at baseline, the prevalence of TAC>0 was low, and TAC did not improve 10-year estimation of prognosis beyond traditional risk factors. In the presence of CAC=0, measurement of TAC is unlikely to provide sufficient additional prognostic information to further improve risk assessment.
Keywords: Thoracic aortic calcification, coronary artery calcium, cardiovascular disease, all-cause mortality
Introduction
Coronary artery calcium (CAC) is currently the most robust prognostic tool for cardiovascular disease (CVD) risk assessment. 1, 2 A high CAC burden has been strongly and independently associated with increased incidence of coronary heart disease (CHD) events, CVD events, and all-cause mortality beyond traditional risk factors. 3-6 On the other hand, the presence of a CAC score of zero (CAC=0) has been consistently associated with very low risk of future CVD events and mortality in asymptomatic individuals. 7, 8 Despite the low event rates observed in the presence of CAC=0, there is increasing interest in imaging techniques targeting other vascular beds such as the thoracic aorta to better identify those few CAC=0 individuals who will develop a CHD, CVD event or die in the following 10 years. The presence of thoracic aortic calcium (TAC) in the ascending and/or descending thoracic aorta is associated with CHD, CVD events and all-cause mortality. 9-12 While coronary calcification occurs within the intimal layer of the coronary arteries and is almost exclusively associated with atherosclerosis, calcification of the aortic wall can occur both in the intima and medial layers. The latter is associated with increased arterial stiffening, a process which is known to be independently associated with CVD events. 13-15 Accordingly, TAC, which can be measured using the same imaging protocol that is used for measuring coronary calcification, may provide additional prognostic information beyond that provided by CAC at no additional radiation or cost. 9-12 This may be particularly relevant in individuals with CAC=0, in which a high burden of TAC could impact their management and follow-up plan. Previous studies on the additional prognostic value of TAC in individuals with CAC=0 have been limited by short follow-up periods, precluding our understanding of the 10-year prognostic value of TAC in these individuals. 16 In the Multi-Ethnic Study of Atherosclerosis (MESA), 17 CAC and TAC were measured at baseline, and 50% of participants had CAC=0. 3 With a follow-up of more than 10 years, MESA provides an excellent opportunity to assess the 10-year prognostic value of TAC in a multi-ethnic population of asymptomatic individuals with CAC=0. The aim of our study was thus to investigate the prevalence of thoracic aortic calcification among asymptomatic individuals with CAC=0 at baseline, and to evaluate the 10-year prognostic value of TAC in predicting CHD, CVD events, and all-cause mortality beyond traditional risk factors.
Materials and methods
Study population
MESA is a NHLBI-funded, population-based prospective cohort study. Started in 2000, MESA aims to characterize the prognosis of subclinical CVD in a multi-ethnic US population. Between July 2000 and August 2002, 6,814 men and women of 4 self-reported racial/ethnic groups (non-Hispanic Whites, non-Hispanic African-Americans, Hispanics, and Asian Americans) were recruited, representing 6 US communities (Baltimore City and Baltimore County [MD], Chicago [IL], Forsyth County [NC], Los Angeles County [CA], Northern Manhattan and Bronx [NY], and St. Paul [MN]). Participants were 45 to 84 years of age at the time of enrollment, and all of them were free of clinical CVD. The study protocol was approved by the IRB of each study site, and written informed consent was provided by all participants before the first study examination. For the purposes of this study, only those participants with a baseline CAC score of zero were included in the analyses (N = 3,415).
CAC and TAC measurement
In MESA, all study participants underwent non-contrast cardiac computed tomographic scanning for CAC scoring as part of their baseline assessment (Visit 1). Full details of the CAC measurement and scoring protocol have been described previously. 17,18 Briefly, non-enhanced computed tomography (CT) was performed on either a cardiac-gated electron-beam computed tomography scanner (Chicago, Los Angeles, and New York field centers) (Imatron C-150; Imatron, San Francisco, California) 19 or a multidetector computed tomography system (Baltimore, Forsyth County, and St. Paul field centers) (Lightspeed, General Electric Medical Systems, Waukesha, Wisconsin; or Volume Zoom, Siemens, Erlanger, Germany). 20 The scanning parameters were: prospective ECG-triggering at 60% of the RR interval, fixed 130 kV peak tube voltage, fixed 630 mA tube current, 100 ms exposure time, and 3 mm slice thickness for the electron beam CT scanners; prospective ECG- triggering at 400 ms prior to the next R wave, 120 kV tube voltage, 420 mA tube current, 250 ms exposure time, and 2.5 mm slice thickness for the multidetector scanner. 18 A 30- to 35-cm field of view was used in all study participants for both CAC and TAC scoring purposes. This field encompassed the heart from the carina to the apex, and included large segments of the ascending and descending thoracic arteries.
All CT scans were read by a radiologist or cardiologist at the central MESA reading center (Los Angeles Biomedical Research Institute at Harbor–University of California, Los Angeles, Torrance, CA). Coronary artery calcification was determined to be present if there was calcification in the coronary arteries equal to or greater than the minimum density of 130 Hounsfield units. The CAC score was calculated for each study participant following the Agatston scoring method. 21
Baseline TAC burden was also measured from each participant’s computed tomographic scan, from the same field of view as a CAC score. Z-axis coverage of CAC and TAC was from the aortic annulus, above the aortic valve, to the lower edge of the pulmonary artery bifurcation (ascending aorta); and from the lower edge of the pulmonary bifurcation, to the cardiac apex (descending aorta). The TAC score was determined for each study participant using the Agatston score, which although originally intended to be used as a CAC scoring system, has also been widely used in the scientific literature as a convenient TAC quantification method. 16 The aortic arch could not be visualized in the available tomographic sections, therefore calcifications in the arch were not taken into account in the TAC score calculation.
Assessment of covariates
Sociodemographic variables and information on cardiovascular risk factors and medication use was collected in the baseline MESA study visit. Current smoking was defined as having smoked a cigarette in the past 30 days, whereas former smoking was defined as being a non-current smoker who had smoked ≥100 cigarettes in their lifetime.17 Participants not fulfilling any of the 2 criteria were considered never smokers. Resting blood pressure was measured using an automated oscillometric method (Dinamap model Pro 100 automated oscillometric sphygmomanometer), 3 times from the right arm in the seated position, and the second and third readings were averaged and used in analyses. 17 Use of antihypertensive and other medications was assessed based on the clinic staff documentation of prescribed medications. Presence or absence of any family history of CHD was determined using a validated questionnaire. 17
Laboratory measurements were also performed at the baseline MESA study visit. Total and high-density lipoprotein cholesterol and fasting glucose levels were measured from 12-hour fasting blood samples. Estimated glomerular filtration rate was calculated using the creatinine-based Chronic Kidney Disease Epidemiology Collaboration (CKD-EPI) equation. 22 Diabetes was defined as a self-reported diagnosis, treatment use for diabetes, or fasting blood glucose of ≥126mg/dL.
Follow-up and event ascertainment
Study participants were followed for a median of 11.3 years (mean 10.9 years). Full details of the event surveillance procedures used in MESA have been described before. 17 In brief, incident events were identified combining periodic telephone interviews and review of medical records and death certificates by trained study staff. Events were adjudicated by the MESA study events committee using the following definitions. Hard CHD events were defined as non-fatal myocardial infarction, resuscitated cardiac arrest or CHD death. All CHD events included hard CHD events, definite angina, and probable angina if accompanied by a revascularization procedure. Stroke was defined as a focal neurologic deficit lasting more than 24 hours or until death. If there was a clinically relevant lesion confirmed by brain imaging the event was considered a stroke, even if the deficit lasted less than 24 hours. TIA was defined as a transient neurologic deficit lasting no longer than 24 hours, and without a clinically relevant lesion confirmed by brain imaging in the absence of a nonvascular cause of the event. Hard CVD events were defined as hard CHD, stroke, and cerebrovascular death. All CVD events included any CHD event, fatal/non-fatal stroke, and other CVD death. All-cause mortality was determined using death certificates, hospital medical records and autopsy reports.
Statistical analysis
Baseline characteristics of the study participants, both overall and stratified by TAC burden, were analyzed. Differences between TAC=0 and TAC>0 participants were compared using chi-squared tests for proportions, and t-tests and non-parametric tests for continuous normally and non-normally distributed variables, respectively.
Crude event rates per 1000 person-years were calculated for each of the 7 study outcomes (CHD hard, CHD all, stroke, TIA, CVD hard, CVD all, and all-cause mortality) by baseline TAC strata. Kaplan-Meier cumulative survival functions were used to compare the event-free survival experience of TAC>0 versus TAC=0 participants for each study outcome. Log-rank tests were used to compare event-free cumulative survival between the 2 groups.
Multivariable Cox proportional hazards regression models were used to evaluate the associations between TAC (modeled both as TAC >0 vs. TAC=0 and as log[TAC+1]) and each of the study outcomes. For all of them, 3 models were used to account progressively for potential confounding: Model 1 was unadjusted; Model 2 adjusted for age, sex and self-reported race/ethnicity; and Model 3 adjusted for the covariates included in Model 2 plus baseline smoking status, systolic blood pressure, medication use for hypertension, diabetes, total and high density lipoprotein cholesterol levels, medication use for hyperlipidemia, family history of CHD (at any age), and estimated glomerular filtration rate. No significant deviations from the proportional hazards assumption were observed. In exploratory analyses, TAC>0 was further stratified as >0 - <100 and ≥100. In addition, to test the presence of significant effect modification by age, sex or race/ethnicity, log(TAC+1)*age, log(TAC+1)*sex and log(TAC+1)*race/ethnicity interaction terms were included in the fully adjusted regression models.
Finally, to assess the incremental 10-year prognostic value of TAC in predicting the study outcomes beyond the risk factors included in the 2013 American College of Cardiology / American Heart Association (ACC/AHA) 10-year CVD risk estimator, we compared prediction models including the ACC/AHA risk factors plus TAC (categorical or continuous) versus the ACC/AHA risk factors alone, using likelihood ratio tests.
A p value of 0.05 was used as threshold for statistical significance. All statistical analyses were performed using Stata statistical software package, version 12.0 (StataCorp. 2011, College Station, TX).
Results
Study population
A total of 3,415 MESA participants had a CAC score of zero at baseline. Among them, median age was 55 years (interquartile range 50 – 65 years) and 63% were women. TAC>0 was present in 11.9% of the study population, and 6.1% had TAC>100. Compared to TAC=0 participants, those with TAC>0 were older (68 vs. 55 years, p<0.001), more often female (74% vs. 62%, p<0.001) and had a higher prevalence of hypertension (56% vs. 32%, p<0.001), diabetes (12% vs. 9%, p=0.042) and dyslipidemia (54% vs. 46%, p=0.002). Baseline characteristics of the study participants, both overall and stratified by TAC burden, are presented in Table 1.
Table 1.
Baseline characteristics of the study participants.
| All (n = 3,415) | TAC = 0 (n = 3,009) | TAC > 0 (n = 406) | p value | |
|---|---|---|---|---|
| Age, years | 56 (50 - 65) | 55 (50 - 63) | 68 (61 - 74) | <0.001 |
| Male | 1,249 (36.6) | 1,142 (38.0) | 107 (26.4) | <0.001 |
| Race/ethnicity | 0.001 | |||
| Non-Hispanic White | 1,127 (33.0) | 971 (32.3) | 156 (38.4) | |
| African American | 1,071 (31.4) | 964 (32.0) | 107 (26.4) | |
| Hispanic | 818 (24.0) | 738 (24.5) | 80 (19.7) | |
| Chinese American | 399 (11.7) | 336 (11.2) | 63 (15.5) | |
| Body mass index, kg/m2 | 27.5 (24.3 – 31.2) | 27.6 (24.4 – 31.3) | 26.8 (23.8 – 30.2) | 0.005 |
| Family history of heart disease | 1,203 (37.2) | 1,057 (37.1) | 146 (37.8) | 0.794 |
| Current smoker | 451 (13.3) | 398 (13.3) | 53 (13.1) | 0.651 |
| Diabetes | 318 (9.3) | 269 (8.9) | 49 (12.1) | 0.042 |
| Fasting blood glucose, mg/dL | 88 (82 – 97) | 88 (81 – 96) | 90 (83 – 98) | 0.001 |
| Medication use for diabetes | 241 (7.1) | 200 (6.7) | 41 (10.1) | 0.011 |
| Hypertension | 1,197 (35.1) | 969 (32.2) | 228 (56.2) | <0.001 |
| Systolic blood pressure, mmHg | 122 (20) | 121 (19) | 134 (24) | <0.001 |
| Diastolic blood pressure, mmHg | 71 (10) | 71 (10) | 71 (11) | 0.854 |
| Hypertension treatment use | 896 (26.2) | 733 (24.4) | 163 (40.2) | <0.001 |
| Dyslipidemia | 1,600 (46.9) | 1,380 (45.9) | 220 (54.2) | 0.002 |
| Total cholesterol, mg/dL | 194 (35) | 193 (35) | 197 (37) | 0.027 |
| HDL cholesterol, mg/dL | 50 (42 - 61) | 50 (42 - 61) | 51 (42 - 62) | 0.338 |
| Triglycerides, mg/dL | 106 (75 - 155) | 104 (73 - 154) | 117 (84 - 164) | <0.001 |
| Lipid-lowering treatment use | 359 (10.5) | 294 (9.8) | 65 (16.0) | <0.001 |
| EGFR, mL/min/1.73m2 | 81 (15) | 82 (15) | 76 (15) | <0.001 |
Data presented as mean (SD), median (IQR) or N (%).
EGFR, estimated glomerular filtration rate; HDL,high density lipoprotein; TAC, thoracic aorta calcium.
Incident events and all-cause mortality
Number and event rates for each of the study outcomes both overall and stratified by TAC burden are summarized in Table 2. Overall, only 74 CHD events (2.2%), 137 CVD events (4.0%), and 219 deaths (6.4%) were observed over the median follow-up period of 11.3 years. CHD event rates were similar in both groups (2.18 per 1000 person-years in TAC>0 participants [95% CI 1.13 – 4.19] and 2.04 in TAC=0 participants [95% CI 1.59 – 2.59]). On the other hand, stroke, TIA, CVD hard, CVD all and all-cause mortality rates were consistently higher in TAC>0 compared to TAC=0 participants, with the greatest difference being observed in all-cause mortality (12.84 per 1000 person-years in TAC>0 participants [95% CI 9.86 – 16.73] versus 4.96 in TAC=0 participants [95% CI 4.25 – 5.78]).
Table 2.
Number of events and overall incidence rates per 1000 person-years by baseline TAC categories.
| All (n = 3,415) | TAC = 0 (n = 3,009) | TAC > 0 (n = 406) | ||
|---|---|---|---|---|
| CHD All | Number (%) | 74 (2.2) | 65 (2.2) | 9 (2.2) |
| IR (95% CI) | 2.05 (1.63 – 2.57) | 2.03 (1.59 – 2.59) | 2.18 (1.13 – 4.19) | |
| CHD Hard | Number (%) | 57 (1.7) | 51 (1.7) | 6 (1.5) |
| IR (95% CI) | 1.57 (1.21 – 2.04) | 1.59 (1.21 – 2.09) | 1.44 (0.65 – 3.21) | |
| CVD All | Number (%) | 137 (4.0) | 109 (3.6) | 28 (6.9) |
| IR (95% CI) | 3.81 (3.23 – 4.51) | 3.42 (2.84 – 4.13) | 6.85 (4.73 – 9.92) | |
| CVD Hard | Number (%) | 110 (3.2) | 89 (3.0) | 21 (5.2) |
| IR (95% CI) | 3.05 (2.53 – 3.68) | 2.79 (2.27 – 3.43) | 5.11 (3.33 – 7.84) | |
| Stroke | Number (%) | 58 (1.7) | 43 (1.4) | 15 (3.7) |
| IR (95% CI) | 1.60 (1.24 – 2.08) | 1.34 (1.00 – 1.81) | 3.64 (2.19 – 6.03) | |
| TIA | Number (%) | 24 (0.7) | 18 (0.6) | 6 (1.5) |
| IR (95% CI) | 0.66 (0.44 – 0.99) | 0.56 (0.35 – 0.89) | 1.45 (0.65 – 3.22) | |
| All-cause mortality | Number (%) | 219 (6.4) | 164 (5.5) | 55 (13.6) |
| IR (95% CI) | 5.86 (5.13 – 6.69) | 4.96 (4.25 – 5.78) | 12.84 (9.86 – 16.73) |
Data presented as number of events (percentage), and incidence rates per 1000 person-years (95% confidence intervals).
CHD, coronary heart disease; CI, confidence interval; CVD, cardiovascular disease; IR, incidence rate; TAC, thoracic aorta calcium; TIA, transient ischemic attack.
Unadjusted associations between TAC, incident events and all-cause mortality
Figures 1-3 display the unadjusted Kaplan-Meier survival functions for all CHD events, all CVD events, and all-cause mortality by TAC strata. According to the unadjusted Log-rank tests, baseline TAC burden was significantly associated with incident CVD events and mortality (p value <0.001), but not with CHD events.
Fig. 1. Kaplan-Meier survival curves for CHD events (all) by TAC groups.
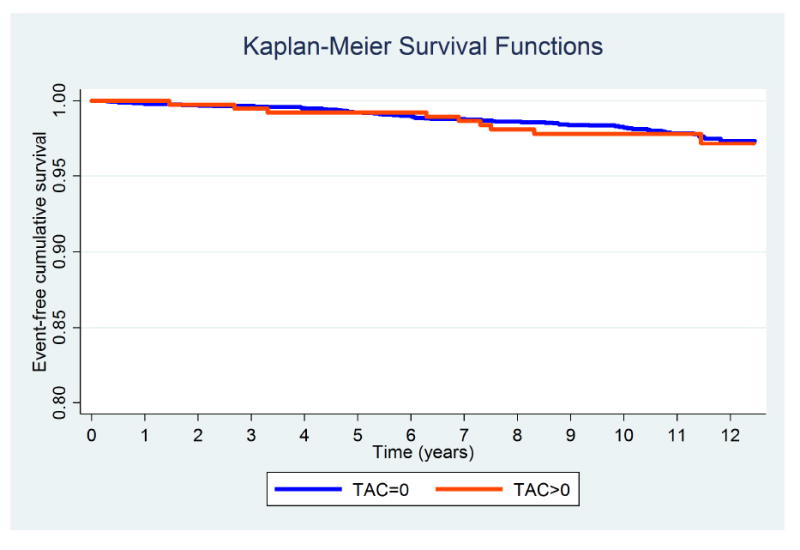
Log-Rank test p value 0.806.
Fig. 3. Kaplan-Meier survival curves for all-cause mortality by TAC groups.
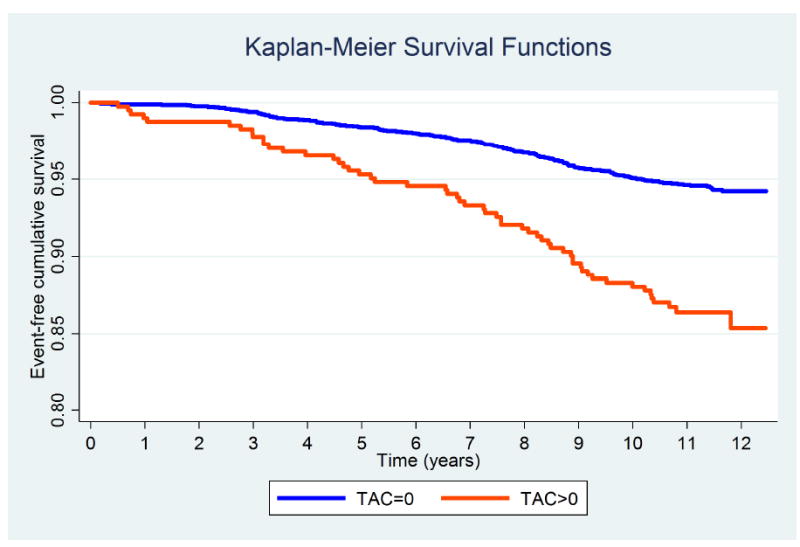
Log-Rank test p value < 0.001.
Tables 3 and 4 show the crude (Model 1) associations between baseline TAC and the 7 study outcomes. TAC>0 compared to TAC=0 was significantly associated with all and hard CVD events, incident stroke, incident TIA and all-cause mortality, whereas there was no crude association between baseline TAC and incident CHD events (Table 3, Model 1). Similar results were observed when baseline TAC burden was modeled as log(TAC+1) (Table 4, Model 1). Further stratification of TAC>0 as >0 - <100 and ≥ 100 yielded even stronger crude associations between TAC>100 (compared to TAC=0) and stroke, TIA and all-cause mortality (Table 5, Model 1).
Table 3.
Hazard ratios and 95% confidence intervals for incident events and all-cause mortality for TAC>0 vs. TAC=0.
| Model 1 | Model 2 | Model 3 | ||||
|---|---|---|---|---|---|---|
|
| ||||||
| HR (95% CI) | p | HR (95% CI) | p | HR (95% CI) | p | |
| CHD All | 1.09 (0.54 – 2.19) | 0.806 | 0.93 (0.44 – 1.97) | 0.857 | 0.75 (0.35 – 1.60) | 0.461 |
| CHD Hard | 0.93 (0.40 – 2.16) | 0.858 | 0.80 (0.33 – 1.96) | 0.630 | 0.64 (0.26 – 1.58) | 0.330 |
| CVD All | 2.03 (1.34 – 3.07) | 0.001 | 1.53 (0.97 – 2.41) | 0.069 | 1.17 (0.73 – 1.87) | 0.504 |
| CVD Hard | 1.86 (1.15 – 2.99) | 0.011 | 1.46 (0.87 – 2.45) | 0.154 | 1.15 (0.68 – 1.95) | 0.609 |
| Stroke | 2.72 (1.51 – 4.90) | 0.001 | 1.89 (0.98 – 3.64) | 0.056 | 1.49 (0.76 – 2.91) | 0.245 |
| TIA | 2.63 (1.04 – 6.62) | 0.041 | 2.58 (0.92 – 7.27) | 0.073 | 2.01 (0.68 – 5.91) | 0.206 |
| All-cause mortality | 2.61 (1.92 – 3.54) | <0.001 | 1.40 (1.00 – 1.96) | 0.048 | 1.19 (0.83 – 1.70) | 0.334 |
Data presented as hazard ratios and 95% confidence intervals.
Model 1: Unadjusted.
Model 2: Adjusted for age, sex and race/ethnicity.
Model 3: Adjusted for Model 2 + smoking status, diabetes, systolic blood pressure, hypertension medication use, total cholesterol, HDL cholesterol, lipid-lowering medication use, EGFR, and family history of heart disease at any age.
CHD, coronary heart disease; CI, confidence interval; CVD, cardiovascular disease; HR, hazard ratio; TIA, transient ischemic attack.
Table 4.
Hazard ratios and 95% confidence intervals for incident events and all-cause mortality with log(TAC+1).
| Model 1 | Model 2 | Model 3 | ||||
|---|---|---|---|---|---|---|
|
| ||||||
| HR (95% CI) | p | HR (95% CI) | p | HR (95% CI) | p | |
| CHD All | 1.00 (0.87 – 1.16) | 0.954 | 0.97 (0.83 – 1.13) | 0.681 | 0.93 (0.79 – 1.08) | 0.339 |
| CHD Hard | 1.01 (0.85 – 1.18) | 0.944 | 0.98 (0.82 – 1.16) | 0.796 | 0.94 (0.78 – 1.12) | 0.459 |
| CVD All | 1.15 (1.06 – 1.24) | 0.001 | 1.08 (0.99 – 1.18) | 0.070 | 1.03 (0.94 – 1.13) | 0.529 |
| CVD Hard | 1.14 (1.04 – 1.25) | 0.004 | 1.09 (0.98 – 1.20) | 0.098 | 1.04 (0.94 – 1.15) | 0.425 |
| Stroke | 1.22 (1.09 – 1.36) | <0.001 | 1.13 (1.00 – 1.28) | 0.045 | 1.09 (0.96 – 1.24) | 0.183 |
| TIA | 1.23 (1.04 – 1.45) | 0.014 | 1.23 (1.02 – 1.49) | 0.030 | 1.18 (0.97 – 1.45) | 0.100 |
| All-cause mortality | 1.23 (1.16 – 1.30) | <0.001 | 1.09 (1.02 – 1.16) | 0.008 | 1.06 (0.99 – 1.13) | 0.101 |
Data presented as hazard ratios and 95% confidence intervals.
Model 1: Unadjusted.
Model 2: Adjusted for age, sex and race/ethnicity.
Model 3: Adjusted for Model 2 + smoking status, diabetes, systolic blood pressure, hypertension medication use, total cholesterol, HDL cholesterol, lipid-lowering medication use, EGFR, and family history of heart disease at any age.
CHD, coronary heart disease; CI, confidence interval; CVD, cardiovascular disease; HR, hazard ratio; TIA, transient ischemic attack.
Table 5.
Hazard ratios and 95% confidence intervals for incident events and all-cause mortality for TAC>100 vs. TAC=0.
| Model 1 | Model 2 | Model 3 | ||||
|---|---|---|---|---|---|---|
|
| ||||||
| HR (95% CI) | p | HR (95% CI) | p | HR (95% CI) | p | |
| CHD All | 0.95 (0.35 – 2.60) | 0.918 | 0.78 (0.43 – 2.78) | 0.641 | 0.60 (0.36 – 2.34) | 0.352 |
| CHD Hard | 0.91 (0.28 – 2.91) | 0.871 | 0.76 (0.23 – 2.59) | 0.667 | 0.60 (0.18 – 2.07) | 0.421 |
| CVD All | 1.98 (1.13 – 3.45) | 0.017 | 1.38 (0.76 – 2.53) | 0.291 | 1.01 (0.54 – 1.89) | 0.986 |
| CVD Hard | 1.90 (1.02 – 3.56) | 0.044 | 1.42 (0.72 – 2.80) | 0.312 | 1.12 (0.56 – 2.23) | 0.747 |
| Stroke | 2.85 (1.34 – 6.07) | 0.006 | 1.83 (0.80 – 4.21) | 0.153 | 1.44 (0.62 – 3.37) | 0.395 |
| TIA | 3.48 (1.18 – 10.28) | 0.024 | 3.59 (1.04 – 12.39) | 0.043 | 2.64 (0.72 – 9.66) | 0.142 |
| All-cause mortality | 3.16 (2.18 – 4.57) | <0.001 | 1.48 (0.99 – 2.22) | 0.055 | 1.23 (0.80 – 1.90) | 0.348 |
Data presented as hazard ratios and 95% confidence intervals.
Model 1: Unadjusted.
Model 2: Adjusted for age, sex and race/ethnicity.
Model 3: Adjusted for Model 2 + smoking status, diabetes, systolic blood pressure, hypertension medication use, total cholesterol, HDL cholesterol, lipid-lowering medication use, EGFR, and family history of heart disease at any age.
CHD, coronary heart disease; CI, confidence interval; CVD, cardiovascular disease; HR, hazard ratio; TIA, transient ischemic attack.
Multivariable-adjusted associations between TAC, incident events and all-causemortality
After basic adjustment for age, sex and race/ethnicity, only incident stroke, TIA and all-cause mortality remained significantly associated with TAC (Tables 3 and 4, Model 2). Further adjustment for additional traditional CVD risk factors resulted in non-significant associations between baseline TAC and all of the study outcomes (Tables 3 and 4, Model 3). Multivariable analyses yielded also statistically non-significant associations between TAC>100 compared to TAC=0 and the 7 study outcomes (Table 5, Model 3).
There were no significant interactions by sex or race/ethnicity for any of the 7 study outcomes. Regarding interactions by age, only for TIA the p value of the coefficient of the interaction term was <0.05 (0.032). Finally, in exploratory, post-hoc analyses, baseline TAC burden was also not associated with a “composite neurological outcome” combining stroke and TIA in fully adjusted models.
Prediction of incident events and all-cause mortality with TAC
Likelihood ratio tests comparing prediction models including the traditional risk factors used in the ACC/AHA 2013 risk estimator with and without TAC were performed to assess the incremental prognostic value of TAC for predicting each study outcome. When TAC was modeled as TAC>0 vs. TAC=0, adding TAC to the models did not yield any significant incremental prognostic information for predicting any of the 7 study outcomes (p values of the likelihood ratio tests for CHD, CVD or all-cause mortality were all >0.20). Similarly, no additive value was demonstrated for log(TAC+1) or for TAC modeled as =0, >0 - <100 and ≥100 (all p values >0.005).
Discussion
After a median follow-up of 11 years, individuals with CAC=0 had very low CHD, CVD event rates and all-cause mortality, and TAC did not independently improve estimation of prognosis. Baseline TAC was not associated with CHD events, though a strong association was seen with incident CVD and all-cause mortality in unadjusted analysis. However, those associations did not remain statistically significant after adjusting for traditional risk factors. Our results highlight the limited value of TAC as an independent prognostic test in CAC=0 patients, particularly for predicting incident CHD. Nevertheless, the finding of TAC should encourage screening and aggressive management of modifiable risk factors in CAC=0 individuals.
Direct measurement of calcium in the coronary arteries is a highly specific test for detecting underlying subclinical atherosclerosis. 23, 24 A high CAC score is a powerful predictor of CHD events and all-cause mortality. 25 Furthermore, a recent analysis in MESA suggests that CAC is also a powerful, independent predictor of stroke, and adds incremental predictive value to clinical risk factors. 4 The 2013 ACC/AHA guidelines recommend the use of coronary calcium score in selected individuals to further assess cardiovascular risk accurately when the decision to use statin therapy is uncertain. 26
Subjects with CAC=0 have a very low risk of cardiovascular events and all-cause mortality. 7, 8 Thus, Blaha et al. demonstrated that the absence of CAC in asymptomatic patients predicts low risk of developing CHD and dying in the following 10 years. 7 Our study results are consistent with those from the previous literature, with CHD, CVD event rates and all-cause mortality being very low after more than 11 years of follow-up.
Despite this excellent prognosis, event rates in CAC=0 individuals are not zero. In the era of precision medicine, the development of tools for the detection of those CAC=0 subjects most likely to have a cardiovascular event or die in the next 10 years appears highly relevant, particularly if those tools are convenient and inexpensive. In this context, assessment of aortic calcification can be readily measured using CT scans done for CAC scoring, without additional radiation or extra cost. Multiple studies have observed that calcification and/or atherosclerosis of the aorta detected by various modalities is an independent predictor of CHD and stroke. 27-29 An autopsy study demonstrated that 58% of ischemic stroke patients of an unknown cause had ulcerative plaques in the aortic arch. 30 The French Study of Aortic Plaques in Stroke (FAPS) Group also found that atherosclerotic plaques in the aortic arch ≥4mm in thickness were significantly associated with recurrent ischemic stroke. 28
There have been previous efforts to investigate the prognostic value of TAC in subjects with no CAC. 9, 12 Unfortunately, those studies were limited by small sample sizes and relatively short follow-up periods. Budoff et al. found that after a median of 4.1 years of follow-up, baseline TAC was not significantly associated with CHD events in individuals with CAC=0. 9 Santos et al. observed that patients who had TAC without CAC at baseline had a 2.5-fold greater risk of death after a 5-year follow-up compared to those who had no TAC. Nevertheless, this result did not achieve statistical significance (95% CI: 0.99–6.48, p=0.054). 12 Thus, the 10-year prognostic value of TAC in CAC=0 individuals had not been studied in a large, multi-ethnic US population. Moreover, by using a similar modeling of covariates as used by the 2013 ACC/AHA risk estimator, our study provides clear insight on the additional prognostic value of TAC in the context of current, widely used risk assessment tools.
Despite the lack of independent associations between TAC, events and mortality, baseline TAC was strongly associated with CVD risk and all-cause mortality in unadjusted analyses. Importantly, no clinical guidelines stress such comprehensive risk assessment as is emulated by our adjustments. This finding underscores the importance of screening, careful management and close follow-up of modifiable risk factors in CAC=0 individuals, particularly when a high burden of TAC is present. Providers are expected to pay careful attention to risk factors in all patients, and thus our findings should not be considered per se a rationale for systematic TAC measurement. Nevertheless, given that such information can be obtained automatically, with no extra image-interpretation time or cost, careful clinician-patient discussion including thorough assessment of traditional risk factors should be triggered when the presence of TAC (especially TAC>100) is noted in this particular population. 31
Several factors may have limited our study. First, calcification in the aortic arch and in the abdominal aorta 32 were not considered, as MESA used chest CT imaging studies performed for CAC screening purposes to calculate TAC burden. This may have resulted in an underestimation of the prognostic value of aortic calcium in CAC=0 individuals. Nevertheless, one of the most appealing features of TAC for further risk assessment is indeed the fact that it can be measured from the same images used for CAC scoring, without further testing. Elucidating the prognostic value of a test involving additional radiation and cost represents a different research question, beyond the scope of our study.
Second, the lack of statistical significance in the associations between TAC, CVD events and all-cause mortality may have been the consequence of a lack of statistical power, particularly in the TAC>100 subgroup. Nonetheless, our results were observed in a large, multi-ethnic, US population including 4 racial/ethnic groups and followed for more than ten years. Whether TAC may be more informative in specific subgroups at higher risk of cerebrovascular event rates such as post-menopausal women, African-American individuals or Asian populations, is a relevant topic deserving further investigation.
Finally, the finding of a significant interaction between baseline TAC and age for TIA should be put in the context of multiple testing, be interpreted with caution, and only considered hypothesis-generating.
In conclusion, in a multi-ethnic, modern US population, asymptomatic individuals with CAC=0 had very low 11-year CHD and CVD event rates and all-cause mortality. In this population, TAC did not independently improve estimation of prognosis beyond the CVD risk factors included in the latest CVD risk estimators available. Larger studies in populations at higher risk of stroke may provide further insights on the prognostic value of TAC in CVD risk prediction.
Fig. 2. Kaplan-Meier survival curves for CVD events (all) by TAC groups.
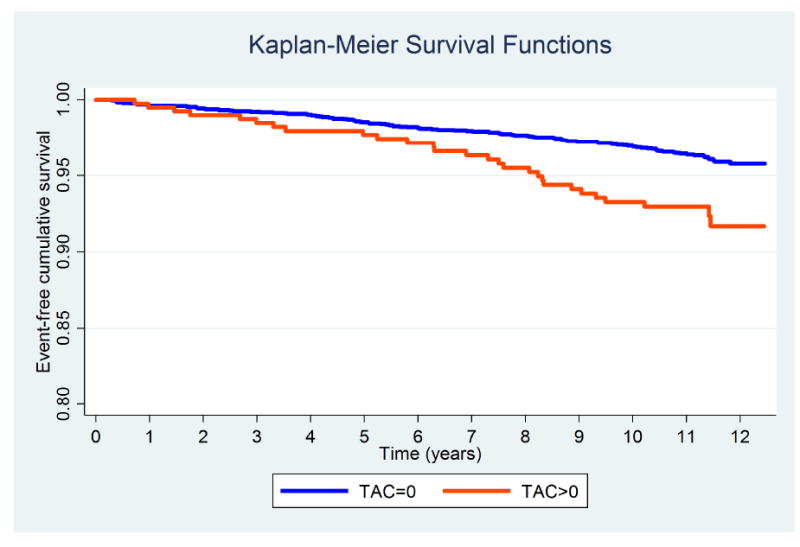
Log-Rank test p value < 0.001.
Highlights.
Asymptomatic individuals with coronary artery calcium (CAC)=0 had very low coronary heart disease (CHD), cardiovascular disease (CVD) event rates and all-cause mortality after a median follow-up of 11 years.
The prevalence of thoracic aortic calcium (TAC)>0 was low among asymptomatic individuals with no CAC.
The presence of TAC did not improve 10-year estimation of prognosis beyond traditional risk factors in this low-risk population.
Acknowledgments
The authors thank the other investigators, the staff, and the participants of the MESA study for their valuable contributions. A full list of participating MESA investigators and institutions can be found at http://www.mesa-nhlbi.org.
Financial support
This research was supported by R01 HL071739 and contracts N01-HC-95159, N01- HC-95160, N01-HC-95161, N01-HC-95162, N01-HC-95163, N01- HC-95164, N01-HC-95165 and N01 HC 95169 from the National Heart, Lung, and Blood Institute.
Abbreviations
- ACC/AHA
American College of Cardiology/American Heart Association
- CAC
coronary artery calcium
- CHD
coronary heart disease
- CT
computed tomography
- CVD
cardiovascular disease
- MESA
Multi-Ethnic Study of Atherosclerosis
- TAC
thoracic aortic calcium
- TIA
transient ischemic attack
Footnotes
Conflicts of interest:
The authors declared they do not have anything to disclose regarding conflict of interest with respect to this manuscript.
Author contributions
Joonseok Kim, Michael J. Blaha and Miguel Cainzos-Achirica contributed to the literature search, study design, data analysis, data interpretation and writing and editing of the manuscript. Zeina Dardari contributed to the statistical analyses. Matthew J. Budoff, Khurram Nasir, Nathan D. Wong, Joseph Yeboah, Mouaz H. Al-Mallah, Steve Shea and Roger S. Blumenthal contributed to the study design, data interpretation, and editing of the manuscript.
Publisher's Disclaimer: This is a PDF file of an unedited manuscript that has been accepted for publication. As a service to our customers we are providing this early version of the manuscript. The manuscript will undergo copyediting, typesetting, and review of the resulting proof before it is published in its final citable form. Please note that during the production process errors may be discovered which could affect the content, and all legal disclaimers that apply to the journal pertain.
References
- 1.Rumberger JA, Simons DB, Fitzpatrick LA, Sheedy PF, Schwartz RS. Coronary artery calcium area by electron-beam computed tomography and coronary atherosclerotic plaque area. A histopathologic correlative study. Circulation. 1995;92:2157–2162. doi: 10.1161/01.cir.92.8.2157. [DOI] [PubMed] [Google Scholar]
- 2.Guerci AD, Spadaro LA, Popma JJ, Goodman KJ, Brundage BH, Budoff M, Lerner G, Vizza RF. Relation of coronary calcium score by electron beam computed tomography to arteriographic findings in asymptomatic and symptomatic adults. Am J Cardiol. 1997;79:128–133. doi: 10.1016/s0002-9149(96)00698-4. [DOI] [PubMed] [Google Scholar]
- 3.Detrano R, Guerci AD, Carr JJ, Bild DE, Burke G, Folsom AR, Liu K, Shea S, Szklo M, Bluemke DA, O’Leary DH, Tracy R, Watson K, Wong ND, Kronmal RA. Coronary calcium as a predictor of coronary events in four racial or ethnic groups. N Engl J Med. 2008;358:1336–1345. doi: 10.1056/NEJMoa072100. [DOI] [PubMed] [Google Scholar]
- 4.Gibson AO, Blaha MJ, Arnan MK, Sacco RL, Szklo M, Herrington DM, Yeboah J. Coronary artery calcium and incident cerebrovascular events in an asymptomatic cohort. The MESA Study. JACC Cardiovasc Imaging. 2014;7:1108–1115. doi: 10.1016/j.jcmg.2014.07.009. [DOI] [PMC free article] [PubMed] [Google Scholar]
- 5.Martin SS, Blaha MJ, Blankstein R, Agatston A, Rivera JJ, Virani SS, Ouyang P, Jones SR, Blumenthal RS, Budoff MJ, Nasir K. Dyslipidemia, coronary artery calcium, and incident atherosclerotic cardiovascular disease: implications for statin therapy from the multi-ethnic study of atherosclerosis. Circulation. 2014;129:77–86. doi: 10.1161/CIRCULATIONAHA.113.003625. [DOI] [PMC free article] [PubMed] [Google Scholar]
- 6.Tota-Maharaj R, Blaha MJ, McEvoy JW, Blumenthal RS, Muse ED, Budoff MJ, Shaw LJ, Berman DS, Rana JS, Rumberger J, Callister T, Rivera J, Agatston A, Nasir K. Coronary artery calcium for the prediction of mortality in young adults <45 years old and elderly adults >75 years old. Eur Heart J. 2012;33:2955–2962. doi: 10.1093/eurheartj/ehs230. [DOI] [PubMed] [Google Scholar]
- 7.Sarwar A, Shaw LJ, Shapiro MD, Blankstein R, Hoffmann U, Cury RC, Abbara S, Brady TJ, Budoff MJ, Blumenthal RS, Nasir K. Diagnostic and prognostic value of absence of coronary artery calcification. JACC Cardiovasc Imaging. 2009;2:675–688. doi: 10.1016/j.jcmg.2008.12.031. [DOI] [PubMed] [Google Scholar]
- 8.Blaha M, Budoff MJ, Shaw LJ, Khosa F, Rumberger JA, Berman D, Callister T, Raggi P, Blumenthal RS, Nasir K. Absence of coronary artery calcification and all-cause mortality. JACC Cardiovasc Imaging. 2009;2:692–700. doi: 10.1016/j.jcmg.2009.03.009. [DOI] [PubMed] [Google Scholar]
- 9.Budoff MJ, Nasir K, Katz R, Takasu J, Carr JJ, Wong ND, Allison M, Lima JA, Detrano R, Blumenthal RS, Kronmal R. Thoracic aortic calcification and coronary heart disease events: the multi-ethnic study of atherosclerosis (MESA) Atherosclerosis. 2011;215:196–202. doi: 10.1016/j.atherosclerosis.2010.11.017. [DOI] [PMC free article] [PubMed] [Google Scholar]
- 10.Hermann DM, Lehmann N, Gronewold J, Bauer M, Mahabadi AA, Weimar C, Berger K, Moebus S, Jockel KH, Erbel R, Kalsch H. Thoracic aortic calcification is associated with incident stroke in the general population in addition to established risk factors. Eur Heart J Cardiovasc Imaging. 2014 doi: 10.1093/ehjci/jeu293. [DOI] [PubMed] [Google Scholar]
- 11.Jacobs PC, Prokop M, van der Graaf Y, Gondrie MJ, Janssen KJ, de Koning HJ, Isgum I, van Klaveren RJ, Oudkerk M, van Ginneken B, Mali WP. Comparing coronary artery calcium and thoracic aorta calcium for prediction of all-cause mortality and cardiovascular events on low-dose non-gated computed tomography in a high-risk population of heavy smokers. Atherosclerosis. 2010;209:455–462. doi: 10.1016/j.atherosclerosis.2009.09.031. [DOI] [PubMed] [Google Scholar]
- 12.Santos RD, Rumberger JA, Budoff MJ, Shaw LJ, Orakzai SH, Berman D, Raggi P, Blumenthal RS, Nasir K. Thoracic aorta calcification detected by electron beam tomography predicts all-cause mortality. Atherosclerosis. 2010;209:131–135. doi: 10.1016/j.atherosclerosis.2009.08.025. [DOI] [PubMed] [Google Scholar]
- 13.Zhou RH, Vendrov AE, Tchivilev I, Niu XL, Molnar KC, Rojas M, Carter JD, Tong H, Stouffer GA, Madamanchi NR, Runge MS. Mitochondrial oxidative stress in aortic stiffening with age: the role of smooth muscle cell function. Arterioscler Thromb Vasc Biol. 2012;32:745–755. doi: 10.1161/ATVBAHA.111.243121. [DOI] [PMC free article] [PubMed] [Google Scholar]
- 14.Post W, Bielak LF, Ryan KA, Cheng YC, Shen H, Rumberger JA, Sheedy PF, Shuldiner AR, Peyser PA, Mitchell BD. Determinants of coronary artery and aortic calcification in the Old Order Amish. Circulation. 2007;115:717–724. doi: 10.1161/CIRCULATIONAHA.106.637512. [DOI] [PMC free article] [PubMed] [Google Scholar]
- 15.Cavalcante JL, Lima JA, Redheuil A, Al-Mallah MH. Aortic stiffness: current understanding and future directions. J Am Coll Cardiol. 2011;57:1511–1522. doi: 10.1016/j.jacc.2010.12.017. [DOI] [PubMed] [Google Scholar]
- 16.Wong ND, Gransar H, Shaw L, Polk D, Moon JH, Miranda-Peats R, Hayes SW, Thomson LE, Rozanski A, Friedman JD, Berman DS. Thoracic aortic calcium versus coronary artery calcium for the prediction of coronary heart disease and cardiovascular disease events. JACC Cardiovasc Imaging. 2009;2:319–326. doi: 10.1016/j.jcmg.2008.12.010. [DOI] [PubMed] [Google Scholar]
- 17.Bild DE, Bluemke DA, Burke GL, Detrano R, Diez Roux AV, Folsom AR, Greenland P, Jacob DRJ, Kronmal R, Liu K, Nelson JC, O’Leary D, Saad MF, Shea S, Szklo M, Tracy RP. Multi-ethnic study of atherosclerosis: objectives and design. Am J Epidemiol. 2002;156:871–881. doi: 10.1093/aje/kwf113. [DOI] [PubMed] [Google Scholar]
- 18.Carr JJ, Nelson JC, Wong ND, McNitt-Gray M, Arad Y, Jacobs DR, Sidney S, Bild DE, Williams OD, Detrano RC. Calcified coronary artery plaque measurement with cardiac CT in population-based studies: standardized protocol of Multi-Ethnic Study of Atherosclerosis (MESA) and Coronary Artery Risk Development in Young Adults (CARDIA) study. Radiology. 2005;234:35–43. doi: 10.1148/radiol.2341040439. [DOI] [PubMed] [Google Scholar]
- 19.Breen JF, Sheedy PF, Schwartz RS, Stanson AW, Kaufmann RB, Moll PP, Rumberger JA. Coronary artery calcification detected with ultrafast CT as an indication of coronary artery disease. Radiology. 1992;185:435–439. doi: 10.1148/radiology.185.2.1410350. [DOI] [PubMed] [Google Scholar]
- 20.Carr JJ, Crouse JR, Goff DC, D’Agostino RB, Peterson NP, Burke GL. Evaluation of subsecond gated helical CT for quantification of coronary artery calcium and comparison with electron beam CT. AJR Am J Roentgenol. 2000;174:915–921. doi: 10.2214/ajr.174.4.1740915. [DOI] [PubMed] [Google Scholar]
- 21.Agatston AS, Janowitz WR, Hildner FJ, Zusmer NR, Viamonte MJ, Detrano R. Quantification of coronary artery calcium using ultrafast computed tomography. J Am Coll Cardiol. 1990;15:827–832. doi: 10.1016/0735-1097(90)90282-t. [DOI] [PubMed] [Google Scholar]
- 22.Levey AS, Stevens LA, Schmid CH, Zhang YL, Castro AF, Feldman HI, Kusek JW, Eggers P, Van Lente F, Greene T, Coresh J CKD-EPI CKDEC. A new equation to estimate glomerular filtration rate. Ann Intern Med. 2009;150:604–612. doi: 10.7326/0003-4819-150-9-200905050-00006. [DOI] [PMC free article] [PubMed] [Google Scholar]
- 23.Blaha MJ, Blumenthal RS, Budoff MJ, Nasir K. Understanding the utility of zero coronary calcium as a prognostic test: a Bayesian approach. Circ Cardiovasc Qual Outcomes. 2011;4:253–256. doi: 10.1161/CIRCOUTCOMES.110.958496. [DOI] [PubMed] [Google Scholar]
- 24.Eisen A, Tenenbaum A, Koren-Morag N, Tanne D, Shemesh J, Imazio M, Fisman EZ, Motro M, Schwammenthal E, Adler Y. Calcification of the thoracic aorta as detected by spiral computed tomography among stable angina pectoris patients: association with cardiovascular events and death. Circulation. 2008;118:1328–1334. doi: 10.1161/CIRCULATIONAHA.107.712141. [DOI] [PubMed] [Google Scholar]
- 25.Budoff MJ, Hokanson JE, Nasir K, Shaw LJ, Kinney GL, Chow D, Demoss D, Nuguri V, Nabavi V, Ratakonda R, Berman DS, Raggi P. Progression of coronary artery calcium predicts all-cause mortality. JACC Cardiovasc Imaging. 2010;3:1229–1236. doi: 10.1016/j.jcmg.2010.08.018. [DOI] [PubMed] [Google Scholar]
- 26.Stone NJ, Robinson JG, Lichtenstein AH, Bairey Merz CN, Blum CB, Eckel RH, Goldberg AC, Gordon D, Levy D, Lloyd-Jones DM, McBride P, Schwartz JS, Shero ST, Smith SC, Watson K, Wilson PW American COCHATFOPG. 2013 ACC/AHA guideline on the treatment of blood cholesterol to reduce atherosclerotic cardiovascular risk in adults: a report of the American College of Cardiology/American Heart Association Task Force on Practice Guidelines. J Am Coll Cardiol. 2014;63:2889–2934. doi: 10.1016/j.jacc.2013.11.002. [DOI] [PubMed] [Google Scholar]
- 27.Davila-Roman VG, Barzilai B, Wareing TH, Murphy SF, Schechtman KB, Kouchoukos NT. Atherosclerosis of the ascending aorta. Prevalence and role as an independent predictor of cerebrovascular events in cardiac patients. Stroke. 1994;25:2010–2016. doi: 10.1161/01.str.25.10.2010. [DOI] [PubMed] [Google Scholar]
- 28.The French Study of Aortic Plaques in Stroke Group. Atherosclerotic disease of the aortic arch as a risk factor for recurrent ischemic stroke. N Engl J Med. 1996;334:1216–1221. doi: 10.1056/NEJM199605093341902. [DOI] [PubMed] [Google Scholar]
- 29.Iribarren C, Sidney S, Sternfeld B, Browner WS. Calcification of the aortic arch: risk factors and association with coronary heart disease, stroke, and peripheral vascular disease. JAMA. 2000;283:2810–2815. doi: 10.1001/jama.283.21.2810. [DOI] [PubMed] [Google Scholar]
- 30.Amarenco P, Duyckaerts C, Tzourio C, Henin D, Bousser MG, Hauw JJ. The prevalence of ulcerated plaques in the aortic arch in patients with stroke. N Engl J Med. 1992;326:221–225. doi: 10.1056/NEJM199201233260402. [DOI] [PubMed] [Google Scholar]
- 31.Martin SS, Sperling LS, Blaha MJ, Wilson PW, Gluckman TJ, Blumenthal RS, Stone NJ. Clinician-patient risk discussion for atherosclerotic cardiovascular disease prevention: importance to implementation of the 2013 ACC/AHA Guidelines. J Am Coll Cardiol. 2015;65:1361–1368. doi: 10.1016/j.jacc.2015.01.043. [DOI] [PMC free article] [PubMed] [Google Scholar]
- 32.Criqui MH, Denenberg JO, McClelland RL, Allison MA, Ix JH, Guerci A, Cohoon KP, Srikanthan P, Watson KE, Wong ND. Abdominal aortic calcium, coronary artery calcium, and cardiovascular morbidity and mortality in the Multi-Ethnic Study of Atherosclerosis. Arterioscler Thromb Vasc Biol. 2014;34:1574–1579. doi: 10.1161/ATVBAHA.114.303268. [DOI] [PMC free article] [PubMed] [Google Scholar]