Abstract
We report here, the design and development of a disposable immunoassay chip for protein biomarker detection within ∼1 h. The unique design allows for real-time dynamic calibration of immunoassay for multiple biomarker detections on the chip. The limit of detection achieved for this test chip is 10 pg/ml for IL6, and 50 pg/ml for GFAP with a detection time of 1 h. The prototype instrument used for flowing the reagents through the chip can be easily assembled from off-the-shelf components with the final chemiluminescent detection carried out in a commercial plate reader. Optimization of different aspects of chip design, fabrication, and assay development is discussed in detail.
I. INTRODUCTION
Enzyme-linked immunosorbent assay (ELISA) has remained a commonly used diagnostic tool since its first introduction over half a century ago.1 It has great sensitivity and specificity with proper antibody optimization. The most commonly used platform is a microplate-based system (96, 384, and 1536 well). Standard multi-step manual operations remain as the major assay procedures for an ELISA test, usually requiring a well-trained technician and 4–6 h time.2 Automation of ELISA steps has been the main target for many companies manufacturing plate readers, like Bio-Tek, Molecular Devices, Agilent and others. Their approach is to develop many automation instruments (plate loader, plate washer, and others) to pair with a plate reader to automate some of these assay procedures. However, this pseudo-automation process only mitigates the load at a big lab environment such as a test center since it requires multiple expensive and bulky bench-top or floor-stand units. Instead, advances in microfluidic technologies have led to the commercialization of many new portable immunoassay systems for point-of-care applications (Samsung Labgeo, Philips Minicare, Micropoint Mlabs, Perlong Medical FIA8200, Abbott Point-of-Care i-STAT, and others.). These commercially available systems are simple to use, but they are either expensive to maintain, or use exotic techniques that lack versatility. An improved ELISA assay platform that keeps the versatility of traditional plate-based platform, while introducing other advantages like automation, fast detection, and lower sample requirement, would be very helpful for research and commercial applications.
There are many reported ELISA applications with microfluidic technologies (oral,3 cardiovascular,4 pathogen,5,6 cancer,7–9 diabetes10). The microfluidic system is ideal for ELISA assay automation because of many advantages: easy automation, minimized sample requirement, improved kinetics due to the large surface area to volume ratio, rapid assay procedure, and small size for portable/handheld applications.3,4,11–14
Proteomic analysis is very important in modern clinical diagnostics,15 especially for cancer,16 cardiovascular diseases,17,18 renal diseases,19,20 brain diseases,21 and others. Immunoassays remain to be the most sensitive, specific, and selective technology to study the protein biomarkers.22 During the biomarker assay development and initial clinical validation stage, an automation tool that can perform an assay evaluation in a fast and cost effective way is very attractive for biomarker research groups. Low cost, fast detection, and flexibility of measuring different biomarkers are the main targets for this development. Our approach is to adopt the traditional ELISA methods with a novel designed condensed microfluidic spiral feature. This feature is straightforward, simple in concept, and easy to modify for different applications. Various protein biomarkers are assessed, especially those related to traumatic brain injury (Glial fibrillary acidic protein (GFAP), UCH-L1, s100β, IL6, BDNF, and b-FABP).
II. MATERIALS AND METHODS
A. Materials
96 well Maxisorp Nunc plates and ultra clear plate sealer (Cat#60941-078) are purchased from VWR (Radnor, PA). Black and white acrylic (PMMA), Polycarbonate (PC), Polystyrene (PS) sheets with various thicknesses that are from McMaster (Elmhurst, IL). GFAP assay development reagents are from Banyan Biomarkers (Alachua, FL). IL6 ELISA development kit (3460-1H-20) is from Mabtech (Cincinnati, OH). Startingblock with T20 (37543) and Supersignal Femto (37075) are from Thermo Scientific (Waltham, MA). Coating buffer (Cat# 421701) is from BioLegend (San Diego, CA) and washing solution 10× TBST (Cat# 786-161) is from Gbiosciences (St. Louis, MO). Normal human serum (S1-LITER) is from EMD Millipore (Billerica, MA). Plate reader Synergy H4 is from Bio-tek (Winooski, VT). Laser cut Epilog Mini 24 from Epilog (Golden, CO) is used to fabricate the assay chip prototypes in house. OEM parts like valves (MLP777-605, MLP778-605) are from IDEX (Lake Forrest, IL) and syringe pump (PSD4) is from Hamilton (Reno, NV). All fluidic connectors are purchased from IDEX or made in house. The control board, disposable components are made in house.
B. Assay chip designs
Several important aspects of assay need to be considered while designing the microfluidic chip. In theory, the smaller the size of the microfluidic channels, the larger the surface-area-to-volume ratio and the smaller the sample/reagent requirement. This is advantageous not only to reduce the overall assay time,23 but also to minimize the cost of reagents. However, the effective channel size achieved in practice is limited by several factors including materials, fabrication capabilities, initial setup cost, and assay cost. The first question, therefore, is what material should be chosen for the chip. Due to the concerns of future mass production cost, glass is not chosen as the material candidate even though current clean-room technologies can produce very high-quality microfluidic chips.24 Instead, plastic is chosen for chip system development since the final design could eventually be mass-produced at low cost with injection molding technologies. However, the initial setup cost for injection molding is relatively high and as an alternative method, laser ablation is used for fast prototyping followed by hot embossing for performance validation before being scaled up to mass production. Laser cutter from Epilog is used to produce prototype chips. The best resolution for a Mini 24 system is 1200 dpi, (∼20 μm). On poly(methyl methacrylate) (PMMA) materials (one of the best performers with laser ablation), the quality of 200 μm wide channels produced is considered acceptable for an initial assessment (∼10% relative variations). Thus a channel of 200–300 μm (width/depth) is used for the chip development.
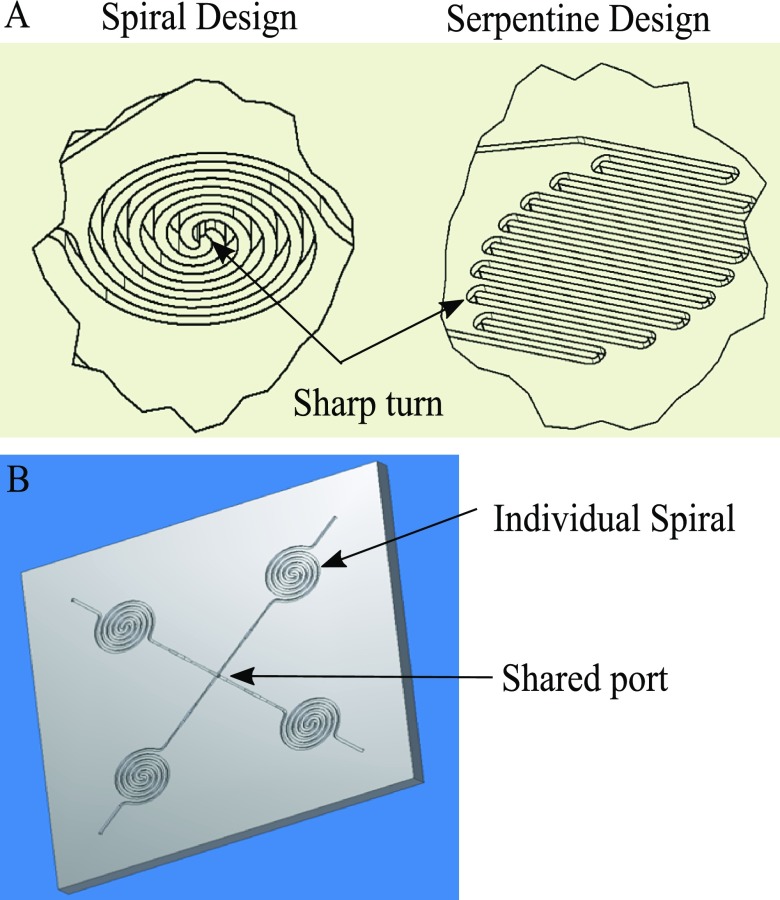
The second question is how to achieve dense packing of microfluidic channels on a single chip. This is mainly required to make the chip small in size and corresponding miniaturization of optical and fluid delivery system. The main fluidic channels are routed as closely spaced as possible. The two simplest designs are spiral and serpentine designs as seen in Figure 1. The channel to channel distance is not only limited by fabrication capabilities (i.e., the resolution of Epilog laser machine) as described earlier, but also by the subsequent chip sealing process. The fabricated microfluidic features require a sealing layer to form microfluidic channels that can hold and transport fluids without leaking out or letting air in. A cost-efficient way of sealing is to use the commercially available adhesive plate sealers. One way to reduce the sealing strength requirement is to reduce the operating pressure when pumping solutions. This can be achieved by pulling fluid inside the chip rather than pushing. We could achieve a satisfactory sealing with a minimum of 200 μm × 200 μm sealing area between the channels. Both spiral and serpentine designs have a similar surface area to volume ratio. However, the spiral design has only two sharp turns in the flow path while the serpentine design has multiple small radius turns. Since sharp turns are more likely to trap bubbles/debris, as well as the weakest spot for proper sealing (due to less sealing area around the turn), spiral design is preferred.
FIG. 1.
(a) Two flow-through designs for condensed microfluidic features. (b) Simple concept of combination of spiral features on chip.
The third question is to define how many integrated spirals are to be used in a chip. This is dictated by ELISA considerations. The quantitative ELISA assay often requires using a real-time generated calibration curve to ensure measurement accuracy. Such a real-time calibration strategy could address many factors that affect the assay kinetics such as reagent stability, temperature, concentration changes, etc. Most ELISA assays have an optimized dynamic range that falls within a linear region of the calibration curve (normally sigmoidal shape). To generate a reasonably linear calibration curve for each test, a minimum of three standard points are needed. Considering that at least one more test is required for the unknown sample(s), the simplest chip design will require at least four spiral features (as shown in Figure 1) to allow for real-time calibration.
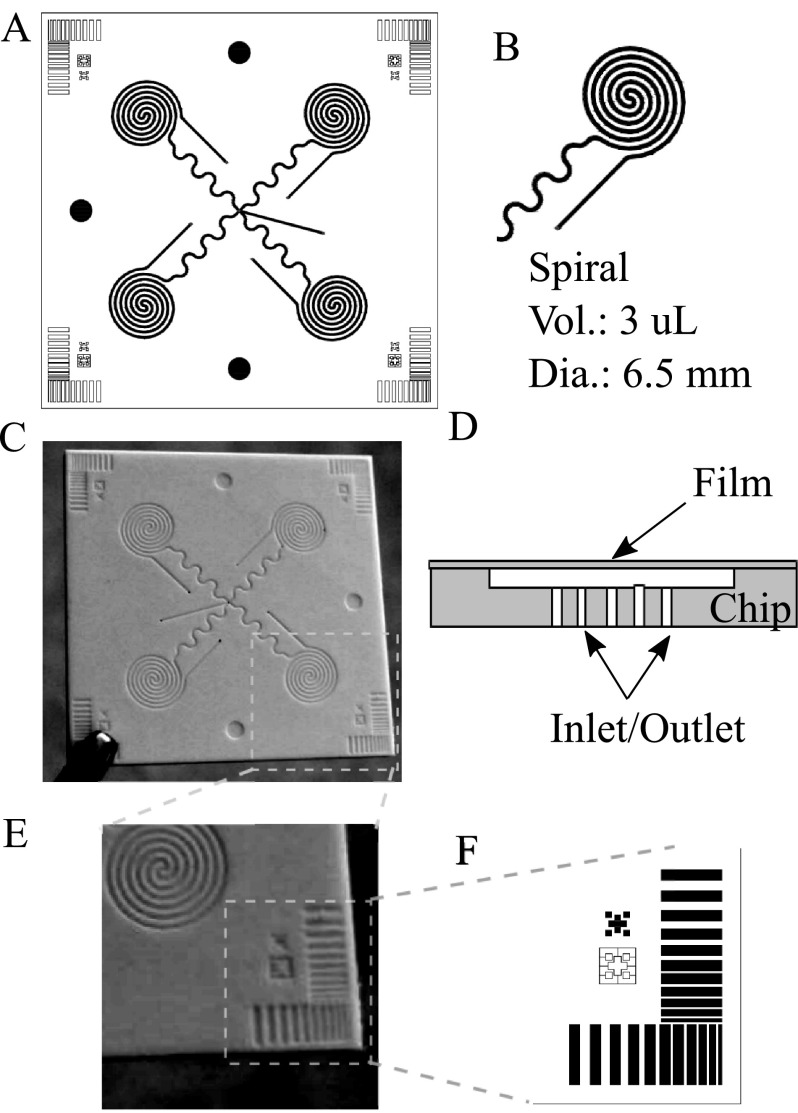
The fourth question is how to achieve automated assay protocol with the chip. As seen from Figure 2(a), the four spirals will require 4 inlets and 4 outlets for multiple reagents to flow through. It will require multiple valves on the inlet side to address individual spirals and can make the system cumbersome. Instead, all the inlets are combined together at the center of the chip. The outlets are controlled with a single rotary valve connected to a single pull pump as seen from Figure 4 (discussed later). In this method, a single pump can be used in withdrawal mode for the flow of the reagents through all the spirals. Furthermore, a lower than ambient pressure created inside the channel due to pump operating in pull mode will help in keeping the adhesive film cover intact without any leakage.
FIG. 2.
(a) 4 spiral chip design (1.5″ × 1.5″) featuring a single inlet multiple outlet. (b) Individual spiral design. (c) Hot embossed white PS chip. (d) Chip cross section showing film cover and inlet/outlet ports at the bottom. (e) and (f) Process monitoring and chip alignment features.
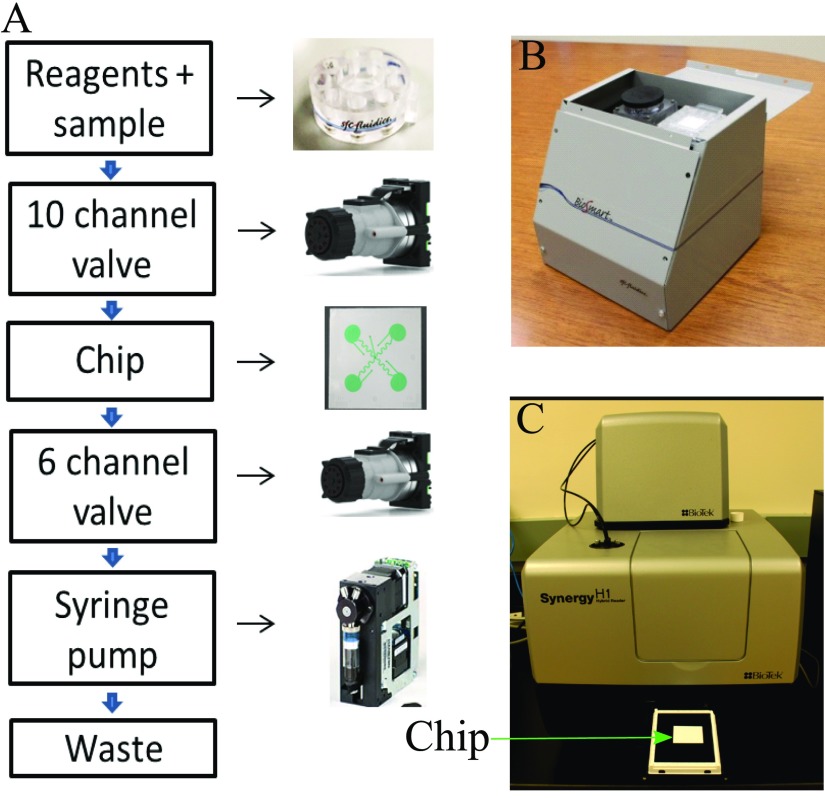
FIG. 4.
(a) Schematic of automated assay on-chip using off-the-shelf components. (b) Prototype system without an optical detector. (c) Commercially available system (BioTek, Synergy H1) used for chemiluminescence detection.
The chips are designed to fit a plate reader for final signal measurement. In this case, all the spirals are located at positions corresponding to wells of a 96 well plate (Figure 2(a)). The outer diameter of the spirals is comparable to a microwell (∼6.5 mm) so that the ELISA signals from the spiral sites could be measured using a commercial ELISA reader. A plate reader adapter is used to fix the chip in a specified position for reading. Either fluorescence or chemiluminescence measurements could be used in the epi-mode.
C. Chip fabrication
The initial chip fabrication method used for rapid prototyping was laser ablation. The CAD drawings are imported to Epilog software for direct processing. The channel ablation protocol used a raster mode with 25% power at a speed of 50% for two passes to fabricate each channel. The holes and outer sides are cut out with vector mode at 100% power and 50% speed. Among all the materials tested (Polycarbonate (PC), Cyclic Olefin Copolymer (COC), PS, PMMA), PMMA is the only material that could produce usable chips with the laser cutter.
Laser ablation saves time and cost for proof-of-concept development, however, the channels fabricated tend to be low in quality due to the ablation process. Heating, ablative evaporation, sputtering, and redeposition of materials have contributed to the rough and uneven surface of the channel walls (data not shown). This affects the reliability of the assay development and final measurements. To further improve the chip fabrication process, laser-machined mastering and hot embossing are evaluated. The master mold is made from hard polyimide plastic. There are more material options available for hot embossing including PMMA, PS, PC, and COC. The final dimensions of the spirals are 200 μm of channel width and 500 μm channel to channel distance with 300 μm sealing width. The depth of the channel is 150 μm. The PS chips are tested for several parameters that are critical for proper operation such as channel depth, channel width, wall flatness, and overall chip flatness. Channel width is measured by a microscope examination whereas a Dektak profilometer is used to measure the channel depth more accurately. To relieve the burden of quality control, certain quality monitoring features are implemented in the chip design (Figure 2(e)), as well as the features for packaging alignment (Figure 2(f)). Different sizes of small rectangular shapes located at four corners of the chip would tell the quality of both the depth and spacing of spirals on the chip. These corner features are easier to access with the profilometer tip than the tightly spaced spiral assay sites.
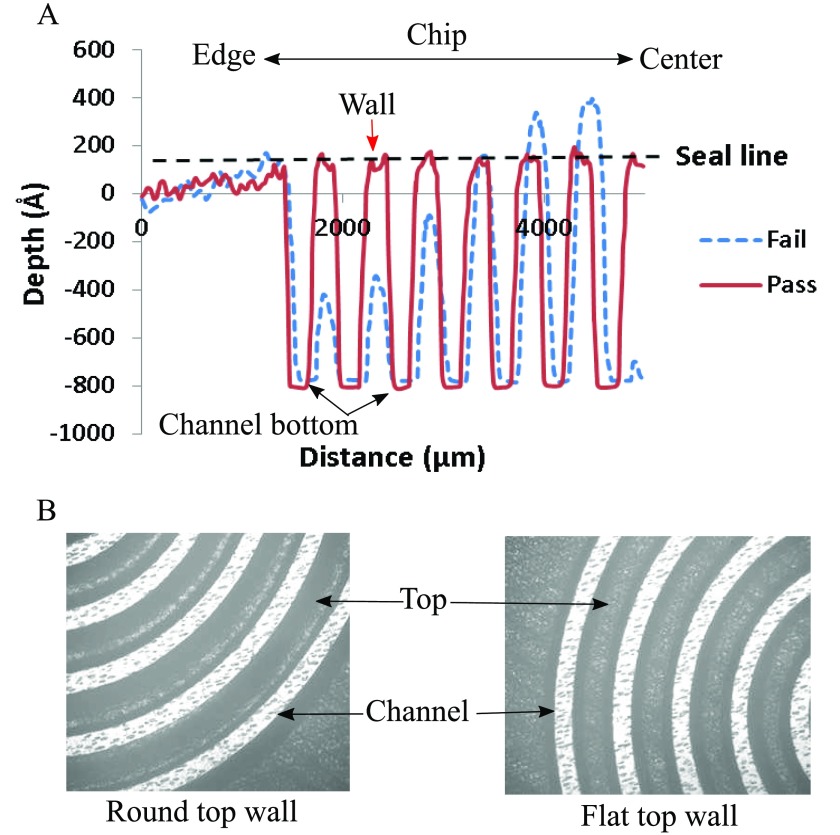
Two parameters are critical to ensure proper sealing, the top of the walls between the channels need to be flat to provide a good sealing surface, and all the walls need to be at the same height. Walls with flat tops are extremely important to ensure a good seal with the plate sealer. Walls with rounded tops do not present enough surface area for the plate sealer to adhere to. When liquid is introduced into the channel, it can cross between channels by flowing between the wall and the sealer. This short-circuits the channel length, resulting in a poor performance. In addition to rounded tops, another parameter that is measured is the height of the walls between the channels. It is possible that the embossing process can produce channels of proper depth without forming walls of the correct height. A profilometry scan (Figure 3(a)) shows the difference between well-formed channel wall and a defective one. Even a slight reduction in wall height can lead to poor bonding with the adhesive layer and will result in leakage. Corresponding microscope images of failed and passed chip are shown in Figure 3(b). Considering that the sealer has a 50 μm adhesive layer, a channel wall will fail to effectively adhere to the sealer, if the height is lower than ∼25 μm. Among the 30% of chips that failed, about 80% are due to failure to achieve properly formed spiral walls. We suspect a tight spacing of features in the spiral area during the embossing process impeded material flow with some material trapped in the spiral area. Additionally, the separation of mold afterward likely exerts much greater forces on these tightly spaced features and leads to distorted channel walls. Combined, these two effects are likely the main reason for failure.
FIG. 3.
(a) Profilometry scan of chip showing a proper depth for the channel, but not the proper height of the wall for failed chip. (b) Microscope pictures show the chip with round top wall and flat top wall.
Colors of materials are also important for the assay performance. For fluorescence detection, a chip with black and matte finish is the best to reduce the light reflection, thus reducing the background signal. For chemiluminescence detection, a chip with white finish is the best to increase the overall detectable signals from light reflection. Current embossed chips are white polystyrene with a thickness of 1.3–1.5 mm for chemiluminescence detection (Figure 2(c)).
D. Automated reagent delivery
To automate the assay process with the chip, a simple prototype system is assembled for protein detection (Figure 4(b)). The overall size of the prototype is about 8″ × 8″ × 8″. This prototype system is composed of two valves for reagent and spiral selection, one syringe pump for pulling solutions and a flow sensor for flow monitoring. All components are controlled by an in-house developed control board with a USB connection to a laptop computer. The reagent cartridge is designed to hold up to ten reagents to accommodate the washing buffer, sample, and standard solutions, a secondary antibody solution, enzyme solution, and a substrate solution. Blocking buffer and stopping solution are optional for assay improvement.
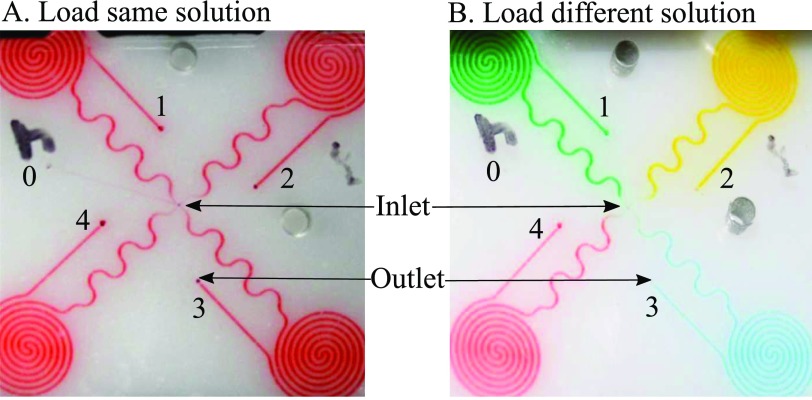
Figure 4(a) arrows show the directions of flow of all reagents through all components during an assay test. All flow controls with valves and pump are straightforward except the programmed loading on the chip. Simple fluidic loading strategies are used to deliver the same and different reagents to all the spiral sites (demonstrated with food dye solution loading in Figure 5). In details, to load the same reagent to all spirals (Figure 5(a)), the solution would first flow through a common channel 0 for the priming purpose. Then the solution is drawn through four spirals (1–4) one by one. In the end, to prevent potential contaminations to the common paths, common channel 0 is filled with a washing buffer again. Figure 5(a) shows the result of loading red dye to four spirals. The long serpentine channels prevented the diffusion of washing buffer to the spirals during incubation. Loading different reagents to individual spirals is a little bit more complicated (Figure 5(b)). Each reagent has to be primed through the common channel before loading to a specified spiral. After one spiral loading, the common path would be washed with washing buffer before priming the next reagent for next spiral loading. After all, spirals are loaded, the common path needed to be filled again with washing buffer to minimize cross contaminations between reagents. Figure 5(b) shows the result of loading four different dyes through four spirals. These two strategies are used multiple times with the prototype system for reagent delivery and precise time control.
FIG. 5.
Loading of the same solution (a) and different solution (b) using food dye to illustrate the flow of multiple reagents through the chip.
E. Assay development and detection
With the spiral site design, both the assay reaction and detection happen at the same localized microfluidic channel comprising the assay site. In principle, any stepwise immunoassay can work well on the spiral assay chip. We mainly focused on sandwich ELISA for protein biomarker detection. The major difference between assay on chip and assay on commercial microwell plate is the functionalization of the surface, which includes antibody coating, blocking, and drying for storage. Commercial plates such as NUNC Maxisorp are optimized for ELISA application, while proper antibody coating methods have to be developed for chip-based microfluidic assays. Two methods based on the chemical modification and physical adsorption of primary antibodies could be used depending on the chip materials. For example, a chemical modification of PMMA surface can be used to covalently bind the primary antibodies, with a polyethyleneimine (PEI) activation procedure.25 For polystyrene chips, coating antibodies based on physical adsorption with a commercial ELISA coating buffer may be viable. Because there are more reagents and steps involved in the chemical modification of antibody on PMMA chip, the quality of antibody coating is expected to be less reliable than that of the one-step physisorption coating method on polystyrene chip.
The antibody coating of the spirals is done manually with a pipette to drive the coating solutions through every spiral. The internal volume of each spiral structure on the embossed chips is ∼3 μl. Instead of loading 8 μl primary antibody coating solution through the spiral and incubate once, loading 4 μl solution twice through the spiral with 5 min incubation between increased the amount of antibody coated and reduced the spiral site to site variations. Thereafter, the antibody coated chips are blocked with Startingblock solution and stored in refrigerated desiccators after solution removal. These chips remained functional even after six months of storage.
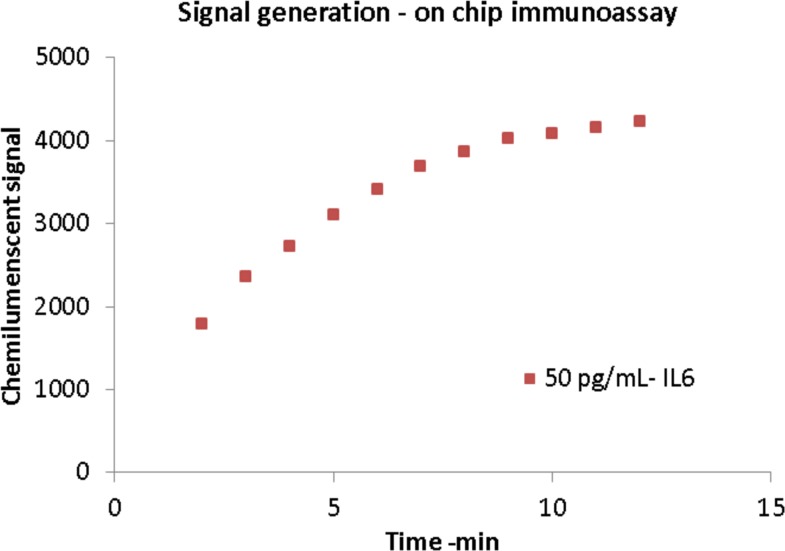
The assay procedure is very similar to a traditional 96 well plate assay, and its sequence of operation is shown in Table I. Samples and standard solutions are first to be loaded in individual spirals, followed by secondary antibodies/tertiary antibodies/enzyme solutions. The common channel is washed carefully before each reagent change using washing solution. The final step is to load the substrate and read the signals from individual spirals immediately with a plate reader. The spiral chip design confers the advantage of using an established assay format, but significantly cuts down the overall assay time and reagent requirement (1 h versus 4 h a few milliliters versus hundreds of microliters). Chemiluminescence is chosen as the final detection method for its simplicity and ultra-sensitive detection with ultralow background. However, this signal develops with time, and a fixed time delay needs to be properly set up for accurate measurement. Figure 6 shows the chemiluminescent signal generation on-chip (black lasercut PMMA) for 50 pg/ml IL6. As seen from the plot, the signal increases and plateaus out over time (∼10 min) and hence the optical measurement of the signal needed to be done sequentially and with a fixed time delay.
TABLE I.
Current protocol for IL6 assay with the immunoassay chip system. Time of each assay step is in bold.
| Parameters | |
|---|---|
| Flow rate | 30 μl/min |
| Primary Ab coating | 5 μg/ml 2 h |
| Sample time | 10 min |
| Secondary Antibody | 4 μg/ml for 10 min |
| Reporter | 0.5 μg/ml for 10 min |
| Washing | 25 min |
| Substrate | 6 min |
| Detection | 5 min |
| Total time | 66 min |
FIG. 6.
Generation of chemiluminescent signal after addition of substrate in on-chip assay protocol. The signal rises and fades after some time requiring quick detection.
III. RESULTS AND DISCUSSION
A. Spiked IL6 test with human serum
The validity of this microfluidic chip assay system is initially checked with spiked IL6 samples in human serum. Primary antibody coating used 5 μg/ml mouse anti-IL6 antibody in the coating buffer for 2 h. After removing the coating solution, the chips are blocked with Startingblock for 30 min. The final chips are stored dry in the refrigerator for the panel of experiments. To test a sample, prefilled reagent cartridge (including 4 μg/ml biotinylated secondary antibody, 0.5 μg/ml streptavidin-HRP, washing buffer, sample, calibrators, and stop solution) and a new chip are mounted in the prototype. Total assay time is 66 min including priming time. The final readout used a Bio-Tek H4 plate reader. A washing step with dummy chip and washing cartridge are performed between tests. Each assay condition is repeated multiple times to establish the reliability of the system.
We selected IL6 as the demonstration biomarker because it has well-developed commercially available assay reagents. The final sample concentration is achieved by a dynamic calibration process using 3 internal standards (Figure 7(b)). Real time calibration greatly reduced the variations introduced by changes of reagents and environment, especially for reagents used for more than 4 h during long term testing. 7 days of tests of 28 samples are summarized in the table of Figure 7(a). The results show a consistent performance between 6.25 pg/ml and 200 pg/ml concentration of IL6. The imprecision is less than 25% for most assay concentrations. The serum sample recovery is in the range of 89%–105% (10–150 pg/ml), similar to traditional ELISA assay.26 The variation is higher at 6.25 pg/ml, which is below the 10 pg/ml limit of detection (LOD). This also coincides with the LOD of the ELISA kit27 that is used in the traditional 96 well plate assay with 4–6 h assay time. Figure 7(c) shows multiple runs of different concentration of IL6 on the chip to evaluate the reliability of the overall system. Variability of detection is at ∼12% for 200 pg/ml, whereas it slightly increases to 15% at 50 pg/ml. For a detection range of 10–500 pg/ml, we found that an internal standard of 0, 50, and 200 pg/ml produces a good calibration curve against which the sample can be compared and its concentration analyzed.
FIG. 7.
(a) Spiked recovery test of 28 IL6 spiked in human serum samples. (b) Typical 3 PT built-in calibration and sample measurement. (c) Multiple runs for different concentrations of IL6 on-chip.
IL6 detection on-chip in its current sensitivity may be used as a prognostic marker in case of bacterial infection28 (cut off 145 pg/ml), severe sepsis28 (>75 pg/ml), and as a surrogate marker for Rheumatoid arthritis29 where relative concentration of IL6 is high. However, this system cannot be used for cancer-related studies, where the sensitivity requirement for baseline (∼5 pg/ml) is below the LOD of the chip.
To further improve the performance, it might need better calibrations, especially in low concentration range. Current chip design uses only three internal calibration points for each test. As a comparison, to achieve a better assay performance, traditional ELISAs (with the 96-well platform) generally use eight calibration concentrations in duplex. Since the calibration curve will not always be linear for the whole assay range, a 4-PL or 5-PL (PL = parameter logistic) curve fitting is often used. However, for current chip assay system, which uses the microfluidic ELISA targeted for fast, sensitive tests, it is not practical to do traditional calibrations. A quick test of a five spiral chip (instead of four) with spiked IL6 assay showed that a four-point calibration increased more than 10%, the accuracy at the low concentration level compared to a three-point calibration (data not shown). However, the volumes of most reagents have increased about 25%, and the overall assay time increased to 77 min. Thus it has to be balanced between performance and time/cost. Few other techniques to improve the sensitivity of the detection are, (a) increase the incubation time for the sample to allow for protein molecules to reach the surface of the channel, (b) reduce the dimension of microfluidic channel, which in turn will improve the assay kinetics, (c) improve the quality of chips with better manufacturing process for low variation between spirals to improve the dynamic calibration, and (d) multiple loading of the sample in the same spiral to bring in a fresh batch of protein for binding to the antibody on the surface of the channel. However, these techniques need to be properly optimized, and some nonlinear characteristics in terms of signal increase with multiple loading of the sample have been observed (data not shown).
B. Spiked GFAP test with human serum
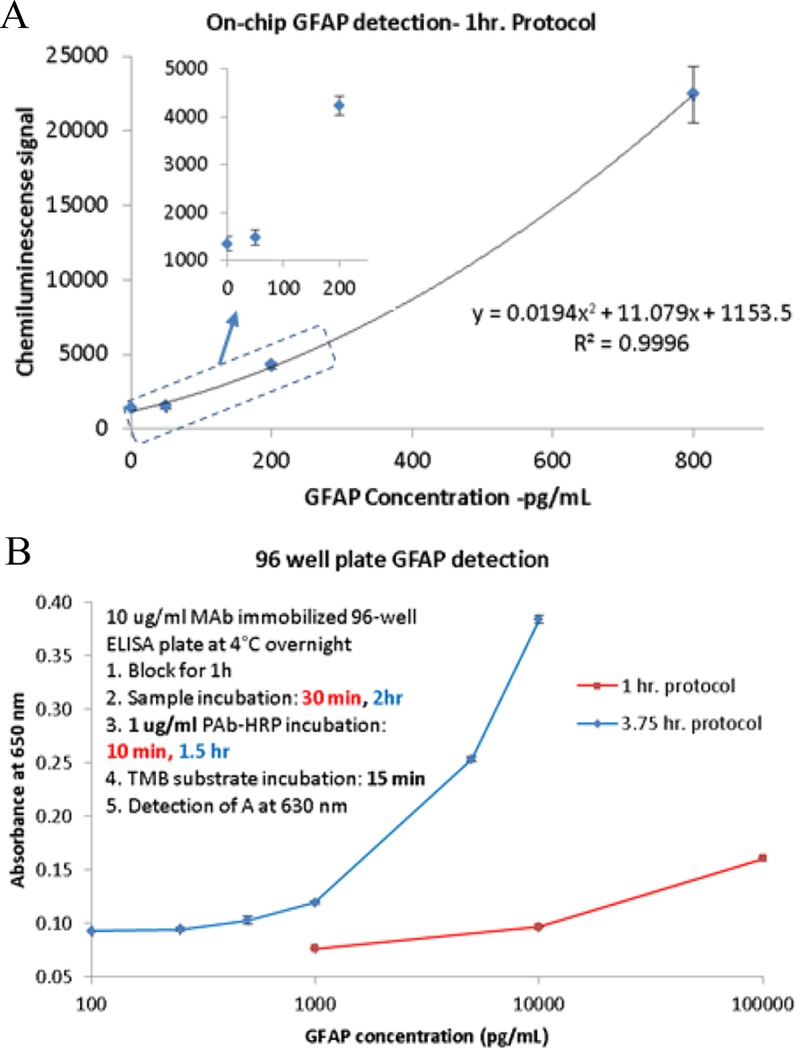
In clinical diagnostics field especially in the field of TBI, single biomarker results may be insufficient to draw a conclusion by the physicians. Besides IL6, a new protein biomarker GFAP is chosen as the second analyte after a successful assay development with the chip based system through a similar process as IL6 (data not shown). Assay protocol of GFAP is very similar to IL6 with 10 μg/mL coating primary antibody, 5 μg/ml biotinylated secondary antibody, and 1 μg/ml streptavidin-HRP solution. The total sample requirement is similar. Figure 8(a) shows the GFAP detection with 1-h protocol at a concentration range of 0–800 pg/ml. The inset zoomed-in plot shows that GFAP has a cutoff sensitivity at ∼50 pg/ml in spiked human serum, which is similar to the concentration of GFAP in healthy human serum30 (∼60 pg/ml). Severe traumatic brain injury can increase the blood GFAP level to few ng/ml (100% specificity above 6 ng/ml for prediction of the unfavorable condition in TBI30) and can easily be detected with the current system.
FIG. 8.
(a) On-chip detection of GFAP spiked in human serum in 1 h. LOD: ∼100 pg/ml. (b) A similar 1 h protocol using a 96 well plate (sandwich ELISA) yields LOD of 1000 pg/ml, whereas a 4 h protocol has LOD of 100 pg/ml.
For comparison to a gold standard assay, GFAP tests with traditional 96 well plate are checked with classical 3.75 h and 1-h protocol. Figure 8(b) shows the comparison between 3.75 h and 1-h protocol with spiked buffer samples (compared to spiked human serum for on-chip testing). 1-h protocol has LOD at ∼1 ng/ml in absorbance mode whereas, the sensitivity increased to 10 pg/ml for 3.75 h protocol. While the ELISA technique is similar to that used in the chip, the difference is in the final reporter molecule which is the TMB substrate (absorbance detection) compared to the chemiluminescent substrate. The microfluidic method is at least 10 times better at the detection limit mainly due to high surface to volume ratio and also chemiluminescence compared to the absorbance method of detection. A more sensitive substrate also requires better control on volume of reagents for lower variation. The spiral on the chip also acts as a fixed volume zone for the assay, whereas in a 96 well plate, dispense of particular liquid is dependent on the external system and can easily vary between 1% and 5% for low volume dispense31–33 (1–20 μl) which can give rise to variation in the final assay results.
This novel assay chip design is still under development, and the performance is not being fully optimized yet. The variability in detection is moderately high mainly due to variation in channel dimension, surface roughness (prototype chip), and less ideal sealing process. Both channel dimension variability and surface roughness can be improved by molding the chip and bonding techniques like ozone assisted welding process, micro ultrasonic welding, or laser assisted fusion process.34 Traditional ELISA is carried out in 96 well plates, which are highly optimized in terms of surface roughness, dimensional variation35 (∼5%), and optimized coating method. Even then the assay variability in those plates with the biological medium is ∼10%. Since our chip is not the optimized final product yet, a higher variation in test results is possible.
Several new and exotic protein detection methods are reported in literature36 in recent years. Some of these techniques have advantages in terms of high throughput operation,37 less detection time (∼10 min) with impressive detection limits38 based on AC electro-osmosis, or digital microfluidics39 (<10 pg/ml LOD, <1 h) and others.40 Most of these systems, however, are still in the early development stage (device fabrication issues for digital microfluidics chip, complicated surface chemistry, its stability and general compatibility with different biological medium, etc.) and it will still take significant effort and time to develop those technologies to a usable product. The main advantage of our system is that it is built on already developed and commercially available chemical and physical techniques like physisorption, high surface to volume and chemiluminescence. Simple automation technique combined with dynamic calibration method on-chip provides a very robust and stable alternative to conventional 96 well plate based assays with an added advantage of reduced assay time and less reagent requirement. Following are the main advantages in using the chip-based spiral microfluidics system for protein detection:
-
1.
Simple chip design can be fabricated by hot embossing (less-expensive) or molding (better chip quality and hence performance but expensive).
-
2.
The spiral channel contains only 3 μl of fluid, reducing the total sample requirement to ∼5 μl per test (excluding dead volume in fluidic line).
-
3.
Less reagent consumption compared to 96 well plate.
-
4.
Commercial plate reader can be used for detection.
-
5.
Dynamic calibration on each chip helps in reducing the effect of reagent stability and chip variability.
-
6.
Total time of operation: ∼1 h. LOD can be improved by increasing the incubation time.
-
7.
Simple instrumentation and significantly less handling requirement than traditional ELISA.
IV. CONCLUSION
A novel immunoassay chip has been designed, developed, and tested for detection of multiple proteomic biomarkers. It features multiple spiral microfluidic channels as both the reaction and detection sites, which not only accelerate the assay kinetics but also reduce the cost of reagents. Details about the chip designs are discussed including configurations, material selection, fabrication, packaging, and testing. Transfer of ELISA assays to the chip is simple because of the similarities between well-developed 96 well plate system and the assay chip system. Real time calibration in on-chip ensures accuracy. TBI biomarkers IL6 and GFAP have been tested on the chip, and the results are comparable to those from a 96 well plate but require only 1 h assay time and less than 60 μl of samples. Further development of this immunoassay chips include improvement of the manufacturing process, optimize adapted assay conditions, and develop a standalone instrument to automate all assay procedures. Such a diagnostic tool is currently under development targeting research and commercial applications.
ACKNOWLEDGMENTS
Work described in this paper is financially supported by the CDMRP Grant No. W81XWH-09-0523. The content is solely the responsibility of the authors and does not necessarily represent the official views of CDMRP.
The authors have no conflict of interest.
References
- 1. Lequin R. M., “ Enzyme immunoassay (EIA)/enzyme-linked immunosorbent assay (ELISA),” Clin. Chem. (12), 2415–2418 (2005). 10.1373/clinchem.2005.051532 [DOI] [PubMed] [Google Scholar]
- 2. Scientific T., ELISA Technical Guide and Protocols ( Rockford, 2010). [Google Scholar]
- 3. Herr A. E., Hatch A. V., Giannobile W. V., Throckmorton D. J., Tran H. M., Brennan J. S., and Singh A. K., “ Integrated microfluidic platform for oral diagnostics,” Ann. N.Y. Acad. Sci. , 362–374 (2007). 10.1196/annals.1384.004 [DOI] [PMC free article] [PubMed] [Google Scholar]
- 4. Mohammed M.-I. and Desmulliez M. P. Y., “ Lab-on-a-chip based immunosensor principles and technologies for the detection of cardiac biomarkers: a review,” Lab Chip (4), 569–595 (2011). 10.1039/C0LC00204F [DOI] [PubMed] [Google Scholar]
- 5. Golden J. P., Verbarg J., P. B. Howell, Jr. , Shriver-Lake L. C., and Ligler F. S., “ Automated processing integrated with a microflow cytometer for pathogen detection in clinical matrices,” Biosens. Bioelectron. (1), 10–16 (2013). 10.1016/j.bios.2012.08.015 [DOI] [PMC free article] [PubMed] [Google Scholar]
- 6. Thaitrong N., Charlermroj R., Himananto O., Seepiban C., and Karoonuthaisiri N., “ Implementation of microfluidic sandwich ELISA for superior detection of plant pathogens,” PLoS One (12), 1–9 (2013) 10.1371/journal.pone.0083231. [DOI] [PMC free article] [PubMed] [Google Scholar]
- 7. Ying L. and Wang Q., “ Microfluidic chip-based technologies: emerging platforms for cancer diagnosis,” BMC Biotechnol. , 76 (2013). 10.1186/1472-6750-13-76 [DOI] [PMC free article] [PubMed] [Google Scholar]
- 8. Barbosa A. I., Castanheira A. P., Edwards A. D., and Reis N. M., “ A lab-in-a-briefcase for rapid prostate specific antigen (PSA) screening from whole blood,” Lab Chip (16), 2918–2928 (2014). 10.1039/C4LC00464G [DOI] [PubMed] [Google Scholar]
- 9. Otieno B. A., Krause C. E., Latus A., Chikkaveeraiah B. V., Faria R. C., and Rusling J. F., “ On-line protein capture on magnetic beads for ultrasensitive microfluidic immunoassays of cancer biomarkers,” Biosens. Bioelectron. , 268–274 (2014). 10.1016/j.bios.2013.09.054 [DOI] [PMC free article] [PubMed] [Google Scholar]
- 10. Yao P., Liu Z., Tung S., Dong Z. L., and Liu L. Q., “ Fully automated quantification of insulin concentration using a microfluidic-based chemiluminescence immunoassay,” Jala (3), 387–393 (2016) 10.1177/2211068215578822. [DOI] [PubMed] [Google Scholar]
- 11. Yi H., Pan J.-Z., Shi X.-T., and Fang Q., “ Automated liquid operation method for microfluidic heterogeneous immunoassay,” Talanta , 52–56 (2013). 10.1016/j.talanta.2012.11.053 [DOI] [PubMed] [Google Scholar]
- 12. Han K. N., Li C. A., and Seong G. H., “ Microfluidic chips for immunoassays,” Annu. Rev. Anal. Chem. (Palo Alto Calif.) , 119–141 (2013). 10.1146/annurev-anchem-062012-092616 [DOI] [PubMed] [Google Scholar]
- 13. Lin C.-C., Wang J.-H., Wu H.-W., and Lee G.-B., “ Microfluidic immunoassays,” J. Assoc. Lab. Autom. (3), 253–274 (2010). 10.1016/j.jala.2010.01.013 [DOI] [Google Scholar]
- 14. Nahavandi S., Baratchi S., Soffe R., Tang S.-Y., Nahavandi S., Mitchell A., and Khoshmanesh K., “ Microfluidic platforms for biomarker analysis,” Lab Chip (9), 1496–1514 (2014). 10.1039/c3lc51124c [DOI] [PubMed] [Google Scholar]
- 15. Rifai N., Gillette M. A., and Carr S. A., “ Protein biomarker discovery and validation: The long and uncertain path to clinical utility,” Nat. Biotechnol. (8), 971–983 (2006). 10.1038/nbt1235 [DOI] [PubMed] [Google Scholar]
- 16. Pesch B., Brüning T., Johnen G., Casjens S., Bonberg N., Taeger D., Müller A., Weber D. G., and Behrens T., “ Biomarker research with prospective study designs for the early detection of cancer,” Biochim. Biophys. Acta, Proteins Proteomics (5), 874–883 (2014). 10.1016/j.bbapap.2013.12.007 [DOI] [PubMed] [Google Scholar]
- 17. Rietzschel E. and Buyzere De M., “ High-sensitive C-reactive protein: universal prognostic and causative biomarker in heart disease?,” Biomarkers Med. (1), 19–34 (2012). 10.2217/bmm.11.108 [DOI] [PubMed] [Google Scholar]
- 18. Reiter M., Twerenbold R., Reichlin T., Mueller M., Hoeller R., Moehring B., Haaf P., Wildi K., Merk S., Bernhard D., Mueller C. Z., Freese M., Freidank H., Botet C. I., and Mueller C., “ Heart-type fatty acid-binding protein in the early diagnosis of acute myocardial infarction,” Heart , 708–715 (2013) 10.1136/heartjnl-2012-303325. [DOI] [PubMed] [Google Scholar]
- 19. Obermüller N., Geiger H., Weipert C., and Urbschat A., “ Current developments in early diagnosis of acute kidney injury,” Int. Urol. Nephrol. (1), 1–7 (2014). 10.1007/s11255-013-0448-5 [DOI] [PubMed] [Google Scholar]
- 20. Wasung M. E., Chawla L. S., and Madero M., “ Biomarkers of renal function, which and when?,” Clin. Chim. Acta , 350–357 (2015). 10.1016/j.cca.2014.08.039 [DOI] [PubMed] [Google Scholar]
- 21. Doecke J. D., Laws S. M., and Faux N. G. et al. , “ BLood-based protein biomarkers for diagnosis of alzheimer disease,” Arch. Neurol. (10), 1318–1325 (2012). 10.1001/archneurol.2012.1282 [DOI] [PMC free article] [PubMed] [Google Scholar]
- 22. Walid M., “ Protein biomarker immunoassays,” Drug Discov. , 19 (2010). [Google Scholar]
- 23. Esser P., https://fscimage.fishersci.com/images/D19566∼.pdf for The surface/volume ratio in solid phase assays, 2010.
- 24. Attia U. M., Marson S., and Alcock J. R., “ Micro-injection moulding of polymer microfluidic devices,” Microfluid. Nanofluid. (1), 1 (2009). 10.1007/s10404-009-0421-x [DOI] [Google Scholar]
- 25. Bai Y., Koh C. G., Boreman M., Juang Y.-J., Tang I. C., Lee L. J., and Yang S.-T., “ Surface modification for enhancing antibody binding on polymer-based microfluidic device for enzyme-linked immunosorbent assay,” Langmuir (22), 9458–9467 (2006). 10.1021/la061123l [DOI] [PubMed] [Google Scholar]
- 26.MABTECH, Human IL6 ELISA Pro Kit (2015), see https://www.mabtech.com/sites/default/files/datasheets/3460-1HP-2.pdf.
- 27.MABTECH, Human IL6 ELISA Development Kit (2012), see https://www.mabtech.com/sites/default/files/datasheets/3460-1H-6.pdf.
- 28. Jekarl D. W., Lee S. Y., Lee J., Park Y. J., Kim Y., Park J. H., Wee J. H., and Choi S. P., “ Procalcitonin as a diagnostic Marker and IL-6 as a prognostic marker for sepsis,” Diagn. Microbiol. Infect. Dis. (4), 342–347 (2013). 10.1016/j.diagmicrobio.2012.12.011 [DOI] [PubMed] [Google Scholar]
- 29. Baillet A., Gossec L., Paternotte S., Etcheto A., Combe B., Meyer O., Mariette X., Gottenberg J. E., and Dougados M., “ Evaluation of serum interleukin-6 level as a surrogate marker of synovial inflammation and as a factor of structural progression in early rheumatoid arthritis: results from a French National Multicenter Cohort,” Arthritis Care Res. (7), 905–912 (2015). 10.1002/acr.22513 [DOI] [PubMed] [Google Scholar]
- 30. Nylen K., Ost M., Csajbok L. Z., Nilsson I., Blennow K., Nellgard B., and Rosengren L., “ Increased serum-GFAP in patients with severe traumatic brain injury is related to outcome,” J. Neurol. Sci. (1–2), 85–91 (2006). 10.1016/j.jns.2005.09.007 [DOI] [PubMed] [Google Scholar]
- 31. Kong F. W., Yuan L., Zheng Y. F., and Chen W. D., “ Automatic liquid handling for life science: A critical review of the current state of the art,” Jala-J. Lab. Autom. (3), 169–185 (2012). 10.1177/2211068211435302 [DOI] [PubMed] [Google Scholar]
- 32. Bessemans L., Jully V., de Raikem C., Albanese M., Moniotte N., Silversmet P., and Lemoine D., “ Automated gravimetric calibration to optimize the accuracy and precision of TECAN freedom EVO liquid handler,” Jala J. Lab. Autom. (5), 693–705 (2016). 10.1177/2211068216632349 [DOI] [PMC free article] [PubMed] [Google Scholar]
- 33. Bergsdorf C., Gewiese N., Stolz A., Mann R., Parczyk K., and Bomer U., “ A cost-effective solution to reduce dead volume of a standard dispenser system by a factor of 5,” J. Biomol. Screening (4), 407–412 (2006). 10.1177/1087057105285828 [DOI] [PubMed] [Google Scholar]
- 34. Temiz Y., Lovchik R. D., Kaigala G. V., and Delamarche E., “ Lab-on-a-chip devices: How to close and plug the lab?,” Microelectron. Eng. , 156–175 (2015). 10.1016/j.mee.2014.10.013 [DOI] [Google Scholar]
- 35. Bradshaw J. T., Rodrigues G., Sawyer G., Knaide T. R., Rogers A. L., and Sargent C., http://www.artel-usa.com/wp-content/uploads/2013/09/Uncovering-Dimensional-Variability-in-Standard-Microtiter-Plate-Types-Final.pdf for Uncovering Dimensional variability in standard microtiter plate types.
- 36. Kelley S. O., Mirkin C. A., Walt D. R., Ismagilov R. F., Toner M., and Sargent E. H., “ Advancing the speed, sensitivity and accuracy of biomolecular detection using multi-length-scale engineering,” Nat. Nanotechnol. (12), 969–980 (2014). 10.1038/nnano.2014.261 [DOI] [PMC free article] [PubMed] [Google Scholar]
- 37. Zhang Y., Qiao L. B., Ren Y. K., Wang X. W., Gao M., Tang Y. F., Xi J. J., Fu T. M., and Jiang X. Y., “ Two dimensional barcode-inspired automatic analysis for arrayed microfluidic immunoassays,” Biomicrofluidics (3), 034110 (2013) 10.1063/1.4811278. [DOI] [PMC free article] [PubMed] [Google Scholar]
- 38. Han D. and Park J. K., “ Microarray-integrated optoelectrofluidic immunoassay system,” Biomicrofluidics (3), 034106 (2016) 10.1063/1.4950787. [DOI] [PMC free article] [PubMed] [Google Scholar]
- 39. Huang C. Y., Tsai P. Y., Lee I. C., Hsu H. Y., Huang H. Y., Fan S. K., Yao D. J., Liu C. H., and Hsu W., “ A highly efficient bead extraction technique with low bead number for digital microfluidic immunoassay,” Biomicrofluidics (1), 011901 (2016) 10.1063/1.4939942. [DOI] [PMC free article] [PubMed] [Google Scholar]
- 40. Dixit C. K., Kadimisetty K., Otieno B. A., Tang C., Malla S., Krause C. E., and Rusling J. F., “ Electrochemistry-based approaches to low cost, high sensitivity, automated, multiplexed protein immunoassays for cancer diagnostics,” Analyst (2), 536–547 (2016). 10.1039/C5AN01829C [DOI] [PMC free article] [PubMed] [Google Scholar]


