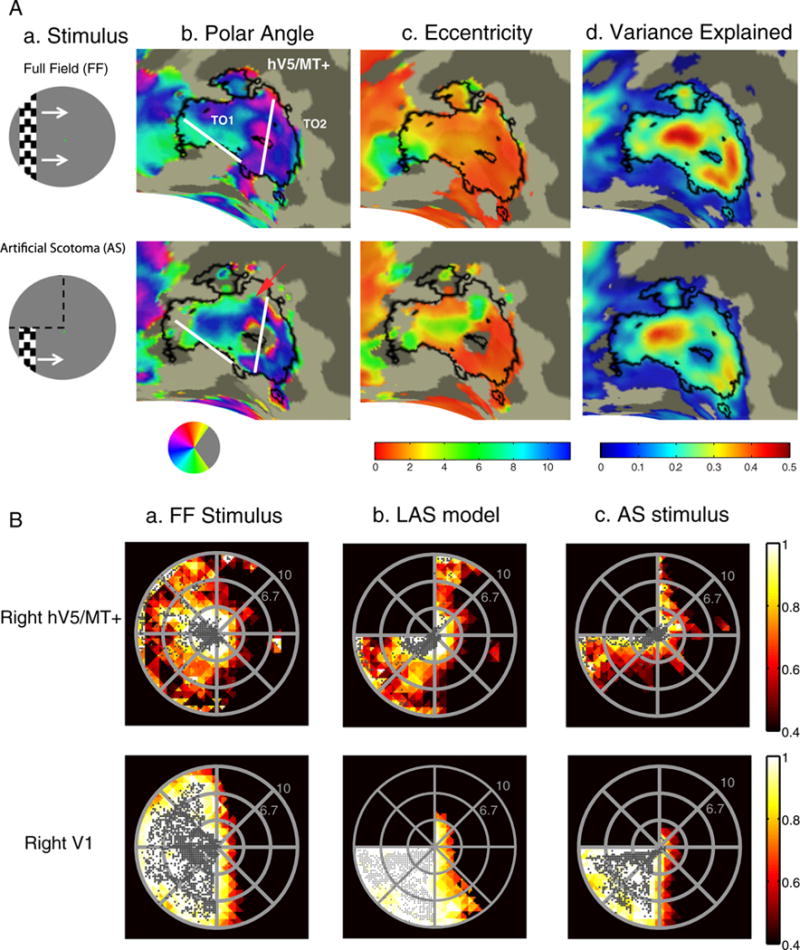
Fig. 3.

Retinotopy and visual field coverage maps of area hV5/MT+. (A.a) A snapshot of the stimulus for the vertical bar excursion under the full field (FF) stimulation (top) and when and artificial scotoma (AS) is placed on the upper left quadrant (bottom). White arrows (top) indicate the bar direction of motion and black dotted lines (bottom) the location of the AS. (A.b–d) Polar angle (b), eccentricity (c) and variance explained (d) maps overlaid on the inflated right occipito-temporal region of a subject under the full stimulus condition (top) versus the AS condition (bottom). Angular and eccentricity color maps indicate the visual field angle and eccentricity of the center of the pRF topography respectively, at each cortical location. Significantly activated voxels (explained variance >12%) of area hV5/MT+ under the full stimulus condition are selected and overlaid on the maps as a black-bordered ROI. Areas TO1 and TO2 could be identified as described in (Amano et al., 2009) and are shown here on the angular maps. We use the whole area hV5/MT+ for the subsequent analysis. A small part of area hV5/MT+ with voxels devoted to the superior visual field quadrant (magenta color on the angular map; A.b top) become unresponsive under the AS stimulation condition (A.b bottom). A larger fraction of pRFs with blue/cyan color, corresponding to the lower visual field quadrant, are observed on the angular map under the AS condition compared to the full stimulus condition (red arrow). This suggests that, as expected, under the AS condition some pRFs shift their locations to the lower quadrant where stimulus is present. (B) Top: Visual field (VF) coverage maps of area hV5/MT+ (top) from a subject (S1) under the full stimulus condition (a) under the LAS model (b) and under the actual AS condition (c). The color map indicates the maximum pRF amplitude of the topography (after appropriately thresholding and normalizing, see methods) at each visual field location of all the pRFs that cover this location. The pRF centers across all voxels within the area of interest are overlaid as gray dots. The visual field coverage of right hV5/MT+ under the full stimulus condition (top left) largely covers the contralateral hemifield. The visual field coverage of hV5/MT+ under the AS stimulus condition (c) shows a clustering of pRF centers near the border of the AS. Note that it differs from the coverage expected based on the LAS model (b) or the visual field coverage of V1 (c bottom). This suggests that the truncated stimulus has a nonlinear effect in modulating the response of hV5/MT+ voxels, leading to pRF profiles that concentrate near the AS border. Visual field coverage maps of the remaining subjects are shown in Fig. S2. Bottom: the visual field coverage of area V1 under the full stimulus condition (a) under the LAS model (b) and under the AS condition (c) is shown for comparison. We found no significant difference between the pRFs derived under the AS stimulus condition and after applying the LAS model in area V1 (Fig. S3a). Nonlinear effects of the truncated stimulus are less prominent (not seen) here, likely because of the smaller V1 receptive field size.
