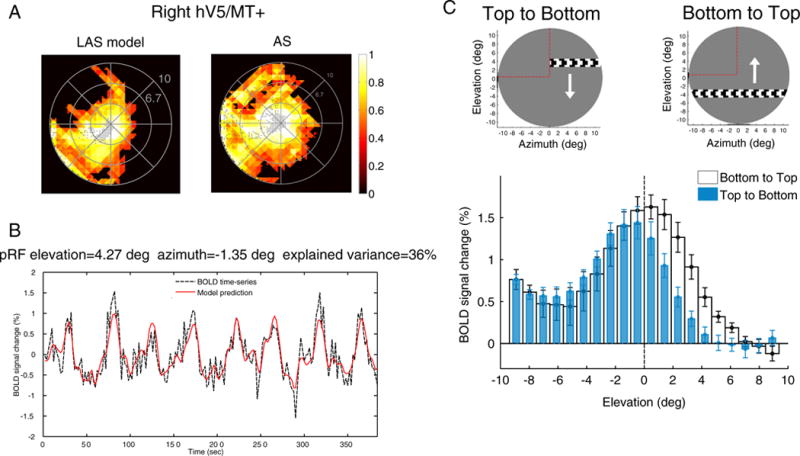
Fig. 7.

PRF biases under the AS condition. (A) Visual field coverage of the right hV5/MT+ in one subject under the LAS model (left) and under the AS condition (right) assuming the full bar stimulus for modeling the pRFs (Fig. 1D). The map covers significantly the area of the AS at the upper left quadrant of the visual field under the AS condition in contrast to the LAS model. (B) The BOLD time series of a voxel with pRF center located well within the area of the AS (elevation = 4.27°, azimuth = −1.35°). The model predicts 36% of the variance in the data suggesting that the pRF prediction is not a fitting artifact. (C) The average BOLD signal change from all voxels in the right hV5/MT+ as a horizontal bar is moving from the top (elevation >0; AS) to the bottom of the visual field (elevation <0; seeing quadrant; blue bars) and vice versa (white bars). On top, a snapshot of the orientation of the bar, the direction of motion (white arrow) and the AS location (marked with red dashed lines, for illustration purposes). Before averaging, the BOLD time series of each voxel is deconvolved to adjust for the hemodynamic response function and the baseline is subtracted. The baseline is defined as the signal value when the vertical bar is located in the far ipsilesional part of the visual field, which should produce little or no visual modulation in the region examined (see methods). This procedure sets the baseline of each voxel to zero. When the bar is moving from the top to the bottom of the visual field (blue bars), the average BOLD signal change when the bar is in the superior quadrant (location of the AS; elevation >0) drops to baseline values compared with the average signal under the full field stimulus condition. Activity starts when the bar is near 2° from the horizontal meridian (AS border), commensurate with the subject’s fixation eye movements. On the other hand, when the bar moves from the bottom to the top of the visual field (white bars), activity spreads beyond the horizontal border of the AS (elevation = 0) well within the superior quadrant corresponding to the AS. The error bars indicate the standard error of the mean across subjects (N = 5).
