

Abstract
Background
Patients with chronic obstructive pulmonary disease (COPD) often have multiple underlying comorbidities, which may lead to increased health care resource utilization (HCRU) and costs.
Objective
To describe the comorbidity profiles of COPD patients and examine the associations between the presence of comorbidities and HCRU or health care costs.
Methods
A retrospective cohort study utilizing data from a large US national health plan with a predominantly Medicare population was conducted. COPD patients aged 40–89 years and continuously enrolled for 12 months prior to and 24 months after the first COPD diagnosis during the period of January 01, 2009, through December 31, 2010, were selected. Eleven comorbidities of interest were identified 12 months prior through 12 months after COPD diagnosis. All-cause and COPD-related hospitalizations and costs were assessed 24 months after diagnosis, and the associations with comorbidities were determined using multivariate statistical models.
Results
Ninety-two percent of 52,643 COPD patients identified had at least one of the 11 comorbidities. Congestive heart failure (CHF), coronary artery disease, and cerebrovascular disease (CVA) had the strongest associations with all-cause hospitalizations (mean ratio: 1.56, 1.32, and 1.30, respectively; P<0.0001); other comorbidities examined had moderate associations. CHF, anxiety, and sleep apnea had the strongest associations with COPD-related hospitalizations (mean ratio: 2.01, 1.32, and 1.21, respectively; P<0.0001); other comorbidities examined (except chronic kidney disease [CKD], obesity, and osteoarthritis) had moderate associations. All comorbidities assessed (except obesity and CKD) were associated with higher all-cause costs (mean ratio range: 1.07–1.54, P<0.0001). CHF, sleep apnea, anxiety, and osteoporosis were associated with higher COPD-related costs (mean ratio range: 1.08–1.67, P<0.0001), while CVA, CKD, obesity, osteoarthritis, and type 2 diabetes were associated with lower COPD-related costs.
Conclusion
This study confirms that specific comorbidities among COPD patients add significant burden with higher HCRU and costs compared to patients without these comorbidities. Payers may use this information to develop tailored therapeutic interventions for improved management of patients with specific comorbidities.
Keywords: COPD, comorbidities, utilization, cost, database, Medicare
Background
Chronic lower respiratory diseases are the third leading cause of death in the US.1 One of the most prevalent diseases in this category is chronic obstructive pulmonary disease (COPD), which affects ~24 million US adults.2 COPD poses a substantial economic burden in the US; COPD-related medical costs were estimated to be $32.1 billion in 2010, including $29.5 billion in direct health care costs.2 COPD is progressive and is characterized by persistent airflow limitation, chronic and progressive dyspnea, cough, and sputum production.3,4 COPD is complicated by exacerbations that have potentially serious health consequences such as reduction in lung function and health-related quality of life, as well as increased hospitalizations and mortality.5
In addition to the inherent difficulties associated with COPD, individuals with this disease have a substantial comorbid disease burden.5,6 A study by Vanfleteren et al6 reported that 97.7% of a cohort of 213 COPD patients had one or more comorbidities, with 53.5% of the patients reporting four or more comorbid conditions. Common comorbidities include hypertension, coronary atherosclerosis and other heart diseases, disorders of lipid metabolism, diabetes mellitus (DM), fluid and electrolyte disorders, cardiac dysrhythmias, esophageal disorders, respiratory failure, pneumonia, osteoporosis, and sleep apnea.7–9 Furthermore, behavioral health conditions are common in patients with COPD, with up to 40% of patients experiencing depression and a similar proportion reporting anxiety.10
Comorbidities present in patients with COPD have been associated with negative health impacts. For example, in patients with COPD and heart failure, an exacerbation may aggravate heart failure.4 Such adverse outcomes have been shown to be more common in patients with COPD and comorbid congestive heart failure (CHF), hypertension, ischemic heart disease, and thoracic malignancies than in COPD patients without those comorbidities.4,8,11 COPD causes systemic inflammation, as do a number of COPD comorbidities.4 There is strong evidence that suggests that inflammation resulting from COPD increases the risk of developing heart disease and lung cancer, but the underlying mechanism is not yet understood.12
Comorbidities are associated with higher overall cost of managing COPD patients. An increase in health care cost among COPD patients was demonstrated by Simon-Tuval et al,13 in which a history of myocardial infarction, CHF, mild liver disease, and diabetes were identified as important cost drivers. Simon-Tuval et al also reported that patients with a higher comorbidity burden experienced higher health care costs.
It is evident that COPD is a complex disease to manage, especially in the presence of comorbidities. To further the understanding of the use of health care resources by COPD patients with comorbidities, we describe the comorbidity profiles of patients with COPD and examine the associations between the presence of specific comorbidities and health care resource utilization (HCRU) and costs. Results from this study may influence increased use of comorbidity profiles in future risk assessment for COPD patients. It may also guide payers, providers, and employers to design targeted disease management programs for COPD patients, by helping them identify specific comorbidities that may be linked to increased HCRU.
Methods
Design and data source
This retrospective observational study utilized an administrative claims database from a large US national health plan (Humana Inc., Louisville, KY, USA). Data from January 1, 2008, through December 31, 2012, were used. The database includes inpatient and outpatient medical, pharmacy and laboratory-related claims, and enrollment information for >12 million members participating in commercial insurance plans and Medicare Advantage plans with Prescription Drug benefits (MAPD). The study protocol, waiver of written informed consent, and waiver of authorization to use and disclose protected health information were approved by Schulman Institutional Review Board (Cincinnati, OH, USA), an independent institutional review board fully accredited by the Association for the Accreditation of Human Research Protection Programs (registration number is 00000971). This study followed the principles outlined in the Declaration of Helsinki.
Patient selection
Patients were eligible for inclusion in the study sample if they had ≥2 medical claims with a COPD diagnosis code (International Classification of Diseases, Ninth Revision, Clinical Modification [ICD-9-CM] diagnosis code 491.xx [chronic bronchitis], 492.xx [emphysema], or 496.xx [COPD, un specified]) in primary or secondary position during January 1, 2009, through December 31, 2010. The index date was defined as the date of the first of two chronologically occurring medical claims with a COPD diagnosis code. To be eligible for inclusion in the study sample, patients were required to be 40–89 years of age at the index date and continuously enrolled in a commercial or MAPD plan for a 12-month period prior to index date (preindex period) and a 24-month period after index date (postindex period). Patients enrolled in an Administrative Services Only (ASO) or commercial plan with data sharing restrictions were excluded. Patients were also excluded from the study sample if they had ≥1 medical claim with any of the following ICD-9-CM diagnosis codes in any position during the study period: 277.0x (cystic fibrosis), 011.x (pulmonary tuberculosis), or 140.xx–172.xx, 174.xx–209.3x, and 209.7x (malignant neoplasms).
Measures of interest
Comorbidities
Comorbidities were identified based on ICD-9-CM diagnoses and procedure codes appearing on patients’ medical claims during the 12-month period prior to and the 12-month period following index date. All ICD-9-CM codes appearing on medical claims during the observation period were organized using the Agency for Healthcare Research and Quality (AHRQ) Clinical Classifications Software (CCS)14 methodology, which enables clustering of all ICD-9-CM diagnoses and procedure codes into a manageable, multilevel set of clinically meaningful categories.
After organizing all ICD-9-CM codes according to the AHRQ CCS methodology, a total of 11 categories (comorbidities) were selected for analysis. Narrowing the list allowed for a more focused analysis and should facilitate interpretations by scientists, payers, and health care providers. A focused list of comorbidities should also allow for easier replication of analysis within other data sources. Prior to selection, AHRQ CCS categories were excluded for consideration if 1) they represented acute conditions; 2) the prefix “other” was part of the CCS category title as they comprised of rare conditions, acute conditions, and prior history codes; or 3) the CCS category represented diagnostic examinations and procedures, structural deformities, and surgical complications and procedures. Additionally, AHRQ CCS categories for hypertension and lipid disorders were excluded as they were not expected to meaningfully contribute to the analysis due to extraordinarily high prevalence of the conditions in this population. The final 11 comorbidities were selected after considering the prevalence of the remaining comorbidities in the study sample and a priori interest in certain comorbidities (eg, sleep apnea and type 2 diabetes mellitus [T2DM]).
The 11 comorbidities and respective CCS categories were obesity (CCS 3.11.2), anxiety disorders (CCS 5.2), depressive disorders (CCS 5.8.2), coronary artery disease (CAD, combined CCS 7.2.3 and 7.2.4), CHF (CCS 7.2.11.1), cerebrovascular disease (CVA, CCS 7.3), chronic kidney disease (CKD, CCS 10.1.3; includes end-stage renal disease ICD-9-CM 585.6), osteoarthritis (combined CCS 13.2.2.1 and 13.2.2.2), osteoporosis (CCS 13.4), T2DM (ICD-9-CM 250.x0, 250.x2), and sleep apnea (ICD-9-CM 780.51, 780.53, 780.57, 327.20, 327.21, 327.23, 327.27, or 327.29). T2DM and sleep apnea were selected based on a priori interest and identified by ICD-9-CM because CCS organizes each into more generalized categories.
We referenced the Deyo–Charlson comorbidity index (DCCI)15 and other sources to corroborate the selection of comorbidities.7,16–24 It was important to include obesity because rates have increased substantially over time in the general population, and associations between obesity and COPD outcomes have been observed although a paradox seems to exist where protective effects of obesity have also been observed.17 Anxiety and depression are important comorbidities and may be related to poorer outcomes for COPD patients.18 CHF, CAD, and CVA share tobacco abuse as a major risk factor, like COPD, and are leading causes of death among patients with COPD.19,20 CKD is a common condition for patients with COPD and is associated with high health care utilization.21 Osteoporosis was included because of the related risk factors of smoking, age, and sedentary lifestyle and for the potential of osteoporosis to drive health care utilization.22 Osteoarthritis was of interest because of relative prevalence and to distinguish from osteoporosis. T2DM is an important chronic condition with increasing prevalence in the general population and a greater prevalence in the population of patients with COPD.20 Sleep apnea was specifically identified because patients with co-occurring COPD and sleep apnea, also known as overlap syndrome, may more likely experience a COPD exacerbation.23,24
HCRU and costs
All-cause and COPD-related HCRU were assessed during the 24-month postindex period. HCRU was assessed in terms of emergency room (ER) visits, hospitalizations, and outpatient visits. The visits or hospitalizations were considered to be all-cause if they had ≥1 medical claim associated with it, irrespective of the diagnosis, and the visits or hospitalizations were considered to be COPD-related if they had ≥1 medical claim associated with it that satisfied at least one of the following conditions: 1) a COPD diagnosis code in the primary position, 2) a respiratory failure diagnosis code (ICD-9-CM code 518.81, 518.83, or 518.84) in the primary position accompanied by a COPD diagnosis code in the secondary position, or 3) any diagnosis code indicative of an acute exacerbation (ICD-9-CM codes 466-466.19, 480-486, 487.0, 490, 493.12, 493.22, 493.92, 494.1, 506.0-506.3, 511.0-511.1, or 518.82) in the primary position and a COPD diagnosis code in the secondary position.
All-cause and COPD-related health care costs were also assessed during the 24-month postindex period; specifically pharmacy, medical, and total costs were assessed. All-cause pharmacy cost was computed using the costs related to all pharmacy claims. COPD-related pharmacy cost was computed using costs related to pharmacy claims for any of the following classes of medication: long-acting beta agonists, long-acting muscarinic antagonists, short-acting beta agonists, short-acting muscarinic antagonists, phosphodiesterase-4 inhibitors, oral corticosteroids, inhaled corticosteroids, or fixed-dose combinations, including budesonide-formoterol, fluticasone-salmeterol, and mometasone-formoterol. All-cause medical costs were computed using the costs related to medical claims for all-cause ER visits, hospitalizations, and outpatient visits. COPD-related medical costs were computed using the costs related to medical claims for COPD-related ER visits, hospitalizations, and outpatient visits (defined earlier). Total costs were defined as the sum of medical and pharmacy costs. Claims data for the years 2007 through 2012 were included for observations, so all costs were standardized to 2012 US dollars using the medical component of the Consumer Price Index.25
Baseline patient characteristics
Baseline patient characteristics were assessed during the 12-month preindex period except as stated otherwise. Demographic characteristics including age (as of index date), geographic location, and gender were assessed. Clinical characteristics included DCCI, RxRisk-V comorbidity score, and influenza vaccination status. The DCCI uses 17 categories of comorbidities to calculate a score that reflects cumulative likelihood of 12-month mortality, and the RxRisk-V is a prescription claims-based comorbidity index that is determined based on identification of 42 distinct comorbid conditions via their associated medication treatments.15,26 RxRisk-V was developed to identify 45 conditions using medications and durable medical equipment (DME) categories, but the three DME categories were not included for the RxRisk-V calculation in this study. Higher scores for the DCCI or RxRisk-V indicate greater risk of mortality or other outcomes. HCRU was also assessed during the 12-month preindex period in terms of all-cause and COPD-related hospitalizations, ER visits, and outpatient visits.
Vaccination status for the influenza vaccine was assessed as null, partial, or full based on the number and timing of medical or pharmacy claims for influenza vaccines as follows: null, zero pharmacy or medical claims; partial, at least one pharmacy or medical claim; and full, at least two pharmacy or medical claims indicating an influenza vaccine and occurring at least 6 months apart during the postindex period. Vaccination status was determined based on postindex claims data because preindex vaccinations would have little effect on the risk of postindex outcomes. Status for the pneumococcal vaccine was not assessed since it is not recommended annually and the postindex observation period only spanned 24 months.
Statistical analysis
Measures of interest were reported using summary statistics depending on the nature of the variable. Categorical variables were described using numbers and proportions, whereas continuous variables were described using mean (standard deviation [SD]), median, and interquartile range. Descriptive statistics for both HCRU and cost data were age adjusted. Data from the 2011 Behavioral Risk Factor Surveillance System27 (Centers for Disease Control) provided estimates of the age distribution of the US population of patients (age 40–89 years) with COPD. HCRU and cost data were weighted such that the age distribution of the study sample reflected the US COPD population to provide more generalizable estimates.
Multivariate statistical analyses were conducted to assess the associations between the presence of comorbidities of interest (mentioned above) and crude HCRU and crude costs using generalized linear models (GLM) with log link and negative binomial variance functions for utilization models, and with log link and gamma variance functions for cost models. Age, gender, geographical location, influenza vaccination status, RxRisk-V score, and preindex HCRU (all-cause and COPD-related hospitalizations, all-cause outpatient, and ER visits) were included as model covariates in the multivariate statistical analyses. The GLM results included parameter estimates that were exponentiated to illustrate mean HCRU or cost ratios along with 95% confidence intervals (CIs). Mean ratios were interpreted as evidence of increased HCRU or cost (mean ratio >1.0) or decreased HCRU or cost (mean ratio <1.0) among patients with the characteristic of interest in relation to those without the characteristic. Analyses of data were conducted using SAS version 9.1.
Results
A total of 255,973 patients with a COPD diagnosis were identified within the study identification period. Approximately 20% (n=52,643) of these patients satisfied all patient selection criteria and were included in the final study sample (Figure 1).
Figure 1.
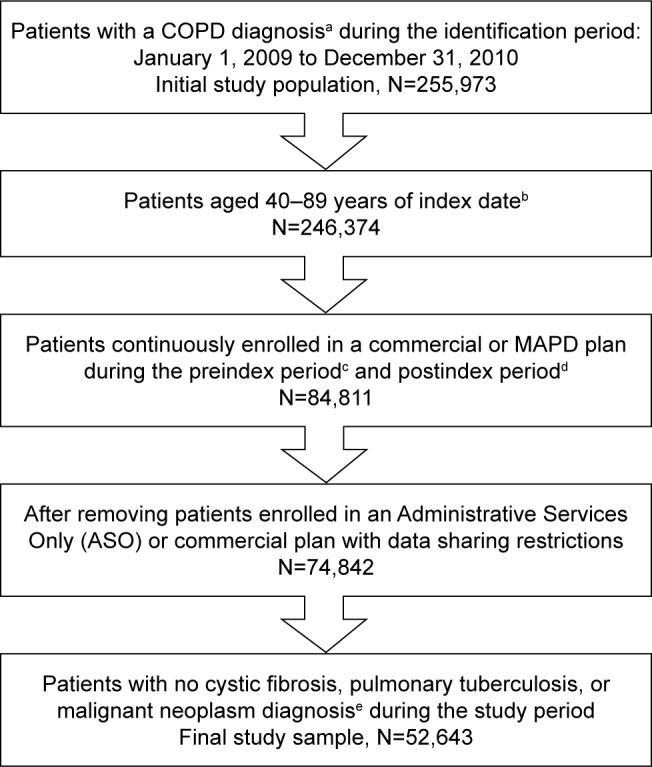
Study sample.
Notes: aCOPD diagnosis: ≥2 medical claims occurring on separate dates within 90 days with a COPD diagnosis code (ICD-9-CM code 491.xx, 492.xx, or 496.xx) in the primary or secondary position. bIndex date: the date of first medical claim with a COPD diagnosis during the study identification period. cPreindex period: a 12-month period prior to index date. dPostindex period: a 24-month period after index date. e≥1 medical claim with any of the following ICD-9-CM diagnosis codes in any position: 277.0x (cystic fibrosis), 011.x (pulmonary tuberculosis), or 140.xx–172. xx, 174.xx–209.3x, and 209.7x (malignant neoplasms).
Abbreviations: COPD, chronic obstructive pulmonary disease; ICD-9-CM, International Classification of Diseases, Ninth Revision, Clinical Modification; MAPD, Medicare Advantage plan with Prescription Drug benefits.
Mean patient age was 70.6 years (median, 71 years), and the study sample was 55% female (Table 1). A majority (68.8%) of the study sample resided in the southern region of the US. Mean DCCI and RxRisk-V scores were 2.0 (median, 1.0) and 6.1 (median, 6.0), respectively. Partial and full influenza vaccinations were obtained by 29.5% and 27.3% of patients, respectively, in the postindex period, whereas 43.2% of patients did not receive influenza vaccinations. Mean (SD) number of preindex all-cause hospitalizations and preindex COPD-related hospitalizations were 0.63 (1.15) and 0.16 (0.49), respectively. Mean (SD) number of preindex all-cause ER visits was 0.68 (1.69). The study sample had a mean of 23.3 (median, 19.0) preindex all-cause outpatient visits. The 11 comorbidities included in the analyses, along with the observed prevalence of each, are presented in Table 2. More than 92% of the study sample had at least one of the 11 comorbidities. CAD, osteoarthritis, and T2DM were each observed among >40% of the study sample.
Table 1.
Baseline patient characteristics
| Characteristic | Study sample, N=52,643 |
|---|---|
| Age, years | |
| Mean (SD) | 70.6 (9.6) |
| Median (IQR) | 71.0 (66.0–77.0) |
| Age category, n (%) | |
| 40–49 years | 1,503 (2.9) |
| 50–59 years | 5,324 (10.1) |
| 60–69 years | 16,112 (30.6) |
| 70–79 years | 19,999 (38.0) |
| 80–89 years | 9,705 (18.4) |
| Gender, n (%) | |
| Female | 28,936 (55.0) |
| Male | 23,707 (45.0) |
| Geographic location (USA), n (%) | |
| Northeast | 883 (1.7) |
| Midwest | 11,548 (21.9) |
| South | 36,227 (68.8) |
| West | 3,985 (7.6) |
| Line of business, n (%) | |
| Medicare | 50,407 (95.8) |
| Commercial | 2,236 (4.2) |
| Deyo–Charlson comorbidity index | |
| Mean (SD) | 2.0 (1.8) |
| Median (IQR) | 1.0 (1.0–3.0) |
| RxRisk-V comorbidity score | |
| Mean (SD) | 6.1 (3.4) |
| Median (IQR) | 6.0 (4.0–8.0) |
| Influenza vaccination status, n (%) | |
| Nulla | 22,750 (43.2) |
| Partialb | 15,517 (29.5) |
| Fullc | 14,376 (27.3) |
| Preindex all-cause hospitalizations | |
| Mean (SD) | 0.63 (1.15) |
| Median (IQR) | 0.0 (0.0–1.0) |
| Preindex all-cause ER visits | |
| Mean (SD) | 0.68 (1.69) |
| Median (IQR) | 0.0 (0.0–1.0) |
| Preindex all-cause outpatient visits | |
| Mean (SD) | 23.25 (17.77) |
| Median (IQR) | 19.0 (11.0–31.0) |
| Preindex COPD-related hospitalizations | |
| Mean (SD) | 0.16 (0.49) |
| Median (IQR) | 0.0 (0.0–0.0) |
Notes:
Zero claims indicating an influenza vaccine during the postindex period.
At least one claim indicating an influenza vaccine during the postindex period.
At least two claims indicating an influenza vaccine and occurring ≥6 months apart during the postindex period.
Abbreviations: SD, standard deviation; IQR, interquartile range; ER, emergency room.
Table 2.
Prevalence of comorbidities of interest during 12 months before and 12 months after the index date
| Comorbidity | Prevalence of comorbidity in the study sample (N=52,643)
|
|
|---|---|---|
| n | % | |
| Coronary artery disease | 25,152 | 47.80 |
| Osteoarthritis | 23,074 | 43.80 |
| Type 2 diabetes mellitus | 21,509 | 40.90 |
| Congestive heart failure | 14,516 | 27.60 |
| Cerebrovascular disease | 14,356 | 27.30 |
| Depressive disorders | 14,175 | 26.90 |
| Chronic kidney disease | 13,605 | 25.80 |
| Anxiety disorders | 12,249 | 23.30 |
| Osteoporosis | 10,557 | 20.10 |
| Obesity | 10,343 | 19.65 |
| Sleep apnea | 8,720 | 16.60 |
| Any of the 11 comorbidities | 48,608 | 92.34 |
More than half (55.2%) of the study sample had at least one all-cause hospitalization, and 50.3% had at least one all-cause ER visit (Table 3) in the 24-month follow-up period. At least one COPD-related outpatient visit, hospitalization, or ER visit was experienced by 68.9%, 22.1%, or 9.4% of the patients, respectively.
Table 3.
Age-adjusted,a all-cause, and COPD-related health care resource utilization by visit type during the 24-month postindex period
| Visit type
|
|||
|---|---|---|---|
| Outpatient | Hospitalization | ER | |
| All-cause health care resource utilization for the study sample (N=52,643) | |||
| Patients with at least one visit, n (%) | 52,576 (99.9) | 29,074 (55.2) | 26,488 (50.3) |
| Number of visits per person, mean (SD) | 51.3 (11.5) | 1.3 (0.7) | 1.8 (1.2) |
| Number of visits per person, median (IQR) | 43 (27–66) | 1 (0–2) | 1 (0–2) |
| COPD-related health care resource utilization for the study sample (N=52,643) | |||
| Patients with at least one visit, n (%) | 36,260 (68.9) | 11,646 (22.1) | 4,959 (9.4) |
| Number of visits per person, mean (SD) | 3.2 (1.5) | 0.4 (0.3) | 0.2 (0.3) |
| Number of visits per person, median (IQR) | 2 (0–4) | 0 (0–0) | 0 (0–0) |
Notes:
Utilization measures were weighted so that the distribution of the study sample depicted the distribution of a US population of COPD patients aged 40–89 years. The distribution of patients (age 40–89 years) diagnosed with COPD, in the US population was derived from the 2011 Behavioral Risk Factor Surveillance System data.27
Abbreviations: COPD, chronic obstructive pulmonary disease; ER, emergency room; SD, standard deviation; IQR, interquartile range.
Mean (SD) total all-cause health care costs per year were $15,463 ($6,702), of which $12,272 ($6,299) were medical costs and $3,610 ($1,937) were pharmacy costs (Table 4). Mean total COPD-related costs were $2,088 ($1,527), with medical costs of $1,397 ($1,394) and pharmacy costs of $691 ($380). Total COPD-related costs represented 13.5% of total all-cause health care costs but also represented a disproportionately lower share of all-cause medical costs (11.4%) and a disproportionately higher share of all-cause pharmacy costs (21.7%).
Table 4.
Age-adjusted,a annualized, all-cause, and COPD-related health care costsb per patient by services and visit type during the 24-month postindex period
| Total costs | Cost by service type
|
Cost by visit type
|
|||||
|---|---|---|---|---|---|---|---|
| Medical | Pharmacy | Outpatient | Hospitalization | ER | Otherc | ||
| All-cause health care resource costs for the study sample (N=52,643) | |||||||
| Mean per year (SD) | $15,463 (6,702) | $12,272 (6,299) | $3,191 (1,392) | $3,610 (1,937) | $6,251 (4,578) | $477 (365) | $1,933 (1,668) |
| Median per year (IQR) | $8,819 (4,111–18,652) | $5,696 (2,089–14,409) | $2,277 (966–3,863) | $2,120 (912–4,216) | $280 (0–6,849) | $0d (0–536) | $103 (0–1,930) |
| Mean monthly (SD) | $1,289 (558) | $1,022 (525) | $266 (116) | $301 (161) | $521 (382) | $40 (30) | $161 (139) |
| Median monthly (IQR) | $735 (343–1,554) | $475 (174–1,201) | $190 (80–322) | $177 (76–351) | $23 (0–571) | $0d (0–45) | $9 (0–161) |
| COPD-relatede health care resource costs for the study sample (N=52,643) | |||||||
| Mean per year (SD) | $2,088 (1,527) | $1,397 (1,394) | $691 (380) | $120 (91) | $769 (1,130) | $37 (69) | $471 (454) |
| Median per year (IQR) | $411 (35–2,351) | $90 (0–785) | $104 (0–885) | $14 (0–143) | $0c (0)c | $0d (0)d | $0c (0–75) |
| As a percentage of mean all-cause costsf | 13.5 | 11.4 | 21.7 | 3.3 | 12.3 | 7.8 | 24.4 |
| Mean monthly (SD) | $174 (127) | $116 (116) | $58 (32) | $10 (8) | $64 (94) | $3 (6) | $39 (38) |
| Median monthly (IQR) | $34 (3–196) | $7 (0–65) | $9 (0–74) | $1 (0–12) | $0d (0)d | $0d (0)d | $0d (0–6) |
Notes:
Cost measures were weighted so that the distribution of the study sample depicted the distribution of a US population of COPD patients aged 40–89 years. The distribution of patients diagnosed with COPD, age 40–89 years, in the US population was derived from the 2011 Behavioral Risk Factor Surveillance System data.27
All costs were uncapped and standardized to 2012 using the medical component of Consumer Price Index.
“Other” costs includes Home Care (care in patient’s home) and Nursing Facility Care (care in assisted living, group home, skilled nursing facility, nursing facility, custodial care facility, or hospice).
Median costs were $0 where <50% subjects had a visit and IQR was “0” where <25% subjects had a visit.
On average at the patient-level, COPD-related costs represented 12.7% of all medical costs and 20.7% of all pharmacy costs.
Calculated by dividing study sample-level mean COPD-related costs by study sample-level mean all-cause costs. Currency is US$.
Abbreviations: COPD, chronic obstructive pulmonary disease; ER, emergency room; SD, standard deviation; IQR, interquartile range.
Results of the multivariate analyses suggested that the presence of each of the 11 comorbidities of interest was associated with higher numbers of all-cause hospitalizations during the postindex period (Table 5). Specifically, having any of the comorbidities of interest was associated with a higher number of all-cause hospitalizations compared to not having that particular comorbidity. CHF, CAD, and CVA had the strongest associations with higher numbers of all-cause hospitalizations (mean ratios ≥1.30 and P<0.0001, Table 5). Number of all-cause hospitalizations was 56% higher for those with CHF, 32% higher for those with CAD, and 30% higher for those with CVA compared to patients without these comorbidities.
Table 5.
Associations between presence of comorbidities and number of hospitalizations
| Comorbidity | All-cause hospitalizations modela
|
COPD-related hospitalizations modela
|
||
|---|---|---|---|---|
| Mean ratio (95% CI) | P-valueb | Mean ratio (95% CI) | P-valueb | |
| Anxiety disorders | 1.19 (1.16, 1.22) | <0.0001 | 1.32 (1.25, 1.38) | <0.0001 |
| Cerebrovascular disease | 1.30 (1.27, 1.33) | <0.0001 | 1.14 (1.09, 1.19) | <0.0001 |
| Chronic kidney disease | 1.17 (1.14, 1.20) | <0.0001 | 0.98 (0.94, 1.03) | 0.5015 |
| Congestive heart failure | 1.56 (1.52, 1.60) | <0.0001 | 2.01 (1.92, 2.10) | <0.0001 |
| Coronary artery disease | 1.32 (1.29, 1.35) | <0.0001 | 1.20 (1.14, 1.25) | <0.0001 |
| Depressive disorders | 1.20 (1.17, 1.23) | <0.0001 | 1.17 (1.12, 1.23) | <0.0001 |
| Obesity | 1.07 (1.04, 1.10) | <0.0001 | 1.00 (0.95, 1.06) | 0.924 |
| Osteoarthritis | 1.11 (1.08, 1.13) | <0.0001 | 0.99 (0.95, 1.03) | 0.7215 |
| Osteoporosis | 1.05 (1.02, 1.07) | 0.0019 | 1.16 (1.10, 1.22) | <0.0001 |
| Sleep apnea | 1.05 (1.02, 1.08) | 0.0028 | 1.21 (1.14, 1.27) | <0.0001 |
| Type 2 diabetes mellitus | 1.10 (1.07, 1.13) | <0.0001 | 1.05 (1.00, 1.10) | 0.0305 |
| Any of the 11 comorbidities | 1.27 (1.19, 1.34) | <0.0001 | 0.97 (0.88, 1.06) | 0.5046 |
Notes:
Generalized linear model with log link and negative binomial variance functions. Model covariates: age, gender, geographical location, influenza vaccination status, RxRisk-V comorbidity score, preindex COPD-related hospitalizations, preindex all-cause hospitalizations, preindex all-cause emergency room visits, and preindex all-cause outpatient visits.
Mean ratio interpretation example: COPD patients with anxiety disorders were likely to experience 19% more all-cause hospitalizations compared to COPD patients without anxiety disorders.
Abbreviations: CI, confidence interval; COPD, chronic obstructive pulmonary disease.
Having a comorbidity of interest (except osteoarthritis, CKD, and obesity) was also associated with a higher number of COPD-related hospitalizations compared to not having that comorbidity; CHF, anxiety, and sleep apnea had the strongest associations (mean ratios ≥1.21 and P<0.0001, Table 5). Numbers of COPD-related hospitalizations were 101% higher with CHF (mean ratio: 2.01, 95% CI: 1.92, 2.10), 32% higher with anxiety disorders (mean ratio: 1.32, 95% CI: 1.25, 1.38), 21% higher with sleep apnea (mean ratio: 1.21, 95% CI: 1.14, 1.27), 20% higher with CAD (mean ratio: 1.20, 95% CI: 1.14, 1.25), 17% higher with depressive disorders (mean ratio: 1.17, 95% CI: 1.12, 1.23), 16% higher with osteoporosis (mean ratio: 1.16, 95% CI: 1.10, 1.22), 14% higher with CVA (mean ratio: 1.14, 95% CI: 1.09, 1.19), and 5% higher with T2DM (mean ratio: 1.05, 95% CI: 1.00, 1.10) as compared to patients without the specific comorbidity (Table 5). CKD, obesity, and osteoarthritis were not associated with higher numbers of COPD-related hospitalizations, even though they were associated with higher numbers of all-cause hospitalizations (P<0.0001, Table 5).
Comorbidities of interest (except obesity and CKD) were associated with higher all-cause health care costs based on multivariate analyses (Table 6). Comorbid CHF, CVA, and CAD had the strongest associations (mean ratio ≥1.23, Table 6). All-cause health care costs were 54% higher for those with CHF, 30% higher for those with CVA, and 23% higher for those with CAD when compared to patients without these comorbidities.
Table 6.
Associations between presence of comorbidities and all-cause and COPD-related health care costs during the postindex period: results of multivariate analysis
| Comorbidity | All-cause health care costs modela
|
COPD-related health care costs modela
|
||
|---|---|---|---|---|
| Mean ratio (95% CI) | P-valueb | Mean ratio (95% CI) | P-valueb | |
| Anxiety disorders | 1.07 (1.05, 1.09) | <0.0001 | 1.18 (1.13, 1.23) | <0.0001 |
| Cerebrovascular disease | 1.30 (1.28, 1.33) | <0.0001 | 0.92 (0.89, 0.95) | <0.0001 |
| Chronic kidney disease | 1.00 (0.98, 1.01) | 0.5987 | 0.71 (0.68, 0.73) | <0.0001 |
| Congestive heart failure | 1.54 (1.51, 1.57) | <0.0001 | 1.67 (1.61, 1.74) | <0.0001 |
| Coronary artery disease | 1.23 (1.21, 1.25) | <0.0001 | 1.00 (0.96, 1.03) | 0.8057 |
| Depressive disorders | 1.16 (1.14, 1.19) | <0.0001 | 1.02 (0.99, 1.06) | 0.2265 |
| Obesity | 1.00 (0.98, 1.02) | 0.9987 | 0.90 (0.86, 0.94) | <0.0001 |
| Osteoarthritis | 1.09 (1.07, 1.11) | <0.0001 | 0.85 (0.83, 0.88) | <0.0001 |
| Osteoporosis | 1.09 (1.07, 1.11) | <0.0001 | 1.08 (1.04, 1.13) | 0.0003 |
| Sleep apnea | 1.18 (1.15, 1.20) | <0.0001 | 1.42 (1.36, 1.49) | <0.0001 |
| Type 2 diabetes mellitus | 1.11 (1.09, 1.13) | <0.0001 | 0.91 (0.87, 0.94) | <0.0001 |
| Any of the 11 comorbidities | 1.06 (1.03, 1.10) | 0.0002 | 0.79 (0.74, 0.84) | <0.0001 |
Notes:
Generalized linear model with log link and gamma variance functions. Model covariates: age, gender, geographical location, influenza vaccination status, RxRisk-V comorbidity score, preindex COPD-related hospitalizations, preindex all-cause hospitalizations, preindex all-cause emergency room visits, and preindex all-cause outpatient visits.
Mean ratio interpretation example: COPD patients with anxiety disorders were likely to incur 7% higher all-cause health care costs compared to COPD patients without anxiety disorders.
Abbreviations: CI, confidence interval; COPD, chronic obstructive pulmonary disease.
The COPD-related total costs model also indicated that higher costs were associated with certain comorbidities: 67% higher with CHF (mean ratio: 1.67, 95% CI: 1.61, 1.74), 42% higher with sleep apnea (mean ratio: 1.42, 95% CI: 1.36, 1.49), 18% higher with anxiety disorders (mean ratio: 1.18, 95% CI: 1.13, 1.23), and 8% higher with osteoporosis (mean ratio: 1.08, 95% CI: 1.04, 1.13), while lower costs were associated with other comorbidities: 29% lower with CKD (mean ratio: 0.71, 95% CI: 0.68, 0.73), 15% lower with osteoarthritis (mean ratio: 0.85, 95% CI: 0.83, 0.88), 10% lower with obesity (mean ratio: 0.90, 95% CI: 0.86, 0.94), 9% lower with T2DM (mean ratio: 0.91, 95% CI: 0.87, 0.94), and 8% lower with CVA (mean ratio: 0.92, 95% CI: 0.89, 0.95) as compared to patients without the specific comorbidity (Table 6). Depressive disorders and CAD were not associated with higher COPD-related total costs, even though they were associated with higher all-cause health care costs (P<0.0001, Table 6). Presence of comorbid CAD had one of the strongest associations with all-cause health care costs, although it was not associated with COPD-related costs (Table 6).
Discussion
This study identified comorbid conditions in patients with COPD and evaluated the possible impact of specific comorbidities in terms of HCRU and costs. In agreement with a previous study by Vanfleteren et al6 who reported high prevalence of comorbidities in patients with COPD, the current study found that >92% of patients had at least one of the 11 comorbidities examined in this study. These comorbidities included CAD, osteoarthritis, T2DM, CHF, CVD, depressive disorders, CKD, and anxiety disorders. Another study, which was conducted by Mapel et al,28 assessed comorbidities in COPD patients using a Medicare-managed care database and found that prevalence of comorbidities was lower than reported for our study: CVA (20.5% vs 27.3%), diabetes (28.8% vs 40.9%), heart failure (33.8% vs 27.6%), depression (9.4% vs 26.9%), kidney disease/abnormal kidney function (21.9% vs 25.8%), and osteoporosis (11.7% vs 20.1%).28 Potential reasons for these differences could be due to the differences in the study design. While we assessed comorbidities over a 24-month period, the Mapel et al study utilized a maximum of a 12-month period to identify the presence of comorbidities.
High HCRU was observed in this current study; nearly, all patients had at least one all-cause outpatient visit and about half of the patients in our study had at least one all-cause hospitalization or ER visit during the 24-month postindex period. Approximately two-thirds (68.9%) of the patients had at least one COPD-related outpatient visit, and 22.1% and 9.4% of the patients had at least one COPD-related hospitalization and ER visit, respectively. Mean all-cause total health care costs were >$15,000 per year of which ~13% of the costs were COPD related. These results are not surprising considering the high prevalence of comorbidities in this patient population.
In our study, we report an association between the presence of comorbidities and all-cause and COPD-related hospitalizations and health care costs. All comorbidities assessed were associated with a higher number of all-cause and COPD-related hospitalizations (except CKD, osteoarthritis, and obesity). CHF, CAD, and CVA had the strongest associations with all-cause hospitalizations, whereas CHF, anxiety, and sleep apnea had the strongest associations with COPD-related hospitalizations. All comorbidities assessed (except obesity and CKD) were associated with higher all-cause health care costs, while CHF, sleep apnea, anxiety, and osteoporosis were associated with higher COPD-related health care costs.
The results of this study are generally consistent with prior research, ie, COPD patients with comorbidities are likely to incur higher HCRU and costs compared to COPD patients without comorbidities.29–31 The study by Lin et al29 analyzed COPD patients in a Medicaid-insured population and reported that diabetes, CHF, depression, and CVA were each associated with higher all-cause HCRU and costs. In contrast to our study, they did not observe an increase in all-cause HCRU with sleep apnea. Another study by Dalal et al30 reported increased all-cause and COPD-related HCRU and costs in COPD patients with depression/anxiety in a commercially insured population. However, comorbidities assessed in prior studies are different, and no single study captured all comorbidities evaluated in the current study and assessed the association between all-cause and COPD-related HCRU and costs. The differences can also be attributed to those in study design and population. Therefore, no direct comparisons can be made between the current study and the previously published studies.
The current study offers a comprehensive assessment of comorbidities present in COPD patients and their association with all-cause and COPD-related HCRU and costs in a predominantly Medicare population. More than half of the US COPD population is 65 years or older, and 51% of the medical costs attributable to COPD in US are paid for by Medicare, so evaluations of comorbidities, HCRU, and costs in this population segment are particularly important.2,32 Furthermore, the study concludes that specific comorbidities were associated with higher HCRU and costs based on real-world observations. Payers (managed care providers or self-insured employers) and health care providers may use information from this study to develop enhanced COPD patient risk assessment protocols, as well as tailored therapeutic interventions for improved management of patients with specific comorbidities or possibly to invest in methods of prevention. In addition to a general understanding of the associations of comorbidities with HCRU and costs, this study quantifies the actual and relative impact of these comorbidities. Quantification allows decision-makers to identify the expected costs related to a specific mix of comorbidities. Quantified data on HCRU and cost may also enhance modeling of potential return on investments for prevention programs.
In particular, vascular diseases (CHF, CAD, and CVA) were highly prevalent in the study sample and were related to greater hospitalizations. Given that COPD and these comorbidities, among others analyzed for the study, are derived from similar risk factors, especially smoking, there may be opportunity for payers to invest more in prevention strategies, like tobacco cessation, as a strategy to curtail multiple comorbid conditions. Physicians can support or lead in efforts, like tobacco cessation, for prevention of vascular diseases and respiratory diseases as well.
Limitations of this study are consistent with studies based on health care administrative claims analysis. Generalizing the study findings to the entire US population should be approached with caution as this study assessed a predominantly Medicare population. As in other administrative claims analysis, coding errors and miscoding may have influenced patient identification and results interpretation. The potential for selection bias in the study sample exists as all patients included in the study were required to have at least 3 years of continuous insurance coverage. The claims data lack clinical information such as lung function tests used for confirmation of COPD diagnosis and assessment of disease severity, leading to a potential misclassification. Even though statistically significant associations and temporal associations can be established, causal relationship cannot be determined.
Conclusion
The presence of specific comorbidities among COPD patients pose a significant health care burden with higher HCRU and costs compared to COPD patients without these comorbidities. Payers or providers can use these findings to identify patients at greater risk of acute HCRU by assessing comorbidity profiles in an effort to target COPD care management resources. Insights from this study may also enable payers to develop more holistic disease management programs and support services to more efficiently or effectively impact patients’ quality of life while managing costs.
Acknowledgments
The authors thank Tristan Cordier, MPH, a full-time employee of Humana Inc. for assistance with Behavioral Risk Factor Surveillance System data used to age-adjust descriptive HCRU and cost statistics for the manuscript and Mary Costantino, PhD, a full-time employee of Comprehensive Health Insights, Inc. for assistance in the development, revisions, and editing of this manuscript.
Footnotes
Disclosure
This study was funded by Humana Inc. and Boehringer Ingelheim Pharmaceuticals Inc. Andrew Renda is an employee and shareholder of Humana Inc.; Amol D Dhamane, Kate Burslem, and Shuchita Kaila are employees of Boehringer Ingelheim Pharmaceuticals Inc.; Phil Schwab, Sari D Hopson, Chad Moretz, and Srinivas Annavarapu are employees of Comprehensive Health Insights, Inc., a wholly-owned subsidiary of Humana Inc., who were paid consultants to Boehringer Ingelheim Pharmaceuticals Inc. in connection with the analysis described in this study and with manuscript development. The authors report no other conflicts of interest in this work.
References
- 1.Miniño A, Xu J, Kochanek K. Deaths: preliminary data for 2008. Natl Vital Stat Rep. 2010;59(2):1–52. [PubMed] [Google Scholar]
- 2.Ford ES, Murphy LB, Khavjou O, Giles WH, Holt JB, Croft JB. Total and state-specific medical and absenteeism costs of COPD among adults aged ≥18 years in the United States for 2010 and projections through 2020. Chest. 2015;147(1):31–45. doi: 10.1378/chest.14-0972. [DOI] [PubMed] [Google Scholar]
- 3.Andersson F, Borg S, Jansson SA, et al. The costs of exacerbations in chronic obstructive pulmonary disease (COPD) Respir Med. 2002;96(9):700–708. doi: 10.1053/rmed.2002.1334. [DOI] [PubMed] [Google Scholar]
- 4.Global Initiative for Chronic Obstructive Lung Disease global Strategy for Diagnosis, Management and Prevention of COPD. 2015. [Accessed October 27, 2015]. Available from: http://www.goldcopd.org/uploads/users/files/GOLD_Report_2015_Feb18.pdf.
- 5.Smith MC, Wrobel JP. Epidemiology and clinical impact of major comorbidities in patients with COPD. Int J Chron Obstruct Pulmon Dis. 2014;9:871–888. doi: 10.2147/COPD.S49621. [DOI] [PMC free article] [PubMed] [Google Scholar]
- 6.Vanfleteren LE, Spruit MA, Groenen M, et al. Clusters of comorbidities based on validated objective measurements and systemic inflammation in patients with chronic obstructive pulmonary disease. Am J Respir Crit Care Med. 2013;187(7):728–735. doi: 10.1164/rccm.201209-1665OC. [DOI] [PubMed] [Google Scholar]
- 7.Wier L, Elixhauser A, Pfuntner A, Au D. HCUP Statistical Brief #106. Rockville, MD: Agency for Healthcare Research and Quality (US); 2011. Overview of Hospitalizations among Patients with COPD, 2008. (National Vital Statistics Reports). [PubMed] [Google Scholar]
- 8.Holguin F, Folch E, Redd SC, Mannino DM. Comorbidity and mortality in COPD-related hospitalizations in the United States, 1979 to 2001. Chest. 2005;128(4):2005–2011. doi: 10.1378/chest.128.4.2005. [DOI] [PubMed] [Google Scholar]
- 9.Menzin J, Boulanger L, Marton J, et al. The economic burden of chronic obstructive pulmonary disease (COPD) in a U.S. Medicare population. Respir Med. 2008;102(9):1248–1256. doi: 10.1016/j.rmed.2008.04.009. [DOI] [PubMed] [Google Scholar]
- 10.Cully JA, Graham DP, Stanley MA, et al. Quality of life in patients with chronic obstructive pulmonary disease and comorbid anxiety or depression. Psychosomatics. 2006;47(4):312–319. doi: 10.1176/appi.psy.47.4.312. [DOI] [PubMed] [Google Scholar]
- 11.Negewo NA, Gibson PG, McDonald VM. COPD and its comorbidities: impact, measurement and mechanisms. Respirology. 2015;20(8):1160–1171. doi: 10.1111/resp.12642. [DOI] [PubMed] [Google Scholar]
- 12.King PT. Inflammation in chronic obstructive pulmonary disease and its role in cardiovascular disease and lung cancer. Clin Transl Med. 2015;4(1):68. doi: 10.1186/s40169-015-0068-z. [DOI] [PMC free article] [PubMed] [Google Scholar]
- 13.Simon-Tuval T, Scharf SM, Maimon N, Bernhard-Scharf BJ, Reuveni H, Tarasiuk A. Determinants of elevated healthcare utilization in patients with COPD. Respir Res. 2011;12:7. doi: 10.1186/1465-9921-12-7. [DOI] [PMC free article] [PubMed] [Google Scholar]
- 14.Healthcare Cost and Utilization Project (HCUP) [webpage on the Internet] Clinical Classifications Software (CCS) for ICD-9-CM. [Accessed August 2013]. Available from: http://www.hcup-us.ahrq.gov/toolssoftware/ccs/ccs.jsp.
- 15.Deyo RA, Cherkin DC, Ciol MA. Adapting a clinical comorbidity index for use with ICD-9-CM administrative databases. J Clin Epidemiol. 1992;45(6):613–619. doi: 10.1016/0895-4356(92)90133-8. [DOI] [PubMed] [Google Scholar]
- 16.Cavaillès A, Brinchault-Rabin G, Dixmier A, et al. Comorbidities of COPD. Eur Respir Rev. 2013;22(130):454–475. doi: 10.1183/09059180.00008612. [DOI] [PMC free article] [PubMed] [Google Scholar]
- 17.Hanson C, Rutten E, Wouters E, Rennard S. Influence of diet and obesity on COPD development and outcomes. Int J Chron Obstruct Pulmon Dis. 2014;9:723–733. doi: 10.2147/COPD.S50111. [DOI] [PMC free article] [PubMed] [Google Scholar]
- 18.Laurin C, Moullec G, Bacon S, Lavoie K. Impact of anxiety and depression on chronic obstructive pulmonary disease exacerbation risk. Am J Respir Crit Care Med. 2012;185(9):918–923. doi: 10.1164/rccm.201105-0939PP. [DOI] [PubMed] [Google Scholar]
- 19.Rusinaru D, Saaidi I, Godard S, Mahjoub H, Battle C, Tribouilloy C. Impact of chronic obstructive pulmonary disease on long-term outcome of patients hospitalized for heart failure. Am J Cardiol. 2008;101(3):353–358. doi: 10.1016/j.amjcard.2007.08.046. [DOI] [PubMed] [Google Scholar]
- 20.Feary JR, Rodrigues LC, Smith CJ, Hubbard RB, Gibson JE. Prevalence of major comorbidities in subjects with COPD and incidence of myocardial infarction and stroke: a comprehensive analysis using data from primary care. Thorax. 2010;65(11):956–962. doi: 10.1136/thx.2009.128082. [DOI] [PubMed] [Google Scholar]
- 21.Yoshizawa T, Okada K, Furuichi S, et al. Prevalence of chronic kidney diseases in patients with chronic obstructive pulmonary disease: assessment based on glomerular filtration rate estimated from creatinine and cystatin C levels. Int J Chron Obstruct Pulmon Dis. 2015;10:1283–1128. doi: 10.2147/COPD.S80673. [DOI] [PMC free article] [PubMed] [Google Scholar]
- 22.Lehouck A, Boonen S, Decramer M, Janssens W. COPD, bone metabolism, and osteoporosis. Chest. 2011;139(3):648–657. doi: 10.1378/chest.10-1427. [DOI] [PubMed] [Google Scholar]
- 23.Weitzenblum E, Chaouat A, Kessler R, Canuet M. Overlap syndrome: obstructive sleep apnea in patients with chronic obstructive pulmonary disease. Proc Am Thorac Soc. 2008;5(2):237–241. doi: 10.1513/pats.200706-077MG. [DOI] [PubMed] [Google Scholar]
- 24.Chaouat A, Weitzenblum E, Krieger J, et al. Prognostic value of lung function and pulmonary haemodynamics in OSA patients treated with CPAP. Eur Respir J. 1999;13(5):1091–1096. doi: 10.1034/j.1399-3003.1999.13e25.x. [DOI] [PubMed] [Google Scholar]
- 25.Bureau of Labor Statistics [homepage on the Internet] [Accessed December 22, 2016]. Available from: https://www.bls.gov/data/
- 26.Sloan KL, Sales AE, Liu CF, et al. Construction and characteristics of the RxRisk-V: a VA-adapted pharmacy-based case-mix instrument. Med Care. 2003;41(6):761–774. doi: 10.1097/01.MLR.0000064641.84967.B7. [DOI] [PubMed] [Google Scholar]
- 27.Centers for Disease Control and Prevention (CDC) Behavioral Risk Factor Surveillance System Survey Data. Atlanta, GA: U.S. Department of Health and Human Services, Centers for Disease Control and Prevention; 2011. [Google Scholar]
- 28.Mapel DW, Dutro MP, Marton JP, Woodruff K, Make B. Identifying and characterizing COPD patients in US managed care. A retrospective, cross-sectional analysis of administrative claims data. BMC Health Serv Res. 2011;11:43. doi: 10.1186/1472-6963-11-43. [DOI] [PMC free article] [PubMed] [Google Scholar]
- 29.Lin PJ, Shaya FT, Scharf SM. Economic implications of comorbid conditions among Medicaid beneficiaries with COPD. Respir Med. 2010;104(5):697–704. doi: 10.1016/j.rmed.2009.11.009. [DOI] [PubMed] [Google Scholar]
- 30.Dalal AA, Shah M, Lunacsek O, Hanania NA. Clinical and economic burden of depression/anxiety in chronic obstructive pulmonary disease patients within a managed care population. COPD. 2011;8(4):293–299. doi: 10.3109/15412555.2011.586659. [DOI] [PubMed] [Google Scholar]
- 31.Mapel DW, McMillan GP, Frost FJ, et al. Predicting the costs of managing patients with chronic obstructive pulmonary disease. Respir Med. 2005;99(10):1325–1333. doi: 10.1016/j.rmed.2005.03.001. [DOI] [PubMed] [Google Scholar]
- 32.Centers for Disease Control and Prevention Chronic obstructive pulmonary disease among adults – United States, 2011. MMWR Morb Mortal Wkly Rep. 2012;61(46):938–943. [PubMed] [Google Scholar]