Abstract
Phosphate (Pi) homeostasis is regulated by renal, intestinal, and endocrine mechanisms through which Pi intake stimulates parathyroid hormone (PTH) and fibroblast growth factor-23 secretion, increasing phosphaturia. Mechanisms underlying the early adaptive phase and the role of the intestine, however, remain ill defined. We investigated mineral, endocrine, and renal responses during the first 4 hours after intravenous and intragastric Pi loading in rats. Intravenous Pi loading (0.5 mmol) caused a transient rise in plasma Pi levels and creatinine clearance and an increase in phosphaturia within 10 minutes. Plasma calcium levels fell and PTH levels increased within 10 minutes and remained low or high, respectively. Fibroblast growth factor-23, 1,25-(OH)2-vitamin D3, and insulin concentrations did not respond, but plasma dopamine levels increased by 4 hours. In comparison, gastric Pi loading elicited similar but delayed phosphaturia and endocrine responses but did not affect plasma mineral levels. Either intravenous or gastric loading led to decreased expression and activity of renal Pi transporters after 4 hours. In parathyroidectomized rats, however, only intravenous Pi loading caused phosphaturia, which was blunted and transient compared with that in intact rats. Intravenous but not gastric Pi loading in parathyroidectomized rats also led to higher creatinine clearance and lower plasma calcium levels but did not reduce the expression or activity of Pi transporters. This evidence suggests that an intravenous or intestinal Pi bolus causes rapid phosphaturia through mechanisms requiring PTH and downregulation of renal Pi transporters but does not support a role of the intestine in stimulating renal clearance of Pi.
Keywords: phosphate uptake, parathyroid hormone, intestine, phosphate-sensing
Phosphate (Pi) homeostasis is achieved by the balanced actions of intestinal absorption, renal reabsorption, and bone mineralization/demineralization. Intestinal absorption and renal reabsorption of Pi are mostly mediated by Na+–dependent phosphate (NaPi) cotransporters from the SLC34 family of solute carriers, consisting of the renal NaPi-IIa and NaPi-IIc, and the intestinal NaPi-IIb transporters.1 The activity and expression of these transporters are downregulated in response to increased dietary Pi intake, whereas Pi deficiency promotes their upregulation.1,2 The adaptive regulation of renal and intestinal Pi transport is at least in part mediated by several hormones, including fibroblast growth factor-23 (FGF23), 1,25-dihydroxy-vitamin D3 [1,25-(OH)2-vitamin D3], parathyroid hormone (PTH), insulin, and dopamine.2–6 PTH and FGF23 rise in response to Pi intake and alone or together downregulate renal Pi transporters, increasing phosphaturia.3,5 Similarly, dopamine stimulates renal Pi excretion by reducing renal Pi transporter activity and expression.7–9 1,25-(OH)2-vitamin D3 levels increase during Pi deficiency and enhance renal and intestinal Pi absorption.3,10–12 Also, insulin stimulates expression of renal Pi transporters and reduces phosphaturia.13 The actions of FGF23, PTH, and 1,25-(OH)2-vitamin D3 are coupled through multiple negative and positive feedback loops.3,5,14
However, the exact roles of these hormones in the acute and chronic response to changes in Pi intake are not fully defined. Moreover, the existence and role of additional factors and mediators in the control of Pi homeostasis have been proposed.15,16 Klotho, a cofactor for FGF23 signaling, also exerts direct effects on renal Pi and calcium transporters independent from FGF23.5,17,18 MEPE and sFRP4 may act on renal and extrarenal targets to lower plasma Pi.19–21 Also, the existence of a putative intestinal phosphaturic factor has been postulated on the basis of the rapid phosphaturic effect of duodenal Pi infusion; the absence of changes in plasma Pi, PTH, and FGF23; its independence from renal innervation; and the phosphaturic effect of duodenal extracts from Pi-infused rats.22 However, in humans, acute enteral and parenteral Pi loads cause dose-dependent changes in phosphaturia only on changes in plasma Pi and PTH, and a similar phosphaturic response is observed with both routes of Pi administration. Thus, in contrast to rodents, the human data are not consistent with the presence of an intestinal Pi sensor.23 Local Pi sensing mechanisms in kidney and other organs may be involved in sensing changes in dietary Pi intake and may mediate or modulate some of the effects on renal Pi handling. Evidence for Pi sensing has been obtained from isolated parathyroid gland cells in vitro,24,25 the opossum kidney–derived OK cell line,26,27 bone, and vascular cells28–30
The aim of this study was to investigate the endocrine, mineral, and renal responses to acute Pi loading in rats and test for evidence for a role of the intestine in determining the adaptive response by administering Pi either intravenously or intragastrically.
Results
Pi Loading Rapidly Elicits Phosphaturia
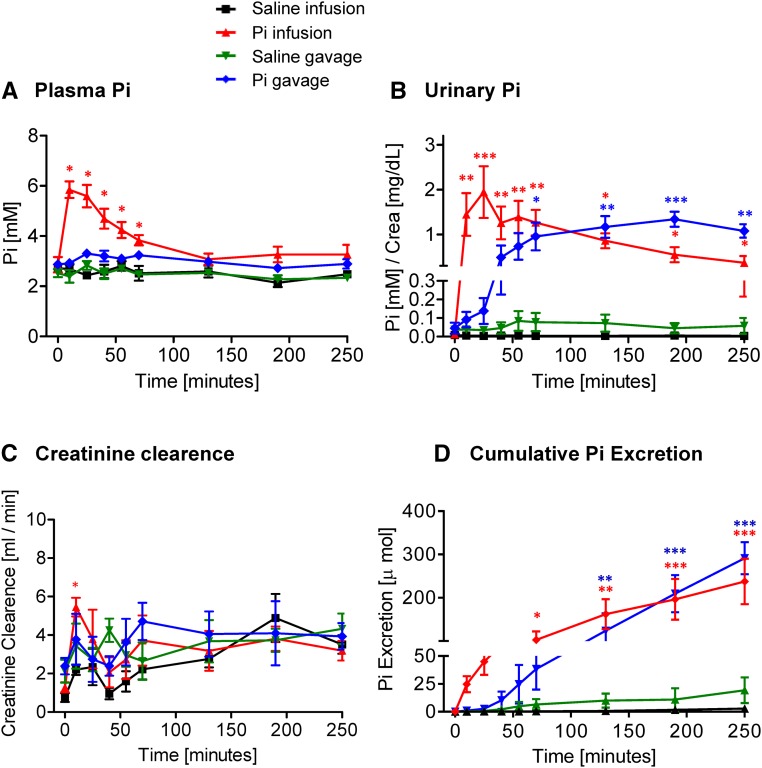
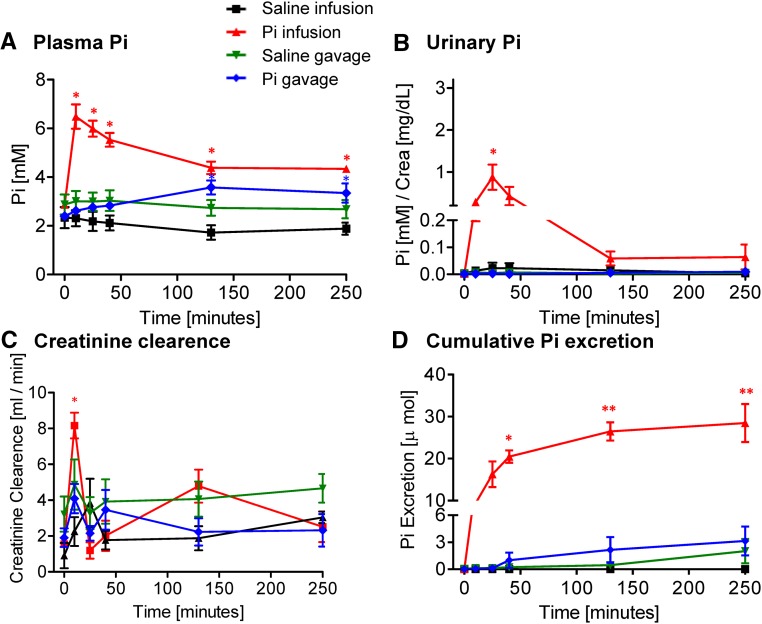
Intravenous infusion of a Pi bolus (500 μmol Pi) caused a rapid and transient increase in plasma Pi concentration in intact rats (Figure 1A), with a peak after 10 minutes. Two hours after infusion, plasma Pi had returned to baseline values. A significant, although blunted, increase in plasma Pi was observed after 10 minutes on infusion of 150 μmol Pi but not with 50 μmol Pi (Supplemental Figure 1A). In contrast, plasma Pi did not change in rats gavaged with 500 μmol Pi (Figure 1A). The concentration of plasma Pi remained normal after intravenous or intragastric administration of 500 or 150 μmol NaCl (Figure 1A, Supplemental Figure 2A).
Figure 1.
Effect of intravenous and intragastric administration of Pi on body Pi distribution and renal excretion in intact rats. Rats were loaded with 500 μmol Pi or saline intravenously or orally. (A) Plasma Pi, (B) urinary Pi/creatinine, (C) creatinine clearance, and (D) cumulative Pi excretion. Four profiles are shown: saline intravenous infusion (black), Pi intravenous infusion (red), saline intragastric gavage (green), and Pi intragastric gavage (blue). Data are presented as the means±SEM. ANOVA test; n=5–9 per group and time point. *P<0.05 versus time 0; **P<0.01 versus time 0; ***P<0.001 versus time 0.
Intravenous infusion of 500 μmol Pi rapidly and strongly increased urinary Pi excretion within 10 minutes. Although phosphaturia tended to decrease after 30 minutes, it remained high over 4 hours after administration (Figure 1B). Infusions of 150 and 50 μmol Pi failed to induce any significant phosphaturic response (Supplemental Figure 1B). Intragastric administration of 500 μmol Pi increased urinary excretion of Pi to a similar extent as intravenous administration; however, the onset of phosphaturia was delayed compared with infusion, reaching significance only 60 minutes after the Pi bolus (Figure 1B). Phosphaturia remained high over 4 hours postgavage (Figure 1B). Changes in the fractional excretion of Pi after the Pi bolus paralleled urinary Pi concentration (Supplemental Figure 3A). Neither intravenous infusion nor gavage of 500 or 150 μmol NaCl affected the urinary excretion of Pi (Figure 1B, Supplemental Figure 2B).
Creatinine clearance significantly increased within 10 minutes after intravenous application of 500 μmol Pi and thereafter, rapidly normalized (Figure 1C). Intragastric loading with 500 μmol Pi did not alter creatinine clearance (Figure 1C). Similarly, administration of 500 or 150 μmol NaCl by infusion or gavage had no effect (Figure 1C) (data not shown).
The cumulative urinary excretion of Pi showed a similar level after 4 hours of the oral or intravenous bolus (Figure 1D). Although a delay was observed in the gavage group, both groups had excreted comparable amounts of Pi 4 hours postapplication, with mean values of around 230 and 280 μmol Pi, respectively, representing about 50%–60% of the initial Pi load (500 μmol).
To examine possible organ storage of the nonexcreted Pi, we assessed the Pi content in femurs, liver, and skeletal muscle in tissues from rats infused and gavaged with Pi or NaCl. As expected, the concentration of Pi in femurs was higher (10–20 times) than in the other two organs (Supplemental Figure 4). However, in all three tissues, similar levels of Pi were measured in samples from control and Pi-loaded rats.
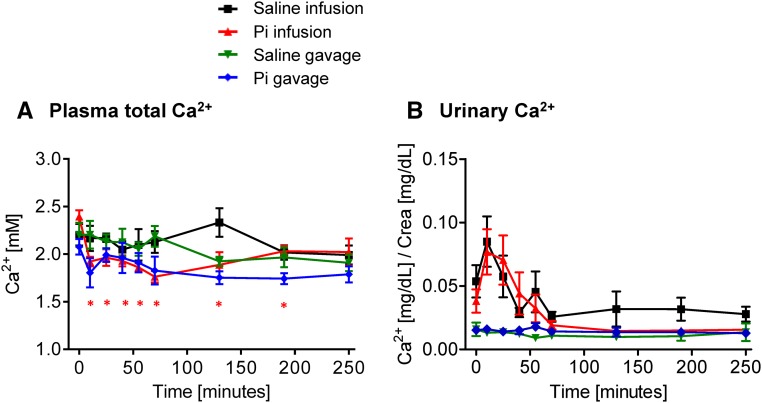
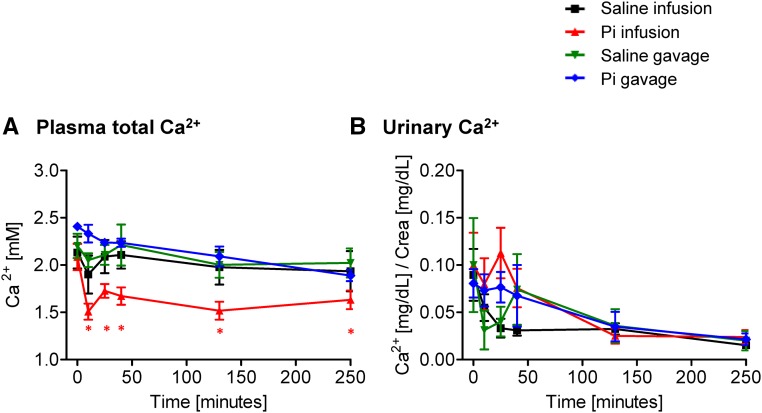
The concentration of total Ca2+ in plasma slightly but significantly decreased on intravenous infusion of 500 μmol Pi (Figure 2A). The reduction was already detectable 10 minutes after the Pi bolus, and although it tended to normalize at the latest time points, plasma Ca2+ remained low until the end of the experiment (4 hours). Similar changes were observed on Pi infusion with 150 μmol Pi but not observed with 50 μmol Pi (Supplemental Figure 1C). In contrast, total plasma Ca2+ did not change significantly after intragastric administration of 500 μmol Pi (Figure 2A). Infusion or gavage with either 500 or 150 μmol NaCl did not alter total plasma Ca2+ (Figure 2A, Supplemental Figure 2C).
Figure 2.
Effect of intravenous and intragastric administration of Pi on Ca2+ plasma levels and urinary excretion in intact rats. Rats were loaded with 500 μmol Pi or saline intravenously or orally. (A) Plasma Ca2+ and (B) urinary Ca2+/creatinine. Four profiles are shown: saline intravenous infusion (black), Pi intravenous infusion (red), saline intragastric gavage (green), and Pi intragastric gavage (blue). Data are presented as the means±SEM. ANOVA test; n=5–9 per group and time point. *P<0.05 versus time 0.
The urinary excretion of Ca2+ remained unchanged after intravenous or intragastric Pi or NaCl application (Figure 2B, Supplemental Figures 1D and 2D). However, infusion with Pi or NaCl caused a small, nonsignificant, and transient increase in urinary Ca2+ excretion, possibly reflecting an acute volume load (Figure 2B).
Pi Loading Causes an Immediate PTH Rise
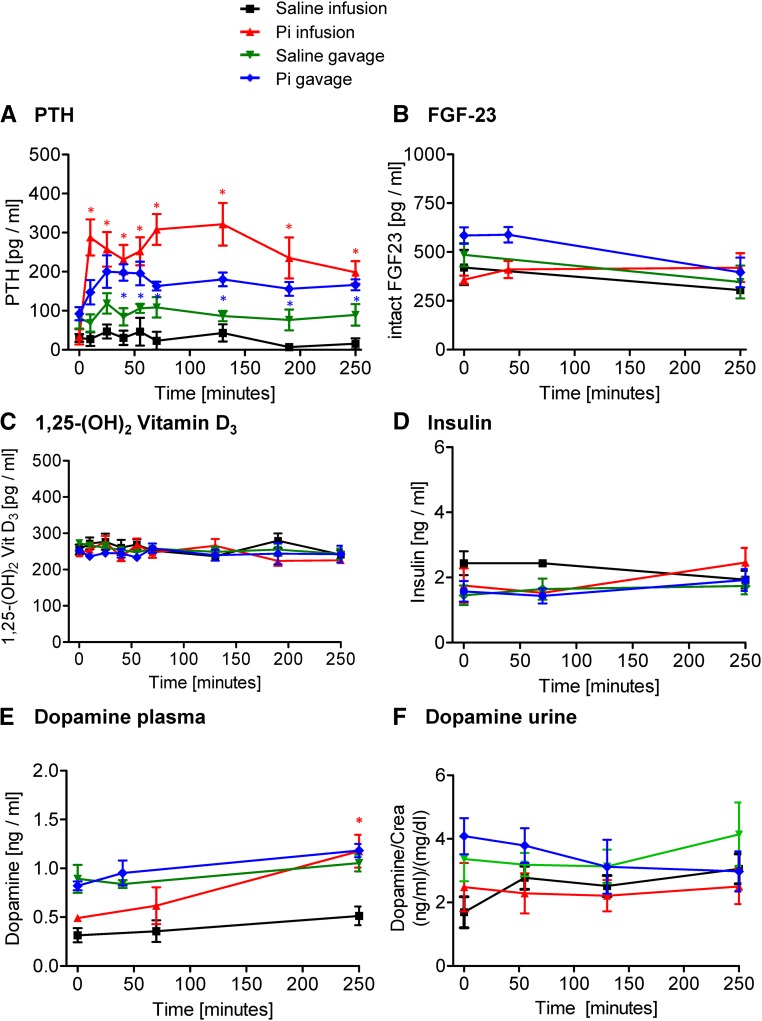
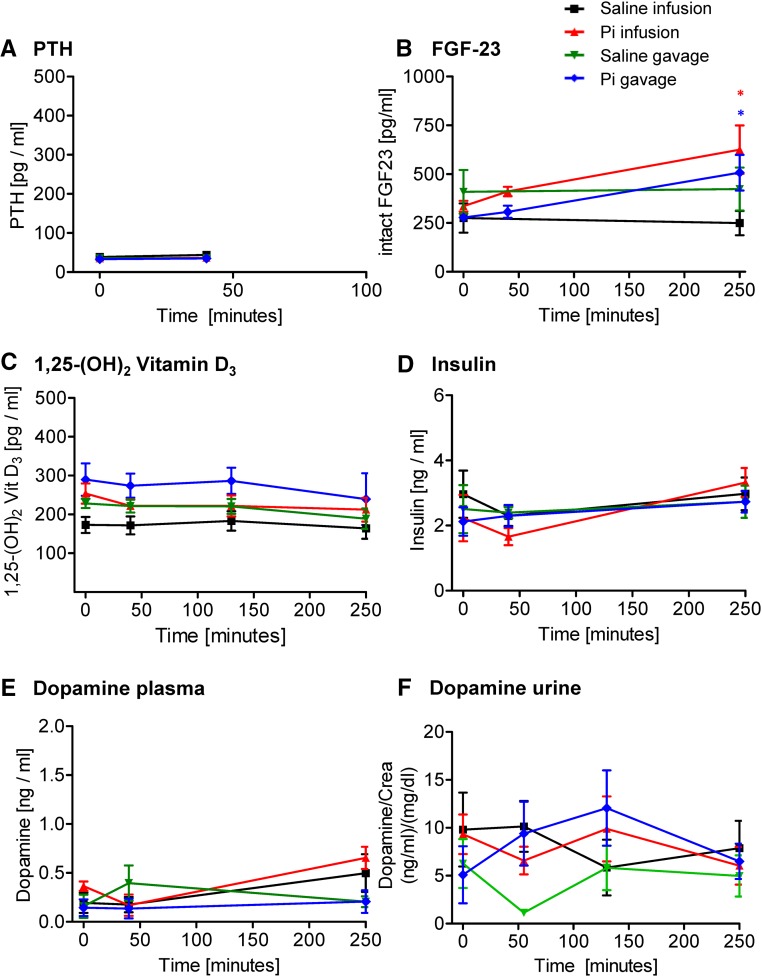
In intact animals, intravenous infusion of 500 μmol Pi increased plasma intact PTH levels sixfold within 10 minutes, whereas in gavaged rats, a twofold increase was detected after 25 minutes, paralleling or even preceding the increase in urinary Pi excretion (Figure 3A). In both cases, PTH remained high 4 hours after Pi administration (Figure 3A). No changes in the plasma levels of intact FGF23 (Figure 3B), 1,25-(OH)2-vitamin D3 (Figure 3C), and insulin (Figure 3D) were observed in rats after Pi administration. Plasma dopamine significantly increased at 4 hours after 500 μmol Pi infusion but not gavage (Figure 3E), whereas urine dopamine was not altered (Figure 3F). Infusion and gavage with saline had no effect on the hormones analyzed.
Figure 3.
Effect of intravenous and intragastric administration of Pi on hormonal levels in intact rats. Rats were loaded with 500 μmol Pi or saline intravenously or orally. (A) Plasma intact PTH, (B) plasma intact FGF23, (C) plasma 1,25-(OH)2-vitamin D3, (D) plasma insulin, (E) plasma dopamine, and (F) urine dopamine. Four profiles are shown: saline intravenous infusion (black), Pi intravenous infusion (red), saline intragastric gavage (green), and Pi intragastric gavage (blue). Data are presented as the means±SEM. ANOVA test; n=5–9 per group and time point. *P<0.05 versus time 0.
The Pi Load Reduces Renal Pi Transporter Activity and Expression
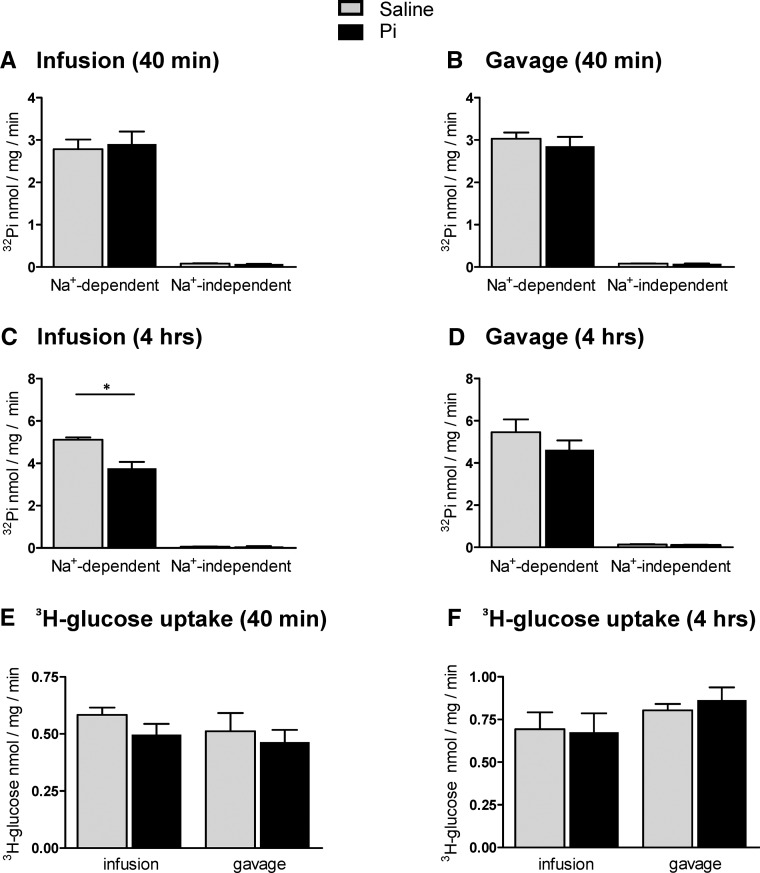
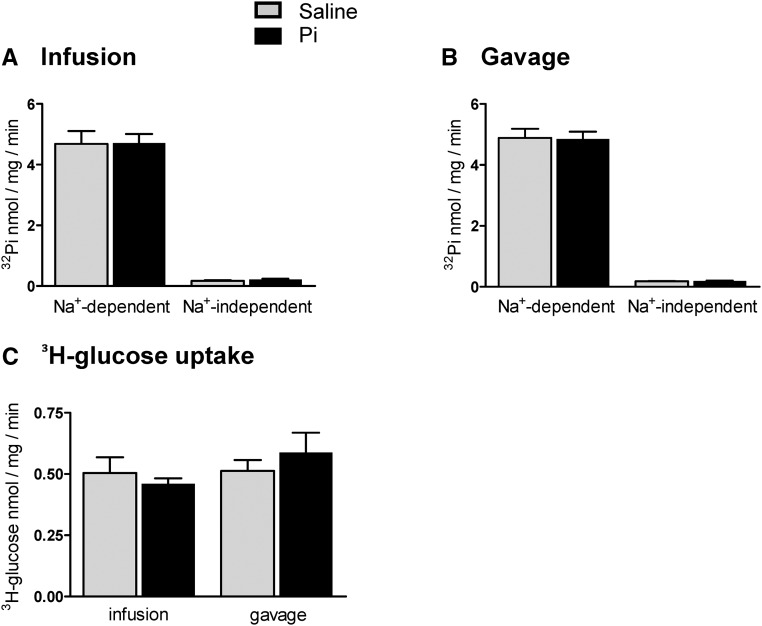
Flux measurements of 32Pi and 3H-d-glucose were performed in brush border membrane vesicles (BBMVs) isolated from kidneys collected 40 minutes and 4 hours after 500 μmol Pi or saline application to assess proximal tubular luminal Pi transporter activity. In BBMVs from kidneys extracted 40 minutes after application, all 32Pi uptake components were similar in Pi-loaded and control samples (Figure 4, A and B). Similarly, no differences were detected for the Na+-dependent uptake of d-glucose (Figure 4E). In contrast, the total Na+–dependent as well as SLC34–mediated 32Pi transport activities were reduced in kidneys 4 hours after infusion with 500 μmol Pi (Figure 4C). 32Pi fluxes also decreased, although nonsignificantly, in the Pi-gavaged animals after 4 hours (Figure 4D). The Na+-dependent uptake of d-glucose remained unaffected for 4 hours in Pi-infused or -gavaged animals (Figure 4F).
Figure 4.
Effect of intravenous and intragastric administration of Pi on Pi and glucose transport activities in renal BBMVs from intact rats. Rats were loaded with 500 μmol Pi or saline intravenously or orally. Kidneys were extracted 40 minutes or 4 hours after infusion or gavage, and Na+–dependent and –independent Pi and glucose transport activities were measured. Pi transport was assayed in the presence or absence of the SLC34 transport inhibitor phosphonoformic acid. (A) 32P uptakes 40 minutes after intravenous infusion of saline (gray bars) and Pi (black bars). (B) 32P uptakes 40 minutes after intragastric administration of saline (gray bars) and Pi (black bars). (C) 32P uptakes 4 hours after intravenous infusion of saline (gray bars) and Pi (black bars). (D) 32P uptakes 4 hours after intragastric administration of saline (gray bars) and Pi (black bars). (E) 3H-d-glucose uptakes 40 minutes after intravenous and intragastric administration of saline (gray bars) and Pi (black bars). (F) 3H-d-glucose uptakes 4 hours after intravenous and intragastric administration of saline (gray bars) and Pi (black bars). Data are presented as the means±SEM. Unpaired t test; n=5–9 per group and time point. *P<0.05 versus saline group.
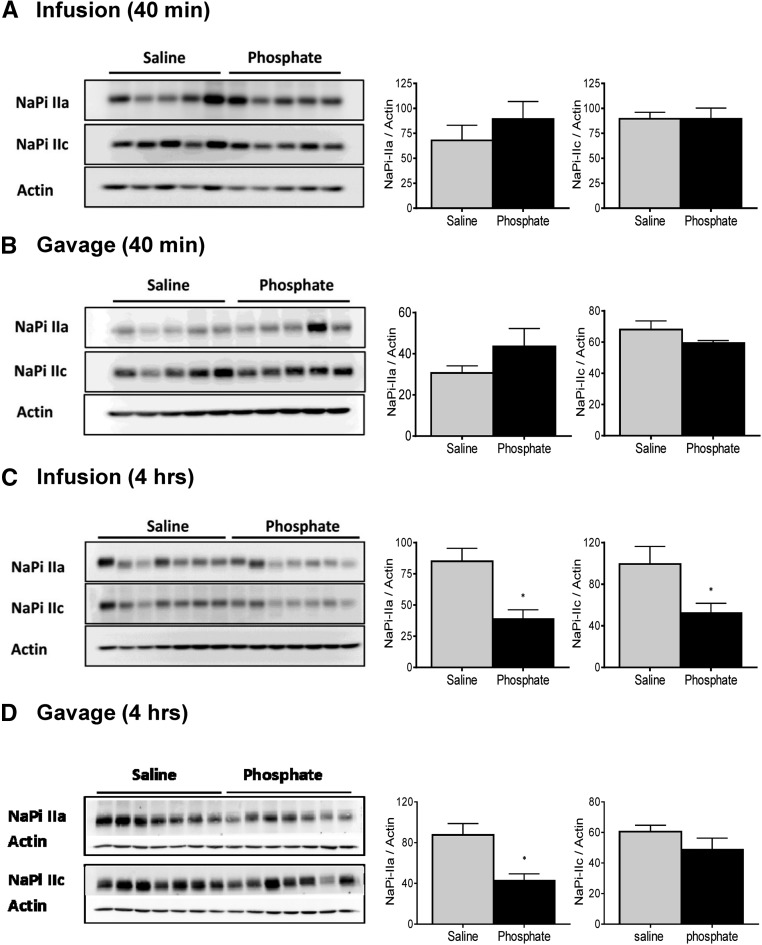
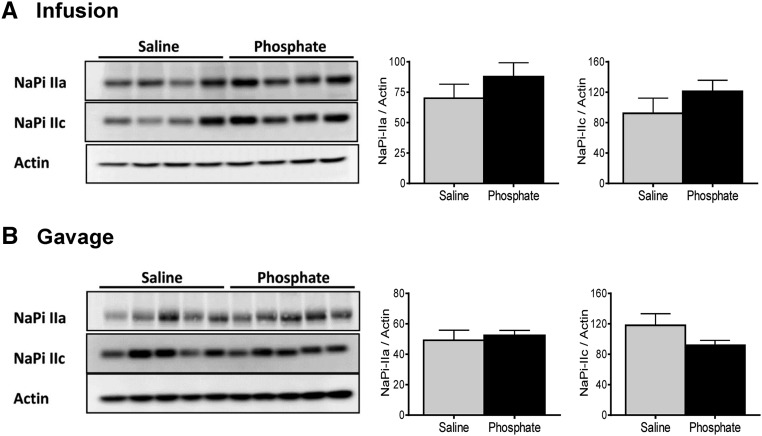
The abundance of the major renal Pi transporters NaPi-IIa and NaPi-IIc in renal BBMVs isolated 40 minutes after infusion or gavage with Pi or saline was unchanged (Figure 5, A and B). The abundance of both cotransporters was significantly reduced in kidneys collected 4 hours after infusion with 500 μmol Pi (Figure 5C), whereas the expression of NaPi-IIa but not NaPi-IIc was diminished 4 hours after intragastric loading (Figure 5D).
Figure 5.
Effect of intravenous and intragastric administration of Pi on the expression of renal NaPi cotransporters in intact rats. Rats were loaded with 500 μmol Pi or saline intravenously or orally. Kidneys were extracted 40 minutes or 4 hours postadministration, and the abundance of NaPi-IIa and NaPi-IIc in brush border membranes was determined by Western blot. Expression of cotransporters (A) 40 minutes after intravenous infusion of saline (gray bars) and Pi (black bars), (B) 40 minutes after intragastric administration of saline (gray bars) and Pi (black bars), (C) 4 hours after intravenous infusion of saline (gray bars) and Pi (black bars), and (D) 4 hours after intragastric administration of saline (gray bars) and Pi (black bars). Unpaired t test; n=5–9 per group and time point. *P<0.05 versus saline group.
PTH Is Required to Clear the Acute Phosphate Load
Because PTH increased very rapidly on Pi loading and paralleled or even preceded phosphaturia, we tested the role of PTH in the adaptive response in parathyroidectomized (PTX) rats. Infusion of 500 μmol Pi caused a rapid increase in plasma Pi in PTX rats (Figure 6A), peaking after 10 minutes and decreasing thereafter. However, whereas the levels of Pi fully normalized within 2 hours postinfusion in intact rats, Pi levels remained elevated until the end of the experiment in PTX animals (Figure 6A). Gavage of 500 μmol Pi in PTX rats induced a slow rise in plasma Pi (Figure 6A) in contrast with the lack of effect of the Pi gavage in intact animals (Figure 1A). Administration of saline to PTX rats by infusion or gavage did not alter plasma Pi (Figure 6A).
Figure 6.
Effect of intravenous and intragastric administration of Pi on renal excretion in PTX rats. PTX rats were loaded with 500 μmol Pi or saline intravenously or orally. (A) Plasma Pi, (B) urinary Pi/creatinine, (C) creatinine clearance, and (D) cumulative Pi excretion. Four profiles are shown: saline intravenous infusion (black), Pi intravenous infusion (red), saline intragastric gavage (green), and Pi intragastric gavage (blue). Data are presented as the means±SEM. ANOVA test; n=4–6 per group and time point. *P<0.05 versus time 0; **P<0.01 versus time 0.
Infusion with 500 μmol Pi induced a fast but small increase in urinary excretion of Pi in PTX rats (Figure 6B). Maximal phosphaturia was detected 10 minutes postinfusion, similar to in intact animals (Figure 1B). However, phosphaturia returned to baseline within 2 hours after infusion in PTX rats, despite elevated plasma Pi levels (Figure 6B). Moreover, gavage of Pi in PTX rats failed to elicit any significant phosphaturia (Figure 6B). Neither infusion nor gavage with saline affected urinary Pi (Figure 6B).
In PTX rats, creatinine clearance increased within 10 minutes of 500 μmol Pi infusion and rapidly normalized thereafter, whereas it was not altered with either Pi gavage or saline administration (Figure 6C).
The cumulative urinary excretion of Pi over 4 hours in PTX rats infused with 500 μmol Pi was of about 30 μmol (Figure 6D), equivalent to about 6% of the Pi load. The cumulative urinary excretion of Pi over 4 hours in PTX rats receiving Pi by gavage was about 3 μmol (Figure 6D), representing <1% of the Pi load.
The content of Pi was higher in femurs than liver and muscle in PTX animals, and no differences were found between organs extracted from saline-treated and Pi-loaded rats (Supplemental Figure 5).
Plasma total Ca2+ decreased slightly within 10 minutes on 500 μmol Pi infusion in PTX rats (Figure 7A) and remained low until the end of the experiment. In contrast, plasma total Ca2+ did not change significantly in Pi–gavaged PTX rats (Figure 7A). Administration of 150 μmol NaCl by infusion or gavage did not alter plasma Ca2+.
Figure 7.
Effect of intravenous and intragastric administration of Pi on Ca2+ plasma levels and urinary excretion in PTX rats. PTX rats were loaded with 500 μmol Pi or saline intravenously or orally. (A) Plasma Ca2+ and (B) urinary Ca2+/creatinine. Four profiles are shown: saline intravenous infusion (black), Pi intravenous infusion (red), saline intragastric gavage (green), and Pi intragastric gavage (blue). Data are presented as the means±SEM. ANOVA test; n=4–6 per group and time point. *P<0.05 versus time 0.
Urinary excretion of Ca2+ in PTX showed no significant changes after administration of Pi or saline (Figure 7B).
As expected, plasma PTH was undetectable in PTX rats under all conditions (Figure 8A). In contrast to intact rats, FGF23 was elevated in PTX animals 4 hours after oral or intravenous Pi loading (Figure 8B). The plasma concentrations of 1,25-(OH)2-vitamin D3 (Figure 8C), insulin (Figure 8D), and dopamine (Figure 8E) as well as urine dopamine (Figure 8F) remained unchanged under all conditions.
Figure 8.
Effect of intravenous and intragastric administration of Pi on hormonal levels in PTX rats. PTX rats were loaded with 500 μmol Pi or saline intravenously or orally. (A) Plasma intact PTH, (B) plasma intact FGF23, (C) plasma 1,25-(OH)2-vitamin D3, (D) plasma insulin, (E) plasma dopamine, and (F) urine dopamine. Four profiles are shown: saline intravenous infusion (black), Pi intravenous infusion (red), saline intragastric gavage (green), and Pi intragastric gavage (blue). Data are presented as the means±SEM. ANOVA test; n=4–6 per group and time point. *P<0.05 versus time 0.
PTH Downregulates Renal Pi Transporters in Response to Acute Pi Loading
Flux measurements of 32Pi and 3H-d-glucose in BBMVs from PTX rat kidneys collected 4 hours postloading were similar in samples from Pi-loaded rats and controls (Figure 9). The protein abundances of NaPi-IIa and NaPi-IIc in PTX rats were similar in the Pi-loaded and saline-treated animals 4 hours postadministration (Figure 10).
Figure 9.
Effect of intravenous and intragastric administration of Pi on Pi and glucose transport activities in renal BBMVs from PTX rats. PTX rats were loaded with 500 μmol Pi or saline intravenously or orally. Kidneys were extracted 4 hours after infusion or gavage, and Na+–dependent and –independent Pi and glucose transport activities in isolated BBMVs were measured. Pi transport was assayed in the presence or absence of the SLC34 transport inhibitor phosphonoformic acid. (A) 32P uptakes 4 hours after intravenous infusion of saline (gray bars) and Pi (black bars), (B) 32P uptakes 4 hours after intragastric administration of saline (gray bars) and Pi (black bars), and (C) 3H-d-glucose uptakes 4 hours after intravenous and intragastric administration of saline (gray bars) and Pi (black bars). Data are presented as the means±SEM. Unpaired test; n=4–6 per group and time point.
Figure 10.
Effect of intravenous and intragastric administration of Pi on the expression of renal NaPi cotransporters in PTX rats. PTX rats were loaded with 500 μmol Pi or saline intravenously or orally. Kidneys were extracted 4 hours postadministration, and the abundance of NaPi-IIa and NaPi-IIc in brush border membranes was determined by Western blot. Expression of cotransporters (A) 4 hours after intravenous infusion of saline (gray bars) and Pi (black bars) and (B) 4 hours after intragastric administration of saline (gray bars) and Pi (black bars). Unpaired t test; n=4–6 per group and time point.
Discussion
Acute and chronic changes in plasma Pi elicit adaptive responses in several hormones that regulate renal and intestinal epithelia–(re)absorbing Pi.1–3 High dietary Pi increases the phosphaturic hormones PTH, FGF23, and dopamine while decreasing the levels of 1,25-(OH)2-vitamin D3,6–7,31 resulting in reduced expression and activity of NaPi cotransporters in renal and intestinal epithelia, blunting intestinal Pi absorption, and increasing urinary excretion. However, there are conflicting data regarding the sequence of events triggered by high dietary Pi as well as the nature of the trigger itself. PTH may have a key role in the acute renal response, with other hormones coming into play only later on,23,32–34 but the presence of yet–unidentified intestinal factor(s) stimulating renal Pi excretion independent from PTH has been proposed.22 Here, we administered a Pi load to rats both intravenously (to bypass the gastrointestinal tract) and intragastrically and compared the acute responses in intact and PTX animals.
Our data show that, compared with equimolar NaCl infusions and the time point 0, the acute infusion of Pi elicited a dose-dependent response that consisted at the highest dose of (1) an immediate but transient rise in plasma Pi, (2) an early and transient increase in creatinine clearance, (3) a rapid phosphaturic response, (4) a fall in plasma total calcium, (5) a rapid and sustained phosphaturia, and (6) a reduced expression and activity of renal Pi transporters. Intragastric application of Pi caused a qualitatively similar response in the cumulative Pi excretion without a significant change in creatinine clearance and with no obvious hyperphosphatemia, a lower and delayed rise in PTH, a nonsignificant reduction in renal Pi transporter activity and lower expression of only NaPi-IIa but not NaPi-IIc, and a slower onset in phosphaturia. Infusion or gavage of NaCl had no effects.
Several points are of major interest: the onset of phosphaturia is paralleled by a rise in PTH in infused and gavaged animals and precedes changes in plasma dopamine, whereas levels of 1,25-(OH)2-vitamin D3, FGF23, insulin, and urine dopamine were not altered, suggesting an important role of PTH. Early phosphaturia (40 minutes) occurred in infused animals without obvious changes in the activity or abundance of renal Pi transporters expressed in the brush border membrane of the proximal tubule, which may be explained at least in part by a higher tubular load in the infused animals, because creatinine clearance had more than doubled and plasma Pi levels were elevated. However, we noted also a partial dissociation between the degree of phosphaturia, Pi transport activities in BBMVs, and the abundance of the NaPi-IIa and NaPi-IIc transporters as most evident in the Pi-gavaged group after 4 hours. Activity of NaPi-IIa transporters in the brush border membrane is influenced by lipid composition of the plasma membrane and in situ cleavage by klotho and possibly, regulated association with and dissociation from NHERF1 through phosphorylation of NHERF1 stimulated by PTH or dopamine.17,35–37 We did not obtain evidence for cleavage of NaPi-IIa as evident from immunoblotting, but changes in lipid composition or NHERF1 phosphorylation were not tested and may contribute to the dissociation of transport activity and NaPi-IIa abundance.
Plasma PTH rises in vivo and in vitro in response to a fall in ionized calcium or an increase in Pi concentrations. Whether the response to Pi is independent from calcium has remained unclear, because Pi retains its ability to stimulate PTH secretion, even in the absence of a measurable fall in ionized or total calcium.23–25,33,38 Along the same line, in vitro incubation of human parathyroid glands with escalating concentrations of Pi while keeping ionized calcium constant stimulated PTH secretion.24,38 However, inhibitors of calcium–stimulated receptor–mediated PTH secretion (calcimimetics) have been shown to suppress Pi–induced PTH secretion in vivo, suggesting a role of the calcium-stimulated receptor, even in the absence of changes of ionized calcium levels.25 Here, plasma total calcium decreased in parallel with the rise in PTH, allowing no clear distinction between a calcium-dependent or -independent mechanism. However, infusion of 150 μmol Pi caused a similar fall in plasma total calcium as 500 μmol Pi, but the rise in PTH was blunted and detected only 10 minutes postadministration, suggesting that Pi may stimulate PTH release synergistically or independently. The early response of PTH found in our animal model is consistent with experiments in humans and other rodent models.23,32,33
PTH is critical for the early response to Pi, independent from the route of application. In PTX rats, massive and sustained hyperphosphatemia developed with a more pronounced fall in plasma total calcium than in intact rats. There was a small and transient increase in renal Pi excretion in the Pi–infused PTX group that is most likely attributable to the combination of hyperphosphatemia and elevated GFR (as indicated by higher creatinine clearance). Phosphaturia ceased after normalization of creatinine clearance and the fall of plasma Pi below about 5 mM. The transient increase in creatinine clearance in the Pi-infused animals is independent from PTH and may involve other Pi–sensitive mechanisms. The rise in plasma Pi and/or the fall in plasma calcium may be (in)direct triggers affecting factors controlling glomerular filtration, such as vascular tone of afferent and/or efferent arterioles, where calcium channels play an important role.39 PTH is also required for the downregulation of renal Pi transporters after 4 hours, because this response was also blunted in PTX rats. Thus, our results show that PTH is required for the early response to high Pi intake.
We detected only small or no changes in FGF23, 1,25-(OH)2-vitamin D3, insulin, and dopamine. The increase in dopamine or FGF23 was found only at the latest time point and is probably not responsible for the massive phosphaturia at earlier time points. In Pi–infused intact rats, the late rise in plasma dopamine (but not in urine) may enhance PTH-induced phosphaturia. Dopamine acts via D1 receptors to downregulate NaPi-IIa in proximal tubules.7–9 The increase in FGF23 in PTX rats occurs between 50 and 240 minutes after the Pi bolus (because of the small volumes of blood that could be collected, only a few FGF23 determinations were possible). This finding suggests first that, in the absence of PTH, FGF23 levels adapt more acutely to the Pi overload and second, that systemic Pi can regulate FGF23 production and/or stability independently of PTH. Interestingly, FGF23 production by osteocytes is not directly regulated by Pi40 and instead, requires previous production of PTH and activation of protein kinase A and Wnt pathways by PTHR123,41,42
Intestinal Pi sensors and an intestine–derived phosphaturic factor had been postulated on the basis of experiments with rats infused with Pi into duodenum. This mechanism would allow for a rapid crosstalk between intestine and kidney and provide a feedforward mechanism preventing a potentially detrimental hyperphosphatemia.22 The existence of such feedforward mechanisms has been shown for potassium and salt.43–46 However, Scanni et al.23 had found, in healthy humans, that the rate of elimination and overall quantity of Pi excretion did not depend on the route of application (intravenous versus intraduodenal infusion). Consistently, our data do not provide any evidence for a role of the intestine in promoting phosphaturia. Moreover, in the absence of PTH, no phosphaturia could be elicited by intragastric Pi infusions.
The cumulative urinary elimination of the Pi bolus reached only about 50%–60% after 4 hours in intact animals, whereas normophosphatemia was achieved much faster, suggesting that a large amount of Pi had been eliminated by other routes (i.e., intestinal tract), extravasated and accumulated in tissues, or complexed in blood into a pool that is not measurable by the Fiske–Subbarow method. Scanni et al.23 showed that urinary excretion of Pi accounted for 100% of the intravenous Pi overload in humans, but full elimination required 120 hours; the authors rule out a contribution of the gastrointestinal tract in the elimination of Pi. We quantified the Pi content in femurs as well as liver and skeletal muscle. Pi content in bones is much higher than in the other two organs, and the measured values were so high that a rough estimation of the total amount of Pi stored in the skeleton (assuming a 10% contribution to body weight and a comparable composition of all bones) suggests that, even if all of the nonexcreted Pi would have been accumulated in bones, this would only result in a small change of content (approximately 0.5%), nondetectable with the Fiske–Subbarow method. Although similar estimations predicted that partial accumulation of Pi in liver and skeletal muscle could be detectable, we failed to observe any changes. Thus, other approaches should be used to identify the organs responsible for a transient accumulation of a large excess of Pi.
In summary, our data indicate that (1) normophosphatemia is rapidly re-established after intravenous and intragastric Pi loading by mechanisms largely depending on the ability of the kidneys to excrete Pi; (2) an efficient phosphaturic response requires increased levels of PTH and reduced expression of renal Pi transporters; (3) these compensatory responses are, to a major extent, similar, regardless of whether Pi bypasses the gastrointestinal tract; and (4) reduced plasma Ca2+ together with elevated Pi may trigger the secretion of PTH in intravenously loaded animals. Our findings leave two major issues unresolved, namely the identity of the compartment responsible for the rapid quenching of a large fraction of the loaded Pi and the nature of the signal that triggers the stimulation of PTH release.
Concise Methods
Animal Experimental Protocol
Male Wistar rats (Charles River Laboratories, Wilmington, MA) weighing 250–350 g were adapted to a low-Pi diet (0.1%) for 5 days. After an overnight fast in metabolic cages with free access to water, animals were anesthetized with 3% isoflurane/air and placed on a heated pad to maintain body temperature at 37°C–38°C. Rats inhaled constantly a low dose of anesthesia (1%–2% isoflurane/air) until the end of the experiment. Catheters (BPE-T 50; Instech) were placed into the femoral vein, femoral artery, and urinary bladder (for infusion of solutions and collection of blood and urine, respectively). A Ringer solution (116 mM NaCl, 1.2 mM KCl, 1 mM CaCl2, and 2.7 mM NaHCO3) containing 5% glucose was infused continuously at a rate of 3.0 ml/h until the end of the experiment. To determine baseline values, blood and urine samples were collected over a period of 30 minutes after the start of the Ringer infusion. In the infusion protocol, 1 ml either Na2HPO4/NaH2PO4 (500, 150, or 50 mM; pH 7.4) or NaCl (500 or 150 mM; pH 7.4) was infused immediately after the baseline sampling within 2–3 minutes. For gavage, 1 ml either 500 mM NaH2PO4/Na2HPO4 (pH 5) or NaCl (500 or 150 mM; pH 5) was administered directly into the stomach by using a gavage tube (FTP-15–100; Instech). Blood and urine samples were collected at different time intervals postinfusion or postgavage. At the end of sample collections (40 minutes or 4 hours), the animals were euthanized, and blood, kidneys, intestine (duodenum, jejunum, and ileum), liver, muscle, and femur were harvested. Blood samples (both from intermediate time points and at termination) were centrifuged immediately on collection, and plasma was aliquoted. Plasma and organs were store at −80°C until further used.
In addition, an identical experimental protocol to the one described above was performed in 350–450 g PTX male rats (Charles River Laboratories) receiving 1% calcium gluconate in drinking water.
All animal experiments were according to Swiss and international laws of animal protection, and all protocols were approved by the appropriate local veterinary authority (Kantonales Veterinäramt Zürich).
General Analytic Measurements
The concentration of Pi in plasma and urine was determined according to the Fiske–Subbarow method (Randox). Plasma and urinary levels of calcium were measured using a Quantichrom Calcium Kit from Bioassay System. The concentration of creatinine in plasma was enzymatically measured using a peroxidase-antiperoxidase-creatinine kit (Biomed), whereas urinary creatinine was measured according to the Jaffe method. Fractional excretion of Pi was calculated using the formula: [urine Pi × plasma creatinine]×100/[plasma Pi × urine creatinine]. The creatinine clearance was estimated from plasma and urinary creatinine concentrations and urine volume.
The concentration of glucose in plasma was measured by using Accu-Chek (Roche, Basel, Switzerland). ELISA kits were used to measure the concentrations in plasma and/or of intact PTH (Immutopic), intact FGF23 (Kainos), insulin (Crystal Chem Inc.), and dopamine (LDN). Plasma 1,25-(OH)2-vitamin D3 was determined with an RIA kit from IDS. Protein concentrations in renal brush border membranes were determined with the Bio-Rad Protein Assay (Bio-Rad, Hercules, CA).
Isolation of Renal BBMVs and Flux Measurements of 32Pi and 3H-Glucose
Kidney cortex and medulla were dissected from frozen kidneys and homogenized in a buffer containing 300 mM mannitol, 5 EGTA, and 12 Tris-HCl, pH 7.1; BBMVs were isolated according to the Mg2+ precipitation method as described in detail.47 Uptake of 32Pi and 3H-glucose was measured in three different solutions, all three containing 300 mM mannitol plus 20 mM HEPES-Tris, pH 7.4 and 125 mM NaCl, 125 mM KCl, or 125 mM NaCl. The uptake solutions contained either 0.125 μM K2HPO4/KH2PO4, pH 7.4 as cold substrate and 32Pi as a tracer or 0.125 μM d-glucose as cold substrate and 3H-d-glucose as tracer. To measure the incorporation of 32Pi/3H-glucose, 10 μl freshly prepared BBMVs were incubated for 1 minute or 2 hours with 40 μl different uptake solutions. The 1-minute time point was chosen, because 32Pi/3H-glucose uptake was in the linear phase of the maximal transport rate as determined earlier.47 After the indicated incubation time, uptakes were stopped by transferring 20 μl sample to 1 ml ice cold stop solution (100 mM mannitol, 5 mM Tris-HCl, 150 mM NaCl, 5 mM Pi, and 5 mM glucose). The resulting suspension was then spotted onto a filter and vacuum washed with 10 ml ice cold stop solution. Filters were finally transferred into plastic vials, and on addition of 3 ml scintillation medium (PerkinElmer, Waltham, MA), the retained radioactivity was measured on a β-counter (TRI-CARB 2900TR; Packard). All measurements were carried out in triplicate. The Na+-dependent uptakes were calculated by subtracting the uptake values obtained in the K+ medium from those measured in the Na+ medium (total uptake). Because phosphonoformic acid is a competitive inhibitor of SLC34 cotransporters (NaPi-IIa and NaPi-IIc), SLC34-mediated uptake was determined by subtracting the uptake values obtained in the presence of phosphonoformic acid from the Na+-dependent values. The remaining BBMVs that were not used in the uptake experiments were stored immediately at −80°C for further experiments.
Immunoblotting
The protein expression levels of NaPi-IIa and NaPi-IIc in renal brush border membranes were quantified by immunoblotting. To this end, 20 μg brush border membranes were solubilized in Laemmli buffer and separated on 10% SDS-PAGE, and then, they were transferred to polyvinylidene difluoride membranes (EMD Millipore, Billerica, MA). After blocking nonspecific binding with 5% milk powder in Tris-buffered saline containing 0.1% Tween-20 for 40 minutes, the blots were incubated overnight at 4°C with primary antibodies against NaPi-IIa (1:4000),48 NaPi-IIc (1:2500),49,50 and β-Actin (1:10,000; Sigma-Aldrich, St. Louis, MO). After washing and further blocking, blots were incubated with appropriate secondary antibodies for 2 hours at room temperature. Finally, membranes were exposed to chemiluminescent substrate for 5 minutes, and protein signals were detected on an LAS-4000 Luminescent Image Analyzer (Fujifilm, Tokyo, Japan). All of the images were quantified with Advanced Image Data Analyzer (Raytest). The expression of both cotransporters was normalized to the abundance of β-Actin.
Determination of Pi in Tissues
Tissues (liver, skeletal muscle, and femur) collected from intact and PTX rats 4 hours after infusion or gavage were dried in an oven at 70°C for 24 hours. Samples were weighed, transferred into a silica crucible, and burned to ashes in an electric furnace at 700°C for 12 hours; 1 N HCl was used to dissolve the Pi present in ashes, and after centrifugation, supernatants were collected for Pi determination by the above–mentioned Fiske–Subbarow method.
Statistical Analyses
Statistical significances were calculated by t test or one-way ANOVA (Bonferroni) as indicated. P<0.05 was considered significant. Results are presented as means±SEM.
Disclosures
The authors declare that they have no competing financial interests. N.H. and C.A.W. received financial research support from AstraZeneca Pharmaceuticals (Wilmington, DE) unrelated to this project.
Supplementary Material
Acknowledgments
The authors acknowledge the technical support by Udo Schnitzbauer as well as the Zurich Integrative Rodent Physiology Core Facility for Rodent Phenotyping.
The study was supported by a grant from the National Center for Competence in Research (NCCR Kidney.CH; to J.B. and C.A.W.).
Footnotes
Published online ahead of print. Publication date available at www.jasn.org.
This article contains supplemental material online at http://jasn.asnjournals.org/lookup/suppl/doi:10.1681/ASN.2016010082/-/DCSupplemental.
References
- 1.Wagner CA, Hernando N, Forster IC, Biber J: The SLC34 family of sodium-dependent phosphate transporters. Pflugers Arch 466: 139–153, 2014 [DOI] [PubMed] [Google Scholar]
- 2.Biber J, Hernando N, Forster I: Phosphate transporters and their function. Annu Rev Physiol 75: 535–550, 2013 [DOI] [PubMed] [Google Scholar]
- 3.Bergwitz C, Jüppner H: Regulation of phosphate homeostasis by PTH, vitamin D, and FGF23. Annu Rev Med 61: 91–104, 2010 [DOI] [PMC free article] [PubMed] [Google Scholar]
- 4.Berndt T, Kumar R: Novel mechanisms in the regulation of phosphorus homeostasis. Physiology (Bethesda) 24: 17–25, 2009 [DOI] [PMC free article] [PubMed] [Google Scholar]
- 5.Hu MC, Shiizaki K, Kuro-o M, Moe OW: Fibroblast growth factor 23 and Klotho: Physiology and pathophysiology of an endocrine network of mineral metabolism. Annu Rev Physiol 75: 503–533, 2013 [DOI] [PMC free article] [PubMed] [Google Scholar]
- 6.Martin A, David V, Quarles LD: Regulation and function of the FGF23/klotho endocrine pathways. Physiol Rev 92: 131–155, 2012 [DOI] [PMC free article] [PubMed] [Google Scholar]
- 7.Weinman EJ, Biswas R, Steplock D, Wang P, Lau YS, Desir GV, Shenolikar S: Increased renal dopamine and acute renal adaptation to a high-phosphate diet. Am J Physiol Renal Physiol 300: F1123–F1129, 2011 [DOI] [PMC free article] [PubMed] [Google Scholar]
- 8.Bacic D, Capuano P, Baum M, Zhang J, Stange G, Biber J, Kaissling B, Moe OW, Wagner CA, Murer H: Activation of dopamine D1-like receptors induces acute internalization of the renal Na+/phosphate cotransporter NaPi-IIa in mouse kidney and OK cells. Am J Physiol Renal Physiol 288: F740–F747, 2005 [DOI] [PMC free article] [PubMed] [Google Scholar]
- 9.Isaac J, Berndt TJ, Chinnow SL, Tyce GM, Dousa TP, Knox FG: Dopamine enhances the phosphaturic response to parathyroid hormone in phosphate-deprived rats. J Am Soc Nephrol 2: 1423–1429, 1992 [DOI] [PubMed] [Google Scholar]
- 10.Capuano P, Radanovic T, Wagner CA, Bacic D, Kato S, Uchiyama Y, St-Arnoud R, Murer H, Biber J: Intestinal and renal adaptation to a low-Pi diet of type II NaPi cotransporters in vitamin D receptor- and 1alphaOHase-deficient mice. Am J Physiol Cell Physiol 288: C429–C434, 2005 [DOI] [PubMed] [Google Scholar]
- 11.Marks J, Debnam ES, Unwin RJ: Phosphate homeostasis and the renal-gastrointestinal axis. Am J Physiol Renal Physiol 299: F285–F296, 2010 [DOI] [PubMed] [Google Scholar]
- 12.Marks J, Srai SK, Biber J, Murer H, Unwin RJ, Debnam ES: Intestinal phosphate absorption and the effect of vitamin D: A comparison of rats with mice. Exp Physiol 91: 531–537, 2006 [DOI] [PubMed] [Google Scholar]
- 13.Allon M, Rodriguez M, Llach F: Insulin in the acute renal adaptation to dietary phosphate restriction in the rat. Kidney Int 37: 14–20, 1990 [DOI] [PubMed] [Google Scholar]
- 14.Torres PA, De Brauwere DP: Three feedback loops precisely regulating serum phosphate concentration. Kidney Int 80: 443–445, 2011 [DOI] [PubMed] [Google Scholar]
- 15.Blaine J, Chonchol M, Levi M: Renal control of calcium, phosphate, and magnesium homeostasis. Clin J Am Soc Nephrol 10: 1257–1272, 2015 [DOI] [PMC free article] [PubMed] [Google Scholar]
- 16.Rowe PS: A unified model for bone-renal mineral and energy metabolism. Curr Opin Pharmacol 22: 64–71, 2015 [DOI] [PMC free article] [PubMed] [Google Scholar]
- 17.Hu MC, Shi M, Zhang J, Pastor J, Nakatani T, Lanske B, Razzaque MS, Rosenblatt KP, Baum MG, Kuro-o M, Moe OW: Klotho: A novel phosphaturic substance acting as an autocrine enzyme in the renal proximal tubule. FASEB J 24: 3438–3450, 2010 [DOI] [PMC free article] [PubMed] [Google Scholar]
- 18.Chang Q, Hoefs S, van der Kemp AW, Topala CN, Bindels RJ, Hoenderop JG: The beta-glucuronidase klotho hydrolyzes and activates the TRPV5 channel. Science 310: 490–493, 2005 [DOI] [PubMed] [Google Scholar]
- 19.Berndt TJ, Bielesz B, Craig TA, Tebben PJ, Bacic D, Wagner CA, O’Brien S, Schiavi S, Biber J, Murer H, Kumar R: Secreted frizzled-related protein-4 reduces sodium-phosphate co-transporter abundance and activity in proximal tubule cells. Pflugers Arch 451: 579–587, 2006 [DOI] [PubMed] [Google Scholar]
- 20.Marks J, Churchill LJ, Debnam ES, Unwin RJ: Matrix extracellular phosphoglycoprotein inhibits phosphate transport. J Am Soc Nephrol 19: 2313–2320, 2008 [DOI] [PMC free article] [PubMed] [Google Scholar]
- 21.David V, Martin A, Hedge AM, Rowe PS: Matrix extracellular phosphoglycoprotein (MEPE) is a new bone renal hormone and vascularization modulator. Endocrinology 150: 4012–4023, 2009 [DOI] [PMC free article] [PubMed] [Google Scholar]
- 22.Berndt T, Thomas LF, Craig TA, Sommer S, Li X, Bergstralh EJ, Kumar R: Evidence for a signaling axis by which intestinal phosphate rapidly modulates renal phosphate reabsorption. Proc Natl Acad Sci U S A 104: 11085–11090, 2007 [DOI] [PMC free article] [PubMed] [Google Scholar]
- 23.Scanni R, vonRotz M, Jehle S, Hulter HN, Krapf R: The human response to acute enteral and parenteral phosphate loads. J Am Soc Nephrol 25: 2730–2739, 2014 [DOI] [PMC free article] [PubMed] [Google Scholar]
- 24.Almaden Y, Hernandez A, Torregrosa V, Canalejo A, Sabate L, Fernandez Cruz L, Campistol JM, Torres A, Rodriguez M: High phosphate level directly stimulates parathyroid hormone secretion and synthesis by human parathyroid tissue in vitro. J Am Soc Nephrol 9: 1845–1852, 1998 [DOI] [PubMed] [Google Scholar]
- 25.Almaden Y, Rodriguez-Ortiz ME, Canalejo A, Cañadillas S, Canalejo R, Martin D, Aguilera-Tejero E, Rodríguez M: Calcimimetics normalize the phosphate-induced stimulation of PTH secretion in vivo and in vitro. J Nephrol 22: 281–288, 2009 [PubMed] [Google Scholar]
- 26.Hansch E, Forgo J, Murer H, Biber J: Role of microtubules in the adaptive response to low phosphate of Na/Pi cotransport in opossum kidney cells. Pflugers Arch 422: 516–522, 1993 [DOI] [PubMed] [Google Scholar]
- 27.Reshkin SJ, Forgo J, Biber J, Murer H: Functional asymmetry of phosphate transport and its regulation in opossum kidney cells: Phosphate “adaptation.” Pflugers Arch 419: 256–262, 1991 [DOI] [PubMed] [Google Scholar]
- 28.Camalier CE, Yi M, Yu LR, Hood BL, Conrads KA, Lee YJ, Lin Y, Garneys LM, Bouloux GF, Young MR, Veenstra TD, Stephens RM, Colburn NH, Conrads TP, Beck GR Jr.: An integrated understanding of the physiological response to elevated extracellular phosphate. J Cell Physiol 228: 1536–1550, 2013 [DOI] [PMC free article] [PubMed] [Google Scholar]
- 29.Khoshniat S, Bourgine A, Julien M, Weiss P, Guicheux J, Beck L: The emergence of phosphate as a specific signaling molecule in bone and other cell types in mammals. Cell Mol Life Sci 68: 205–218, 2011 [DOI] [PMC free article] [PubMed] [Google Scholar]
- 30.Michigami T: Extracellular phosphate as a signaling molecule. Contrib Nephrol 180: 14–24, 2013 [DOI] [PubMed] [Google Scholar]
- 31.Cuche JL, Marchand GR, Greger RF, Lang RC, Knox FG: Phosphaturic effect of dopamine in dogs. Possible role of intrarenally produced dopamine in phosphate regulation. J Clin Invest 58: 71–76, 1976 [DOI] [PMC free article] [PubMed] [Google Scholar]
- 32.Nishida Y, Taketani Y, Yamanaka-Okumura H, Imamura F, Taniguchi A, Sato T, Shuto E, Nashiki K, Arai H, Yamamoto H, Takeda E: Acute effect of oral phosphate loading on serum fibroblast growth factor 23 levels in healthy men. Kidney Int 70: 2141–2147, 2006 [DOI] [PubMed] [Google Scholar]
- 33.Martin DR, Ritter CS, Slatopolsky E, Brown AJ: Acute regulation of parathyroid hormone by dietary phosphate. Am J Physiol Endocrinol Metab 289: E729–E734, 2005 [DOI] [PubMed] [Google Scholar]
- 34.Bourgeois S, Capuano P, Stange G, Mühlemann R, Murer H, Biber J, Wagner CA: The phosphate transporter NaPi-IIa determines the rapid renal adaptation to dietary phosphate intake in mouse irrespective of persistently high FGF23 levels. Pflugers Arch 465: 1557–1572, 2013 [DOI] [PubMed] [Google Scholar]
- 35.Zajicek HK, Wang H, Puttaparthi K, Halaihel N, Markovich D, Shayman J, Béliveau R, Wilson P, Rogers T, Levi M: Glycosphingolipids modulate renal phosphate transport in potassium deficiency. Kidney Int 60: 694–704, 2001 [DOI] [PubMed] [Google Scholar]
- 36.Weinman EJ, Biswas R, Steplock D, Douglass TS, Cunningham R, Shenolikar S: Sodium-hydrogen exchanger regulatory factor 1 (NHERF-1) transduces signals that mediate dopamine inhibition of sodium-phosphate co-transport in mouse kidney. J Biol Chem 285: 13454–13460, 2010 [DOI] [PMC free article] [PubMed] [Google Scholar]
- 37.Weinman EJ, Biswas RS, Peng G, Shen L, Turner CL, e X, Steplock D, Shenolikar S, Cunningham R: Parathyroid hormone inhibits renal phosphate transport by phosphorylation of serine 77 of sodium-hydrogen exchanger regulatory factor-1. J Clin Invest 117: 3412–3420, 2007 [DOI] [PMC free article] [PubMed] [Google Scholar] [Retracted]
- 38.Almaden Y, Canalejo A, Hernandez A, Ballesteros E, Garcia-Navarro S, Torres A, Rodriguez M: Direct effect of phosphorus on PTH secretion from whole rat parathyroid glands in vitro. J Bone Miner Res 11: 970–976, 1996 [DOI] [PubMed] [Google Scholar]
- 39.Hansen PB: Functional and pharmacological consequences of the distribution of voltage-gated calcium channels in the renal blood vessels. Acta Physiol (Oxf) 207: 690–699, 2013 [DOI] [PubMed] [Google Scholar]
- 40.Liu S, Zhou J, Tang W, Jiang X, Rowe DW, Quarles LD: Pathogenic role of Fgf23 in Hyp mice. Am J Physiol Endocrinol Metab 291: E38–E49, 2006 [DOI] [PubMed] [Google Scholar]
- 41.Lavi-Moshayoff V, Wasserman G, Meir T, Silver J, Naveh-Many T: PTH increases FGF23 gene expression and mediates the high-FGF23 levels of experimental kidney failure: A bone parathyroid feedback loop. Am J Physiol Renal Physiol 299: F882–F889, 2010 [DOI] [PubMed] [Google Scholar]
- 42.Rhee Y, Allen MR, Condon K, Lezcano V, Ronda AC, Galli C, Olivos N, Passeri G, O'Brien CA, Bivi N, Plotkin LI, Bellido T: PTH receptor signaling in osteocytes governs periosteal bone formation and intracortical remodeling. J Bone Miner Res 26: 1035–1046, 2011 [DOI] [PMC free article] [PubMed]
- 43.Youn JH, McDonough AA: Recent advances in understanding integrative control of potassium homeostasis. Annu Rev Physiol 71: 381–401, 2009 [DOI] [PMC free article] [PubMed] [Google Scholar]
- 44.Preston RA, Afshartous D, Rodco R, Alonso AB, Garg D: Evidence for a gastrointestinal-renal kaliuretic signaling axis in humans. Kidney Int 88: 1383–1391, 2015 [DOI] [PubMed] [Google Scholar]
- 45.Mueller T, Dieplinger B: The guanylin peptide family and the proposed gastrointestinal-renal natriuretic signaling axis. Kidney Int 82: 1253–1255, 2012 [DOI] [PubMed] [Google Scholar]
- 46.Michell AR, Debnam ES, Unwin RJ: Regulation of renal function by the gastrointestinal tract: Potential role of gut-derived peptides and hormones. Annu Rev Physiol 70: 379–403, 2008 [DOI] [PubMed] [Google Scholar]
- 47.Biber J, Stieger B, Stange G, Murer H: Isolation of renal proximal tubular brush-border membranes. Nat Protoc 2: 1356–1359, 2007 [DOI] [PubMed] [Google Scholar]
- 48.Custer M, Lötscher M, Biber J, Murer H, Kaissling B: Expression of Na-P(i) cotransport in rat kidney: Localization by RT-PCR and immunohistochemistry. Am J Physiol 266: F767–F774, 1994 [DOI] [PubMed] [Google Scholar]
- 49.Nowik M, Picard N, Stange G, Capuano P, Tenenhouse HS, Biber J, Murer H, Wagner CA: Renal phosphaturia during metabolic acidosis revisited: Molecular mechanisms for decreased renal phosphate reabsorption. Pflugers Arch 457: 539–549, 2008 [DOI] [PubMed] [Google Scholar]
- 50.Hernando N, Myakala K, Simona F, Knöpfel T, Thomas L, Murer H, Wagner CA, Biber J: Intestinal depletion of NaPi-IIb/Slc34a2 in mice: Renal and hormonal adaptation. J Bone Miner Res 30: 1925–1937, 2015 [DOI] [PubMed] [Google Scholar]
Associated Data
This section collects any data citations, data availability statements, or supplementary materials included in this article.


