Abstract
Kidneys contribute to glucose homeostasis by reabsorbing filtered glucose in the proximal tubules via sodium-glucose cotransporters (SGLTs). Reabsorption is primarily handled by SGLT2, and SGLT2-specific inhibitors, including dapagliflozin, canagliflozin, and empagliflozin, increase glucose excretion and lower blood glucose levels. To resolve unanswered questions about these inhibitors, we developed a novel approach to map the distribution of functional SGLT2 proteins in rodents using positron emission tomography with 4-[18F]fluoro-dapagliflozin (F-Dapa). We detected prominent binding of intravenously injected F-Dapa in the kidney cortexes of rats and wild-type and Sglt1-knockout mice but not Sglt2-knockout mice, and injection of SGLT2 inhibitors prevented this binding. Furthermore, imaging revealed only low levels of F-Dapa in the urinary bladder, even after displacement of kidney binding with dapagliflozin. Microscopic ex vitro autoradiography of kidney showed F-Dapa binding to the apical surface of early proximal tubules. Notably, in vivo imaging did not show measureable specific binding of F-Dapa in heart, muscle, salivary glands, liver, or brain. We propose that F-Dapa is freely filtered by the kidney, binds to SGLT2 in the apical membranes of the early proximal tubule, and is subsequently reabsorbed into blood. The high density of functional SGLT2 transporters detected in the apical membrane of the proximal tubule but not detected in other organs likely accounts for the high kidney specificity of SGLT2 inhibitors. Overall, these data are consistent with data from clinical studies on SGLT2 inhibitors and provide a rationale for the mode of action of these drugs.
Keywords: SGLT2, Dapagliflozin, diabetes mellitus, microPET
Under physiologic conditions, 99% of the glucose filtered by the kidney is reabsorbed by the renal tubules. The bulk of the reabsorption occurs in the early proximal tubule, and it is mediated by Na+-dependent glucose transporter 2 (SGLT2). Remainder is reabsorbed in the distal part of the proximal tubules by SGLT1.1 To improve the understanding of SGLT2 and SGLT1 roles in glucose reabsorption, knockout (KO) mice models have been generated. Deletion of SGLT1 (Sglt1−/−)2 resulted only in a slight increase in renal glucose excretion. Deletion of SGLT2 (Sglt2−/−)3 resulted in profound glycosuria; however, the data suggested that SGLT1 can partially compensate for SGLT2 loss. Double KO (Sglt1−/−Sglt2−/−)4 showed complete urinary excretion of the filtered load, which is in agreement with a role of SGLT1 in glucose reabsorption.
Imaging using positron emission tomography (PET) and positron–emitting imaging probes is a technique to investigate in vivo biochemical processes in rodents and humans. 2-Deoxy-2-[18F]-fluoro-d-glucose has been extensively used to study glucose metabolism in health and disease.5 However, 2-deoxy-2-[18F]-fluoro-d-glucose is only a substrate for facilitative GLUT transporters and not for SGLTs.5,6 In contrast, we have shown that α-methyl-4-[18F]-fluoro-4-deoxy-d-glucopyranoside (Me-4FDG) is a substrate for SGLTs and not GLUT1 and GLUT2,6 thus being a suitable tracer to evaluate SGLT contribution to regional glucose metabolism. We have synthesized a radiofluorinated tracer 4-[18F]fluoro-dapagliflozin (F-Dapa) that binds specifically to SGLT2 transporters. Dapagliflozin belongs to a new class of drugs that selectively inhibits SGLT2 in the renal proximal tubule, developed with the aim of lowering plasma glucose levels in patients with diabetes.7,8
We characterized in vivo functional expression of SGLT2 transporters via quantitative microPET with F-Dapa in rodents. Our conclusions are that SGLT2 is only functionally expressed at a high density in the apical membrane of the early proximal tubules in the kidney cortex and that, after filtration, SGLT2 inhibitors are reabsorbed by the kidney and excreted by the liver into bile.
Results
Inhibition of SGLT Activity Causes Renal Me-4FDG Excretion
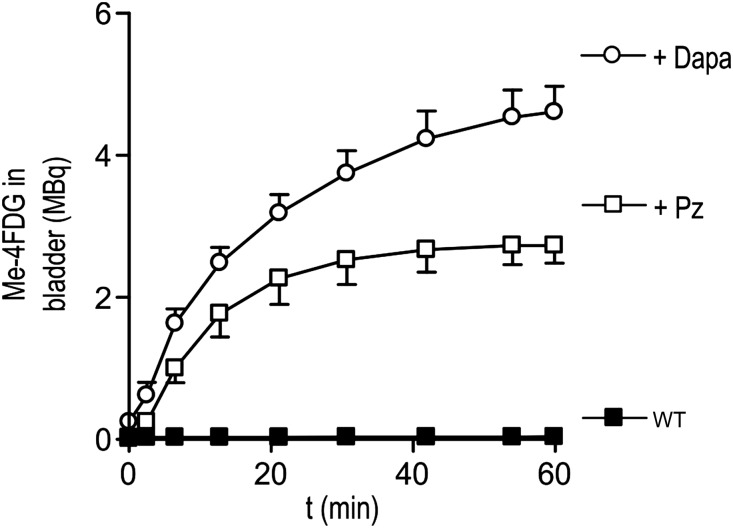
We have previously shown6,9,10 that Me-4FDG in combination with microPET is a useful tool to study in vivo functional SGLT activity. To confirm that dapagliflozin specifically inhibited SGLT2, we measured the excretion of Me-4FDG into the urinary bladder of wild-type (WT) mice with or without injection of SGLT inhibitors. We compared two inhibitors: phlorizin, a blocker of all SGLTs, and dapagliflozin, a specific SGLT2 inhibitor.11,12 In WT animals (Figure 1), we only detected negligible amounts of Me-4FDG in the bladder (60 minutes after injection, <1% of the total injected dose [ID]; 0.038±0.017 MBq). Intravenous injection of phlorizin (10 mg/kg) (Figure 1) resulted in Me-4FDG excretion in the bladder. The time course of tracer appearance in the bladder showed a sigmoidal shape and reached saturation after 30 minutes (2.7±0.2 MBq or 35% ID after 60 minutes).
Figure 1.
Total Me-4FDG in the bladder. Time course of Me-4FDG excretion into the bladder of WT mice in control condition (black squares) and after injection of 10 mg/kg phlorizin (Pz; white squares) or 1 mg/kg dapagliflozin (Dapa; white circles) at time 0. The ID was approximately 7 MBq. Points are means±SEM for three mice.
Injection of 1 mg/kg dapagliflozin resulted in high Me-4FDG excretion. As for phlorizin, the time dependence was sigmoidal, and saturation was reached after 50 minutes. The total amount of Me-4FDG in the urinary bladder after 60 minutes was 4.6±0.3 MBq or 45% of the ID (Figure 1). In both cases, the 1- to 2-minute delay in Me-4FDG in reaching the bladder is caused by the transit time between the proximal tubule and the bladder.
SGLT2 Expression
To evaluate the expression of SGLT2 using PET imaging, we took advantage of the development of dapagliflozin.13
We first synthesized and tested the potency of fluoro-dapagliflozin (in which the 4-OH group in the glucose ring is substituted with a fluorine atom) (Figure 2) in HEK293T cells expressing SGLT1 or SGLT2.12 Fluoro-dapagliflozin has the same affinities for hSGLT2 and hSGLT1 as dapagliflozin (Ki values of 6.0 and 350 nM). On the basis of these results, we synthesized F-Dapa.
Figure 2.
Chemical structure of SGLT2-specific inhibitors: dapagliflozin and fluoro-dapagliflozin. For F-Dapa, F is substituted with the radioactive isotope 18F.
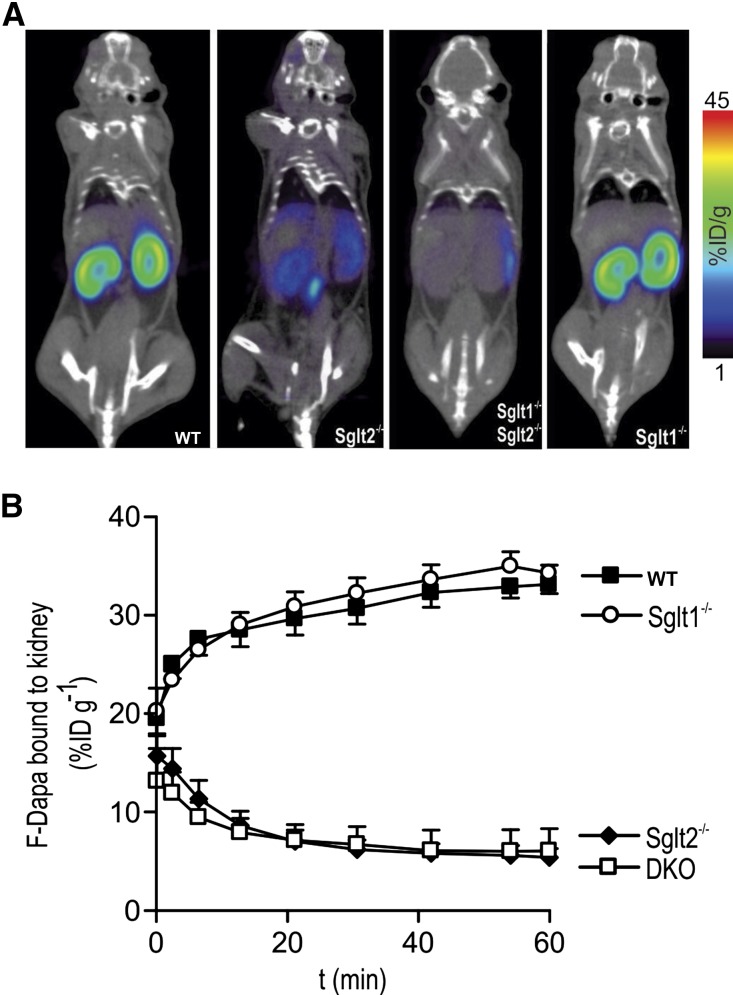
We analyzed the distribution of F-Dapa in WT, Sglt1−/−, Sglt2−/−, and Sglt1−/−Sglt2−/− mice. Figure 3A shows the distribution of F-Dapa in mice 1 hour after intravenous injection: the tracer was found mainly in the kidney of WT and Sglt1−/− mice, but it was absent from the kidney in Sglt2−/− and double Sglt1−/−Sglt2−/− mice. In Figure 3B, the amount of F-Dapa in the kidney is plotted as a function of time after intravenous injection. After the rapid distribution and washout of F-Dapa in the vascular tree (not shown), the tracer started to accumulate in the kidneys of WT and Sglt1−/− mice and approached steady states of 33%±1% and 34%±2%, respectively, of the injected dose per gram tissue (ID/g) within 60 minutes. In the Sglt2−/− mice, both single and double KOs, we observed the initial distribution of F-Dapa through the vascular tree (not shown) followed by a slow washout to steady states of 7.3%±0.6% and 6.0%±0.5% ID/g, respectively (i.e., fivefold lower than that obtained for the WT and Sglt1−/− mice). The time constant of specific F-Dapa binding, approximately 10 minutes, was obtained by subtracting the binding measured at each time point in Sglt2−/− mice from the one measured in WT and Sglt1−/−.
Figure 3.
F-Dapa binds to the kidney. (A) Two hundred milliCuries F-Dapa tracer was administered by tail vein injection into anesthetized WT, Sglt2−/−, Sglt1−/−, and Sglt1−/−Sglt2−/− mice, and the distribution of the tracer was followed for 60 minutes by microPET imaging. Slices of representative microPET/CT scans are shown. (B) Time course of F-Dapa binding to the kidneys of WT (black squares), Sglt1−/− (white circles), Sglt2−/− (black diamonds), and Sglt1−/−Sglt2−/− (DKO, white squares) mice. Data are the means±SEM; n=3, 4, 6, and 4 mice, respectively.
To explore the specificity of F-Dapa for SGLT2, we performed studies on rats: the advantage is that we can continuously monitor blood levels in the larger animal but with the disadvantages that (1) SGLT KOs are not available and (2) it is not yet possible with existing scanners to continuously image the whole animal.
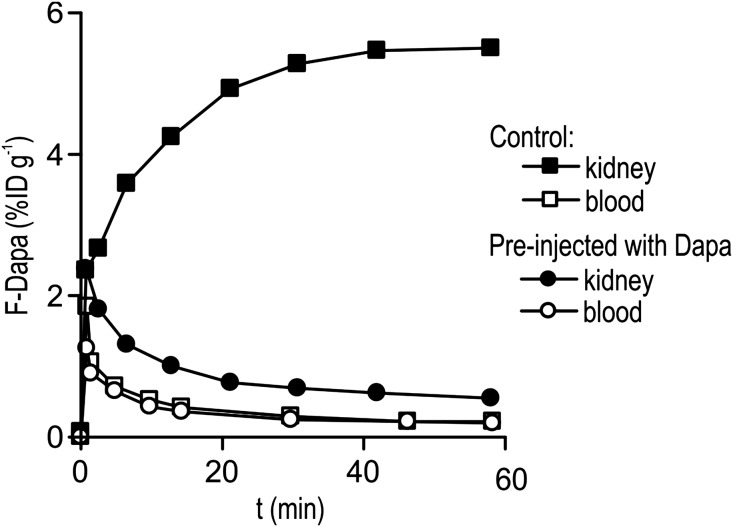
As for WT mice, F-Dapa binds specifically to the kidneys in a time-dependent manner, reaching a steady state in 30 minutes (Figure 4). At 60 minutes, the percentage of ID in the left kidney was 5.5% ID/g. Analysis of the blood samples showed that, after the initial phase where the tracer was distributed in the vascular tree, F-Dapa activity dropped to negligible levels (0.35% ID/g) (Figure 4).
Figure 4.
Time course of F-Dapa binding to the left kidney (black symbols) and in the blood (white symbols) of a control rat and a rat preinjected with 1 mg/kg dapagliflozin (Dapa).
To confirm the specificity of F-Dapa binding in rats, we performed competition experiments. In a first set, dapagliflozin was injected 1 hour before F-Dapa, and microPET images were collected. Dapagliflozin preinjection prevents F-Dapa binding (Figure 4). At 60 minutes, activity was reduced to 0.55% ID/g (close to blood level), corresponding to a 90% decrease in F-Dapa binding. There was no change in the activity of F-Dapa in blood (Figure 4). As for mice, the time constant for the specific binding was approximately 11 minutes obtained by subtracting the F-Dapa binding measured in the presence and absence of excess dapagliflozin (data not shown).
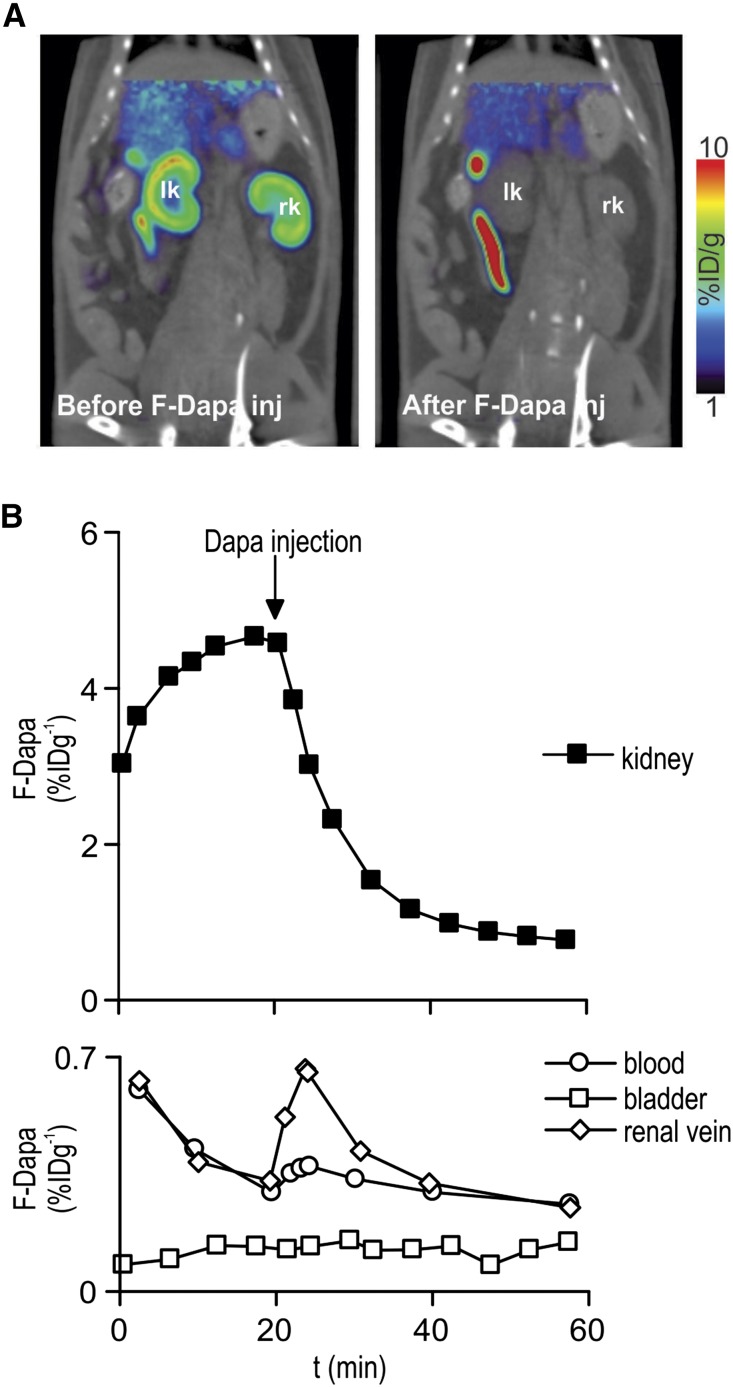
In a second set of experiments, a bolus of cold dapagliflozin (or phlorizin) was injected 20 minutes after F-Dapa. Dapagliflozin (and phlorizin; not shown) caused a rapid displacement of F-Dapa to a new steady state close to the activity in plasma (Figure 5B). This is reflected in the F-Dapa microPET images of the kidney (Figure 5A). Supplemental Movie 1 shows F-Dapa binding during the course of the whole microPET experiment. After dapagliflozin injection, there was rapid displacement of the tracer from the kidneys; none appeared in the urinary bladder or renal pelvis, but its conjugates appeared in the gastrointestinal tract.
Figure 5.
F-Dapa binding is competed by cold dapagliflozin (Dapa). (A) One milliCurie F-Dapa tracer was administered by tail vein injection into anesthetized rats, and the distribution of the tracer was followed for 60 minutes by microPET imaging scan. Slices of representative microPET/CT scans are shown. In Supplemental Movie 1, the time course of the whole microPET experiment is shown. (B) Time course of F-Dapa binding to the left kidney of a rat (upper panel). The injection of 1 mg/kg Dapa at 20 minutes caused the quick displacement of bound F-Dapa. F-Dapa in the bladder (white squares), renal vein (white diamonds), and femoral artery blood (white circles) of the same animal in A (bottom panel). F-Dapa does not accumulate in the bladder, whereas in the renal vein and blood, there is a transient increase in tracer starting right after Dapa injection. The effect was not observed in rats injected with saline solution (data not shown).
On the same rat, we also determined F-Dapa in the urinary bladder and blood (femoral artery and the renal vein) throughout the experiment. As shown in Figure 5B, lower panel, the amount of F-Dapa in the bladder was negligible before and after displacement with cold dapagliflozin (compare with Figure 5A), whereas we observed that the F-Dapa in blood and renal vein transiently increased after dapagliflozin injection.
Microscopic Location of F-Dapa
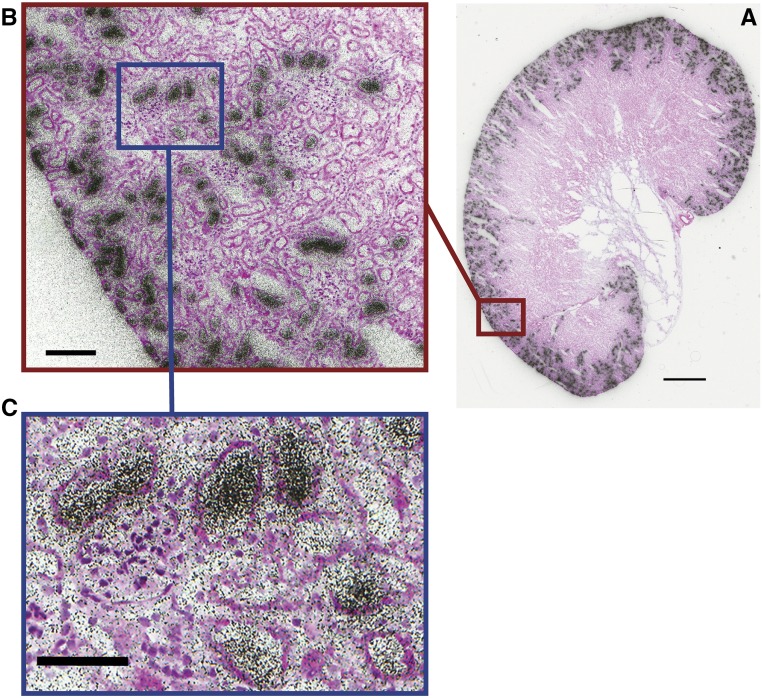
MicroPET studies show that F-Dapa binds specifically to SGLT2 in the kidney cortex. F-Dapa binding is displaced by excess cold dapagliflozin and markedly reduced in Sglt2−/− and Sglt1−/−Sglt2−/− mice but not in Sglt1−/− mice. Given that fluoro-dapagliflozin is a high–affinity, selective inhibitor of SGLT2 (Ki of 5 versus 330 nM for SGLT1) with a slow dissociation rate (toff>>300 versus 2 seconds for SGLT1),12 we reasoned that microscopic distribution could be visualized using autoradiography. Figure 6 shows the grain distribution over a 5-μm section of whole kidney, an enlarged section of the kidney cortex, and a higher magnification view of tubules surrounding a glomerulus. The high grain density over the outer cortex was eightfold higher than in the inner medulla. There was a lower density over the outer stripe of the medulla, and there were a few individual projections into the medulla inner stripe. At higher magnification, a high grain density was apparent in some tubules surrounding glomeruli (163±5/500 μm2) compared with others (41±2/500 μm2). The density over glomeruli in the outer cortex was significantly higher than in the background (70±2/500 μm2). The distribution of F-Dapa grains over the mouse kidney closely mimics the distribution SGLT2 gene expression in rat kidney14 and SGLT2 antibody binding to mouse, rat, and human kidneys.9,15,16 There is no significant SGLT2 expression in these kidney glomeruli.
Figure 6.
Ex vivo microautoradiography and H&E staining of a mouse kidney injected with 4 mCi F-Dapa. (A) Aligned autoradiogram and H&E image of the whole mouse kidney. Scale bar, 1 mm. (B) F-Dapa binding to a subset of cortical tubules. Scale bar, 100 μm. (C) F-Dapa binding to the tubules surrounding a glomerulus. The distribution of grain intensity over the kidney slice was determined using ImageJ software by placing a 25-μm diameter circle over 20 representative glomeruli and tubules in the cortex and outer and inner stripes of the medulla. Scale bar, 100 μm.
Metabolites of F-Dapa
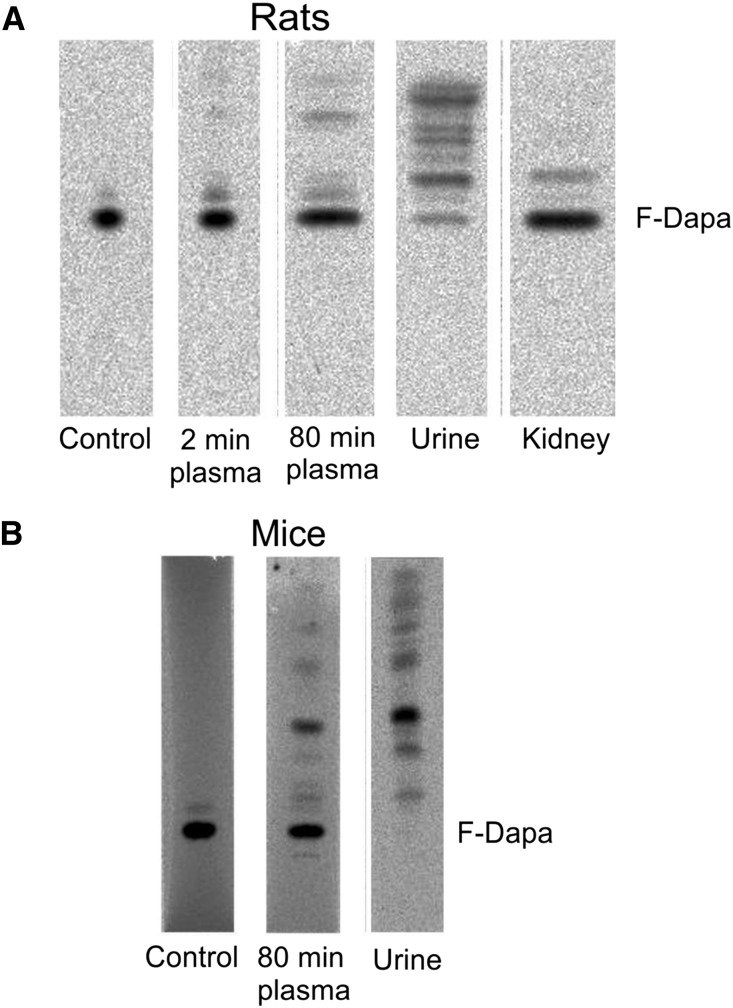
We monitored F-Dapa and its metabolites in plasma and urine by radio thin–layer chromatography (radioTLC) (Figure 7). In rats, F-Dapa showed only limited peripheral metabolism, with 98% and 80% of the activity identified as the parent molecule at 2 and 80 minutes after intravenous injection, respectively. A higher rate of peripheral metabolism was observed in mice, because only 51% of the activity in plasma was the parent molecule at 80 minutes. In rat and mouse urine collected after 80 minutes, F-Dapa was 7% and 0% of the total activity injected. The identity of the 18F metabolites in plasma and urine has not yet been determined, but the major band in mouse plasma and urine may be F-dapagliflozin-3-O-glucuronide, the major metabolite found in human plasma and urine.17 Finally, 97% of the activity extracted from rat kidney was F-Dapa.
Figure 7.
F-Dapa metabolism. (A) Analyses of radioactive sample composition (parent F-Dapa and metabolites) in plasma (collected at 2 and 80 minutes after intravenous injection of the tracer), urine, and kidney of rats were performed by radioTLC. Samples were run on C18 TLC plates (tetrahydrofuran:methanol:water; 2:2:1). (B) The presence of parent F-Dapa and metabolites was determined by radioTLC analysis in plasma (collected at 80 minutes after intravenous injection of the tracer) and urine of WT mice. Samples were run on C18 TLC plates (tetrahydrofuran:methanol:water; 1:1:2).
Organ Specificity of F-Dapa Binding
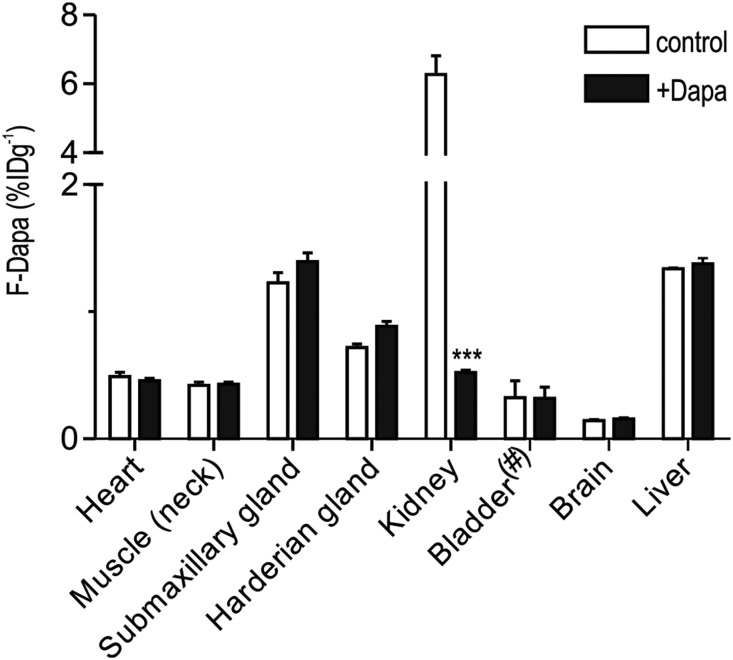
MicroPET images of mice and rats show the specific binding of F-Dapa to the kidney cortex and little to no binding in other organs (Figures 3A and 4). A summary of the distribution of the steady–state F-Dapa binding throughout the rat in the presence and absence of excess dapagliflozin is shown in Figure 8. The specific binding of F-Dapa to the whole kidney was sixfold higher than the nonspecific binding, and within the limit of sensitivity, no displaceable binding was observed in heart, skeletal muscle, brain, liver, or salivary gland. This shows that density of functional SGLT2 protein in the plasma membranes of extrarenal organs is low relative that in the kidney, and this is consistent with previous findings that SGLT2 immunoreactive protein was absent from extrarenal organs in the mouse.15 The level of nonspecific binding was comparable in all organs, except for the significantly lower level in brain, which is taken as the lack of F-Dapa permeation across the blood-brain barrier. We also note that displacement of F-Dapa binding to the rat kidney by dapagliflozin was not accompanied by an increase in activity in the urinary bladder.
Figure 8.
F-Dapa binding to rat organs. F-Dapa binding to different organs in control condition (white bars) or after competition with cold dapagliflozin (Dapa; black bars). Three-dimensional ROIs were drawn over each organ, and the data are presented as percentage ID/g with the exception of the bladder (#), for which values are presented as percentage ID in the total organ volume. Note that, for F-Dapa, the 6% ID/g value for the whole kidney grossly underestimates the density of SGLT2 in the apical membrane of the early proximal tubule (Figure 5). Bars are means±SEM. ***P≤0.001, significantly different from the control values.
Discussion
Proximal tubules play an important role in glucose homeostasis by salvaging glucose that would otherwise be excreted into the urine. In humans, approximately 180 g glucose is reabsorbed each day by two transporters in the apical membrane of the proximal kidney tubule: SGLT2 in the early proximal tubule plays a dominant role, whereas SGLT1 in the late proximal provides a substantial reserve capacity.2–4 This is important, because the specific SGLT2 inhibitors used to treat patients with type 2 diabetes only block approximately 50% of the total glucose reabsorption.7
Previous experiments6 have shown that Me-4FDG is a specific substrate for SGLTs that can be used to investigate renal glucose transport dynamics by microPET imaging. In WT mice, Me-4FDG is not excreted into the urinary bladder, but in Sglt1−/− and Sglt2−/− mice, it is excreted into the urinary bladder. The role of SGLTs in tubular reabsorption is confirmed here, where the nonspecific and specific SGLT2 inhibitors, phlorizin and dapagliflozin, increased Me-4FDG excretion into the bladder (Figure 1).
The goal was to use PET imaging and a new dapagliflozin radioligand to follow the distribution of the SGLT2 inhibitor in a single animal in real time and determine the location of SGLT2 proteins on the extracellular surface of cells throughout the body. Given the spatial resolution of PET imaging, 3 mm3, we then mapped the cellular location of SGLT2 in the kidney by ex vivo autroradiography. Our results provide novel insights into the in vivo physiology and pharmacology of an SGLT2 drug used to treat patients with diabetes.
F-Dapa as a Specific Ligand to Study SGLT2 Distribution In Vivo
Our strategy was to develop an 18F–labeled PET ligand starting from the high–affinity, highly selective SGLT2 inhibitor dapagliflozin.13 We confirmed the specificity of F-Dapa binding to the kidney in vivo using two approaches: (1) measurement of F-Dapa binding in WT and Sglt−/− mice and (2) competition experiments with excess dapagliflozin. Our results showed that F-Dapa binds to the kidneys of WT and Sglt1−/− mice but not to those of Sglt2−/− and Sglt1−/−Sglt2−/− mice (Figure 3). This confirmed our in vitro experiments showing that fluoro-dapagliflozin binds selectively to SGLT2 over SGLT1.12 Cold dapagliflozin (and phlorizin) also competed with and displaced F-Dapa binding to SGLT2 in the renal cortex, reducing it to the level detected in plasma (Figures 4 and 5B). This together with our radioTLC analysis clearly show that F-Dapa is a valid radioligand to detect SGLT2 in vivo.
The spatial resolution of microPET imaging, 3 mm, does not allow the determination of the cellular binding of F-Dapa. To solve this, we turned to ex vivo microautoradiography (Figure 6). The rationale was that F-Dapa is a high–affinity (5 nM), specific ligand for SGLT2 with a slow off rate (>300 s)12. F-Dapa autoradiographic images of kidney slices show that F-Dapa is bound to the kidney with a pattern closely resembling the in situ hybridization of SGLT2 mRNA in the rat kidney14 and SGLT2 antibody binding.9,16 Higher magnification shows that F-Dapa silver grains are concentrated in tubules in the outer cortex and that at the highest magnification silver grains are concentrated in some but not all of the tubule sections close to glomeruli (Figure 6C). These results suggest that F-Dapa is filtered at the glomerulus and binds to the apical membrane of early proximal tubules. This is consistent with (1) the free glomerular filtration of the nonspecific SGLT inhibitor phlorizin, the phlorizin inhibition of glucose reabsorption, and the displacement of [3H] phlorizin binding by excess cold phlorizin18 as well as (2) the observation that SGLT2 inhibitors only block glucose transport when present on the outside surface of the cell.19
F-Dapa Excretion and Metabolism
Pharmacokinetic and pharmacodynamic studies in humans have revealed that dapagliflozin has a plasma half-life of 13 hours, and only 1.2% of the oral dose appears unmodified in the urine.20 Elimination occurs by metabolism, mainly in the liver and kidneys, and excretion via the bile into the intestine. A major metabolite is the nonactive dapagliflozin-3-O-glucuronide, which is excreted in the urine. Our data in rats showed that the amount of F-Dapa (and/or metabolites) in the bladder is negligible, even after injection of cold dapagliflozin, <2% ID, suggesting that the tracer is not excreted via the renal system over this time period. RadioTLC (Figure 7) experiments, moreover, showed that only 12% of the parent compound in rats and none of the parent compound in mice migrate as the parent compound in the urine sample.
RadioTLC experiments (Figure 7) showed that 80% of the parent F-Dapa is found in the rat plasma, whereas only 51% of plasma activity could be attributed to the parent drug in mice. The mouse data are similar to both our F-Dapa (not shown) and the [14C] dapagliflozin results in human subjects.17
After displacing F-Dapa from the kidney, we observed a transient increase in the concentration of F-Dapa in plasma, especially in the renal vein (Figure 5B). This along with the lack of F-Dapa binding in the renal medulla (Figure 6) indicate that F-Dapa is reabsorbed by nephrons back into blood. Reabsorption is specific, because the percentage of another SGLT2–specific drug, empagliflozin, excreted into the urine is an order of magnitude higher than that of dapagliflozin and canagliflozin.21 Likewise, the nonselective inhibitor [3H] phlorizin bound to apical SGLTs in the proximal tubule is excreted into the urine after displacement with excess cold phlorizin.18 The renal and liver transporters responsible for dapagliflozin uptake and excretion into the bile are as yet unknown.
Summary
We have used a novel noninvasive imaging method with high temporal and spatial resolution to follow F-Dapa binding to SGLT2 proteins on the extracellular surface of organs through the entire living body. A high density of functional SGLT2 expression was found in the early proximal tubules of the kidney, some >15-fold higher than the density in any other organ. This supports the previous indirect evidence provided by SGLT2 immunohistochemistry and gene expression.9,14–16 Therefore, for at least one SGLT2 inhibitor, dapagliflozin, we have obtained the direct evidence that the drug acts on the apical membrane of the early proximal tubule after glomerular filtration and then, is reabsorbed by the nephron back into blood. These rodent data are consistent with the clinical studies of SGLT2 drugs in healthy individuals and patients with type 2 diabetes and provide a scientific rational for the clinical observations on their specificity, mode of action, and apparent lack of adverse effects. Finally, we propose that PET imaging of SGLT2 inhibitors provides a new tool in rodent and human subjects to determine the kinetics and regulation of SGLT2 expressed in the kidney under physiologic, pharmacologic, and possibly, pathologic conditions (e.g., diabetes and insulin effect on SGLT2 expression22).
Concise Methods
Radiotracer Synthesis
Me-4FDG was synthesized with chemical and radiochemical purities >97% and a specific radioactivity >2000 Ci/mmol.23
F-Dapa was synthesized from acetylated galacto-4-O-Dapa-triflate (described elsewhere). Briefly, the acetylated precursor galacto-4-O-Dapa-triflate in anhydrous acetonitrile was fluorinated with [18F]-fluoride in the presence of K2CO3 and Kryptofix222 at 90°C for 15 minutes and then, hydrolyzed with LiOH (1 M) in methanol. The product was purified by semipreparative HPLC (Retention Time=24 minutes; Grace Altima C18; 5 μm; 10×150 mm; 42% EtOH in water; 4 ml/min) and reconstituted in 10% ethanol-sterile saline solution for animal injection. The probe had a chemical purity >90%, a radiochemical purity >95%, and a specific radioactivity ≥4000 Ci/mmol.
Chemicals
Dapagliflozin and fluoro-dapagliflozin were synthesized,12,13 and their molecular structures are shown in Figure 2.
Animal Preparation
The animals used were Sprague–Dawley male and female rats (Charles River Laboratories, Wilmington, MA) and mice (C57BL/6 male and female; The Jackson Laboratory, Bar Harbor, ME; male Sglt1−/−,2 male Sglt2−/−, and Sglt1−/−Sglt2−/−4).
Experiments were performed in accordance with the institutional guidelines and a protocol approved by the University of California, Los Angeles Animal Research Committee. Animals were kept on a normal 12-hour day-night cycle and had free access to water and regular chow (Teklad S-235 Mouse Breeder Diet 7904; Harlan Industries, Indianapolis, IN) or CHO-free chow (Teklad TD08212; Harlan Industries) in the case of the Sglt1−/− and Sglt1−/−Sglt2−/− mice to avoid diarrhea.2,24 Before microPET scans, animals were fasted overnight but had free access to water, and they were anesthetized by inhalation of 2% isoflurane (Isoflo; Abbott Laboratories, Alameda, CA) in 100% oxygen in an induction box at 36°C.
Imaging
Small animal microPET scanning was performed on the microPET Focus 220 Scanner (Concorde Microsystem Inc., Knoxville, TN) or Inveon Dedicated PET (Siemens Medical Solutions USA, Inc., Knoxville, TN). Each animal was placed prone on a heated PET-computed tomography (CT) holder, which provided anesthesia.25 List mode PET data were acquired for 60 minutes immediately after tracer injection. F-Dapa and Me-4FDG were delivered via a catheter (PE 20 or PE 50; Intramedic; Clay Adams, Sparks, MD) tubing filled with 50 IU heparinized saline inserted into the proximal tail vein (mice) or femoral vein (rats) at the start of the microPET.
After the PET scan, a CT scan was acquired with a small animal CT scanner (MicroCAT II; ImTek Inc., Knoxville, TN or CrumpCAT, University of California, Los Angeles).
Image Analyses
Images were displayed and analyzed using the AMIDE software.26 Three–dimensional regions of interest (ROIs) were drawn over the organs.
For mice, the total ID was estimated from the total counts in the whole-body ROI on the last image frame.27 For rats, where the microPET scanner covers only part of the body, the total ID was the one measured before injection. The average radioactivity, calculated on each time frame to obtain the time course of the distribution in the different organs, was normalized to the ID to calculate the ID/g:  , where CT is the radioactivity in the tissue derived from microPET images with the unit of milliCuries per milliliter. WT and VT are the weight and volume of the tissue, respectively, and the density of the tissue was assumed to be approximately one. DInj is the ID (milliCuries).
Results are presented as means±SEM, and Welch t test was performed using Prism 4.02 (GraphPad Software, La Jolla, CA).
F-Dapa in Rat Plasma
Before microPET imaging, the right femoral artery and in some experiments, the left renal vein of a rat were cannulated.28 Serial blood samples (approximately 40 μl) were manually drawn from the femoral artery and renal vein. The first nine samples were collected within the first 2 minutes, and the rest of the blood samples was collected at 10, 19, 22, 25, 30, 40, and 58 minutes post-tracer injection and placed in heparinized microhematocrit tubes (Fisherbrand, Houston, TX). Blood samples were immediately centrifuged to separate the plasma from the cells. The radiolabeled tracer concentration in whole blood and plasma was measured by a γ-well counter (WIZARD 3”; PerkinElmer, Waltham, MA).
Competition Experiments
Rats
For preinjection experiments, dapagliflozin (1 mg/kg) in saline was injected via the femoral vein 1 hour before F-Dapa bolus injection (the plasma clearance half-life of dapagliflozin is approximately 4.6 hours13). In a second set of experiments, 20 minutes after the beginning of the scanning protocol, dapagliflozin (1 mg/kg) was injected as a bolus via the femoral vein contralateral to the tracer injection site.
Mice
Mice were injected via the tail vein with dapagliflozin (1 mg/ml) or phlorizin (10 mg/kg)29 in saline solution right before Me-4FDG injection.
Ex Vivo Microautoradiography
Glass coverslips (22×60 glass; no. 1 thickness; Corning, Corning, NY) were coated with Amersham LM-1 Emulsion (GE Healthcare, Waukesha, WI) and dried before the experiment. Each mouse was injected with 4 mCi F-Dapa, euthanized after 1 hour, and perfused intravenously with saline. Kidneys were removed, sliced in half, and frozen in dry ice/isopentane. Sections of 5‒7 μm were cut at −25°C on a cryostat (Leica CM3050; Leica Microsystems, Buffalo Grove, IL ), placed on Superfrost Plus (Fisher Scientific, Waltham, MA) slides, and dried. Coverslips were carefully placed over each kidney slice and exposed overnight. After separating the coverslips from the tissue, the autoradiograms were developed in Konidol-X (Konika) for 5 minutes, fixed in Fuji General Purpose Fixer (Fujifilm, Tokyo, Japan) for 10 minutes, and washed in water for 15 minutes. Each kidney slice was stained with hematoxylin and eosin (H&E) using standard protocols. Specimens were processed at the Microscopic Techniques Laboratory, Brain Research Institute, University of California, Los Angeles. Images of each autoradiogram and H&E section were acquired using the Aperio ScanScope AT Scanner in the Translational Pathology Core Laboratory, Department of Pathology and Laboratory Medicine, University of California, Los Angeles and manually aligned using Adobe Photoshop 5.0 (Adobe Systems, Inc., San Jose, CA). Scale bars were calculated using the Aperio ImageScope visualization software. The grain intensity over the kidney was estimated using ImageJ software (National Institutes of Health). Circular ROIs (0.0005 mm2) were drawn over the cortex/medulla and glomeruli/tubules using the H&E staining as a reference. Results were calculated as means±SEM, and Welch t test was performed using Prism 4.02 (GraphPad Software).
F-Dapa Metabolites
The percentage of intact F-Dapa in rodent plasma, urine, and kidney was quantified by radioTLC analysis of the extracted samples. Note that previous studies in rat, dogs, humans, and monkeys have shown that approximately 90% of the dapagliflozin is bound to plasma proteins.8
Blood samples (approximately 0.5 ml) were collected from the tail vein 5 minutes after tracer injection, and after 80 minutes, animals were euthanized to collect blood, urine, and kidney. The blood samples were centrifuged, and plasma was extracted with three volumes of methanol and cleared by centrifugation. The rat urine sample was diluted with two volumes of methanol, whereas mouse urine was not diluted. The kidneys were homogenized in PBS (500 μl). The suspension was mixed with methanol (1 ml) and water (500 μl). After centrifugation, the pellet was extracted again with methanol and water (2:1 ratio). The supernatants were combined. The extraction efficiencies of plasma samples and kidney tissue were ≥90%.
Each sample was aliquoted to give about 2000 cpm each and applied to a TLC plate (2×10 cm; Whatman C18). The spotted TLC plates were developed in a mixture of methanol, tetrahydrofuran and water at the indicated ratio. The developed plates were dried and exposed on a phosphor storage image plate (Fujifilm BAS-2025; Fuji) in an autoradiography cassette overnight. Autoradiography images were obtained on a Fuji BioImaging System FLA-7000 and analyzed using MultiGauge software (Fuji).
Disclosures
E.M.W. has served on SGLT advisory boards for Boehringer Ingelheim (Mannheim, Germany) and Janssen Biotech (Horsham, PA).
Supplementary Material
Acknowledgments
We acknowledge the skillful technical assistance of Waldemar Ladno and Olga Sergeeva.
Financial support for this work was provided by National Institutes of Health grants R01DK077133, R01DK019567, and P01AG025831 and the University of California, Los Angeles Jonsson Cancer Center. J.R.B. also acknowledges the support of the Elizabeth and Thomas Chair Endowment in Gerontology. Studies were carried out without any commercial support.
Footnotes
Published online ahead of print. Publication date available at www.jasn.org.
This article contains supplemental material online at http://jasn.asnjournals.org/lookup/suppl/doi:10.1681/ASN.2016050510/-/DCSupplemental.
References
- 1.Vallon V: Molecular determinants of renal glucose reabsorption. Focus on “Glucose transport by human renal Na+/D-glucose cotransporters SGLT1 and SGLT2.” Am J Physiol Cell Physiol 300: C6–C8, 2011 [DOI] [PMC free article] [PubMed] [Google Scholar]
- 2.Gorboulev V, Schürmann A, Vallon V, Kipp H, Jaschke A, Klessen D, Friedrich A, Scherneck S, Rieg T, Cunard R, Veyhl-Wichmann M, Srinivasan A, Balen D, Breljak D, Rexhepaj R, Parker HE, Gribble FM, Reimann F, Lang F, Wiese S, Sabolic I, Sendtner M, Koepsell H: Na(+)-D-glucose cotransporter SGLT1 is pivotal for intestinal glucose absorption and glucose-dependent incretin secretion. Diabetes 61: 187–196, 2012 [DOI] [PMC free article] [PubMed] [Google Scholar]
- 3.Jurczak MJ, Lee HY, Birkenfeld AL, Jornayvaz FR, Frederick DW, Pongratz RL, Zhao X, Moeckel GW, Samuel VT, Whaley JM, Shulman GI, Kibbey RG: SGLT2 deletion improves glucose homeostasis and preserves pancreatic beta-cell function. Diabetes 60: 890–898, 2011 [DOI] [PMC free article] [PubMed] [Google Scholar]
- 4.Powell DR, DaCosta CM, Gay J, Ding ZM, Smith M, Greer J, Doree D, Jeter-Jones S, Mseeh F, Rodriguez LA, Harris A, Buhring L, Platt KA, Vogel P, Brommage R, Shadoan MK, Sands AT, Zambrowicz B: Improved glycemic control in mice lacking Sglt1 and Sglt2. Am J Physiol Endocrinol Metab 304: E117–E130, 2013 [DOI] [PubMed] [Google Scholar]
- 5.Phelps ME: PET: Molecular Imaging and Its Biological Applications, New York, Springer-Verlag, 2004
- 6.Sala-Rabanal M, Hirayama BA, Ghezzi C, Liu J, Huang SC, Kepe V, Koepsell H, Yu A, Powell DR, Thorens B, Wright EM, Barrio JR: Revisiting the physiological roles of SGLTs and GLUTs using positron emission tomography in mice. J Physiol 594: 4425–4438, 2016 [DOI] [PMC free article] [PubMed] [Google Scholar]
- 7.Gallo LA, Wright EM, Vallon V: Probing SGLT2 as a therapeutic target for diabetes: Basic physiology and consequences. Diab Vasc Dis Res 12: 78–89, 2015 [DOI] [PMC free article] [PubMed] [Google Scholar]
- 8.Obermeier M, Yao M, Khanna A, Koplowitz B, Zhu M, Li W, Komoroski B, Kasichayanula S, Discenza L, Washburn W, Meng W, Ellsworth BA, Whaley JM, Humphreys WG: In vitro characterization and pharmacokinetics of dapagliflozin (BMS-512148), a potent sodium-glucose cotransporter type II inhibitor, in animals and humans. Drug Metab Dispos 38: 405–414, 2010 [DOI] [PubMed] [Google Scholar]
- 9.Scafoglio C, Hirayama BA, Kepe V, Liu J, Ghezzi C, Satyamurthy N, Moatamed NA, Huang J, Koepsell H, Barrio JR, Wright EM: Functional expression of sodium-glucose transporters in cancer. Proc Natl Acad Sci U S A 112: E4111–E4119, 2015 [DOI] [PMC free article] [PubMed] [Google Scholar]
- 10.Yu AS, Hirayama BA, Timbol G, Liu J, Basarah E, Kepe V, Satyamurthy N, Huang SC, Wright EM, Barrio JR: Functional expression of SGLTs in rat brain. Am J Physiol Cell Physiol 299: C1277–C1284, 2010 [DOI] [PMC free article] [PubMed] [Google Scholar]
- 11.Abdul-Ghani MA, Norton L, Defronzo RA: Role of sodium-glucose cotransporter 2 (SGLT 2) inhibitors in the treatment of type 2 diabetes. Endocr Rev 32: 515–531, 2011 [DOI] [PubMed] [Google Scholar]
- 12.Hummel CS, Lu C, Liu J, Ghezzi C, Hirayama BA, Loo DD, Kepe V, Barrio JR, Wright EM: Structural selectivity of human SGLT inhibitors. Am J Physiol Cell Physiol 302: C373–C382, 2012 [DOI] [PMC free article] [PubMed] [Google Scholar]
- 13.Meng W, Ellsworth BA, Nirschl AA, McCann PJ, Patel M, Girotra RN, Wu G, Sher PM, Morrison EP, Biller SA, Zahler R, Deshpande PP, Pullockaran A, Hagan DL, Morgan N, Taylor JR, Obermeier MT, Humphreys WG, Khanna A, Discenza L, Robertson JG, Wang A, Han S, Wetterau JR, Janovitz EB, Flint OP, Whaley JM, Washburn WN: Discovery of dapagliflozin: A potent, selective renal sodium-dependent glucose cotransporter 2 (SGLT2) inhibitor for the treatment of type 2 diabetes. J Med Chem 51: 1145–1149, 2008 [DOI] [PubMed] [Google Scholar]
- 14.Kanai Y, Lee WS, You G, Brown D, Hediger MA: The human kidney low affinity Na+/glucose cotransporter SGLT2. Delineation of the major renal reabsorptive mechanism for D-glucose. J Clin Invest 93: 397–404, 1994 [DOI] [PMC free article] [PubMed] [Google Scholar]
- 15.Sabolic I, Vrhovac I, Eror DB, Gerasimova M, Rose M, Breljak D, Ljubojevic M, Brzica H, Sebastiani A, Thal SC, Sauvant C, Kipp H, Vallon V, Koepsell H: Expression of Na+-D-glucose cotransporter SGLT2 in rodents is kidney-specific and exhibits sex and species differences. Am J Physiol Cell Physiol 302: C1174–C1188, 2012 [DOI] [PMC free article] [PubMed] [Google Scholar]
- 16.Vrhovac I, Balen Eror D, Klessen D, Burger C, Breljak D, Kraus O, Radović N, Jadrijević S, Aleksic I, Walles T, Sauvant C, Sabolić I, Koepsell H: Localizations of Na(+)-D-glucose cotransporters SGLT1 and SGLT2 in human kidney and of SGLT1 in human small intestine, liver, lung, and heart. Pflugers Arch 467: 1881–1898, 2015 [DOI] [PubMed] [Google Scholar]
- 17.Kasichayanula S, Chang M, Hasegawa M, Liu X, Yamahira N, LaCreta FP, Imai Y, Boulton DW: Pharmacokinetics and pharmacodynamics of dapagliflozin, a novel selective inhibitor of sodium-glucose co-transporter type 2, in Japanese subjects without and with type 2 diabetes mellitus. Diabetes Obes Metab 13: 357–365, 2011 [DOI] [PubMed] [Google Scholar]
- 18.Silverman M: The in vivo localization of high-affinity phlorizin receptors to the brush border surface of the proximal tubule in dog kidney. Biochim Biophys Acta 339: 92–102, 1974 [DOI] [PubMed] [Google Scholar]
- 19.Ghezzi C, Hirayama BA, Gorraitz E, Loo DD, Liang Y, Wright EM: SGLT2 inhibitors act from the extracellular surface of the cell membrane. Physiol Rep 2: e12058, 2014 [DOI] [PMC free article] [PubMed] [Google Scholar]
- 20.Kasichayanula S, Liu X, Lacreta F, Griffen SC, Boulton DW: Clinical pharmacokinetics and pharmacodynamics of dapagliflozin, a selective inhibitor of sodium-glucose co-transporter type 2. Clin Pharmacokinet 53: 17–27, 2014 [DOI] [PubMed] [Google Scholar]
- 21.Scheen AJ: Evaluating SGLT2 inhibitors for type 2 diabetes: Pharmacokinetic and toxicological considerations. Expert Opin Drug Metab Toxicol 10: 647–663, 2014 [DOI] [PubMed] [Google Scholar]
- 22.Ghezzi C, Wright EM: Regulation of the human Na+-dependent glucose cotransporter hSGLT2. Am J Physiol Cell Physiol 303: C348–C354, 2012 [DOI] [PMC free article] [PubMed] [Google Scholar]
- 23.Wright EM, Barrio JR, Hirayama BA, Kepe V: Tracers for monitoring the activity of Sodium/Glucose cotransporters in health and disease. United States Patent US 8,845,99 B2, 2014 [Google Scholar]
- 24.Wright EM, Turk E, Martín MG: Molecular basis for glucose-galactose malabsorption. Cell Biochem Biophys 36: 115–121, 2002 [DOI] [PubMed] [Google Scholar]
- 25.Suckow C, Kuntner C, Chow P, Silverman R, Chatziioannou A, Stout D: Multimodality rodent imaging chambers for use under barrier conditions with gas anesthesia. Mol Imaging Biol 11: 100–106, 2009 [DOI] [PMC free article] [PubMed] [Google Scholar]
- 26.Loening AM, Gambhir SS: AMIDE: A free software tool for multimodality medical image analysis. Mol Imaging 2: 131–137, 2003 [DOI] [PubMed] [Google Scholar]
- 27.Berger F, Lee YP, Loening AM, Chatziioannou A, Freedland SJ, Leahy R, Lieberman JR, Belldegrun AS, Sawyers CL, Gambhir SS: Whole-body skeletal imaging in mice utilizing microPET: Optimization of reproducibility and applications in animal models of bone disease. Eur J Nucl Med Mol Imaging 29: 1225–1236, 2002 [DOI] [PubMed] [Google Scholar]
- 28.Jespersen B, Knupp L, Northcott CA: Femoral arterial and venous catheterization for blood sampling, drug administration and conscious blood pressure and heart rate measurements. J Vis Exp 59: 3496, 2012 [DOI] [PMC free article] [PubMed] [Google Scholar]
- 29.Chasis H, Jolliffe N, Smith HW: The action of phlorizin on the excretion of glucose, xylose, sucrose, creatinine and urea by men. J Clin Invest 12: 1083–1090, 1933 [DOI] [PMC free article] [PubMed] [Google Scholar]
Associated Data
This section collects any data citations, data availability statements, or supplementary materials included in this article.


