

Abstract
Within the last few decades, optical imaging methods have yielded revolutionary results when applied to all parts of the central nervous system. The purpose of this review is to analyze research possibilities and limitations of several novel imaging techniques and show some of the most interesting achievements obtained by these methods. Here we covered intrinsic optical imaging, voltage-sensitive dye, photoacoustic, optical coherence tomography, near-infrared spectroscopy and some other techniques. All of them are mainly applicable for experimental neuroscience but some of them also suitable for the clinical studies.
Keywords: Autofluorescence, Brain Imaging, Diffuse Optical Tomography, Metabolic – Related Optical, Imaging, Near-Infrared Spectroscopy, Optical Imaging, Optical Coherence Tomography Optical Imaging of Intrinsic Signal, Photoacoustic, T-Herz, Voltage-Sensitive Dye
Introduction
Brain optical imaging has grown intensively within last few decades. Primarily, it is based on the idea that light absorption and scattering is highly responsive to functional changes in neural tissue. Light of different wavelengths can be used to observe the morphological structure and function in vivo in the exposed brain as well as transcranially. Use of optical techniques, however, is complicated because of the high level of light scattering and light absorption in brain parenchyma, skull, and scalp. In this review, we would like to cover the wide range of optical imaging approaches currently being applied in fundamental and clinical neuroscience. The techniques described here include intrinsic optical imaging (IOS), voltage-sensitive dye imaging (VSD), photoacoustic tomography (PT), optical coherence tomography (OCT), near infrared microscopy (NIRS), diffuse optical tomography (DOT), and a broad range of novel approaches to optical imaging of the brain. The physical and biological principles of each method are described, followed by examples of current applications to experimental research.
We compare mainly in vivo, but also in vitro data obtained with different techniques and make the underlying limitations of these methods. We address what has already been done within the last few decades and what would be interesting to do in order to develop brain optical imaging methods.
Brain optical imaging methods include the uses of different techniques either directly, using Voltage- and Calcium Sensitive Dye Imaging, or indirectly, using (Metabolic—related Optical Imaging, Optical Imaging of Intrinsic Signal (IOS), Diffuse Optic Tomography (DOT), Photoacoustic Tomography (PT), Optical Coherence Tomography (OCT) measurement of the neural activity in the brain. We will start with the simplest technologies and move towards most complex ones.
Intrinsic Optical Imaging (IOS)
Localization of neural activity in the cerebral cortex, or in other words, functional brain mapping, is one of the fundamental tasks for many generations of neuroscientists within the last hundred years and many optical-based methods have made it possible to answer these questions. The oldest brain optical imaging technique is known as intrinsic optical imaging (IOS), or optical imaging of intrinsic signal [4, 9, 7, Hagland et al. 2007, Tommerdahl et al. 2010].
This method is based on the optical changes in the features of brain tissue, which permit visualization of activity patterns with a spatial resolution higher than ten microns. One of the main advantages of IOS is that it can be realized without any extrinsic chemical probes. The sources for IOS are based on the physical properties of the tissue [7, 28, 36], which affect changes in light absorption and scattering as well as, to a lesser degree, autofluorescence. The existence of small optical changes associated with neuronal activity was described at the beginning of 20th century. However, these signals are very small and contaminated by technical or biological noise.
The IOS time course and functional meaning strongly depend on the illumination wavelength. The first component of the IOS comes from changes in the local oxygen saturation, which is an activity-dependent biological process. However, this component itself consists of two different phases. The earliest is an increase in the blood deoxyhemoglobin concentration [7, 35, 50, 54] resulting from elevated oxygen consumption of cells due to their metabolic activity in the activated area, which increases light absorption in the different parts of light spectrum. The delayed component is an increase in local cerebral blood-flow (CBF), resulting in an increase in the local oxyhemoglobin concentration [4, 54]. The next signal component originates from changes in CBF due to local capillary vasodilatation in the area containing many activated cells [24, 31–33, 35, 54, Santisakultarm et al. 2011]. All of these blood flow-related components are observed at all parts of spectrum, but with different intensities.
Another IOS component, which is weaker and less studied than the other, originates from the changes in light scattering [18, 46] that accompany neural and astrocyte activity. These optical changes are probably caused by the movement of small molecules and ions (including protons and dissociated water molecules) through the cell membrane [18, 44].
The use of IOS is becoming more common, not only in animals, but in human studies as well [18]. In regards to human research, IOS can be applied only during open brain surgery within relatively a short period of time [23]. The brain does not have its own pain receptors, therefore such an IOS imaging session can be realized with a patient who is awake, under local anesthesia [14, 15, 17]. This gives a good opportunity to keep verbal contact with the patient and apply IOS for speech and cognitive research. Although many members of the scientific community believe that despite of the fact that IOS is safe and harmless, any additional “open brain” time is unjustified from an ethical point of view.
With regards to technical aspects for IOS experiment, the animal is anesthetized while the skin and muscles are removed and the skull above the area of interest is thinned and flatted or completely removed as well as the dura mater.
Both acute and chronic animal experimental techniques can be combined with IOS. In the latter case, a recording chamber made of appropriate materials (plastic, metal, dental cement or a combination of these) are usually mounted on the skull with anchoring screws. The interior of the chamber is filled with mineral or silicone oil, agar or artificial cerebrospinal fluid (ACSF) [4, 20], which contains antibiotic and sometimes medicine to suppress growth of the connective tissue that makes the surface non-transparent and inappropriate for imaging [57, 58]. After the experiment, the chamber is covered with a special cap to protect the cortical surface. During experiments, the cap and agar gel are removing and the chamber is filled again with fresh agar gel, ACSF, or silicone oil and a cover glass is placed on top [27, 58]. Such methods allow combining of imaging with electrophysiological recording. The electrodes can be introduced at an angle under the cortex through the gel or oil and beneath the glass. It has recently become possible to use multielectrode arrays in combination with IOS. This is possible if electrodes are placed on transparence, biologically neutral thin and flexible material. Most often, the animal will remain anesthetized during measurements. In some cases, the animals can survive for many months while an area of their cortex is accessible for repeated optical imaging.
It was well known from the Ramon-y-Cajal time that the cerebral cortex is organized in a columnar fashion across the cortical surface. Cells with similar response properties are clustered into functional representations. Though it has been many years since this was shown in vivo with high spatial resolution, IOS has been very valuable. Since the 90's, it has been employed to obtain information about the functional domain in the mammal's visual cortex. Several teams [6, 19, 57, 58] used IOS imaging and found that cortical regions that respond best to one orientation form highly ordered patches rather than elongated bands. It was an important step on the long road of studies of ocular dominance and orientation columns by IOS, along with their functions in the processing of visual information.
For intrinsic optical recording to be applied for functional brain mapping, an efficient method of analysis is required for removing the biological and technical noise from the recorded data [31–33, 35]. One such method analysis is of recorded optical signals including the filtering of a particular range of spatial frequencies. This removal of the high spatial frequency components from recorded signals leads to the smoothing of generated maps, resulting in them exhibiting a continuous representation of stimulus features. Such filtering is not required, but may be recommended for the observation of fine functional structural maps such as the pinwheel structure in orientation maps, or pure tone sound frequency representations.
The removal of low spatial frequency components eliminates low frequency, high amplitude fluctuation in the recorded optical signals. Some principles of such analyses have been developed and described in the last decade in RIKEN. Thus, the generalized indicator function method [68] extracts stimulus-evoked intrinsic signals from noisy signals contaminated by components from small blood vessels.
Photoacoustic Imaging
There are several techniques that help to make IOS more quantitative. One such technique is photoacoustic imaging, which includes photoacoustic microscopy (PAM) and photoacoustic tomography (PT). This is a hybrid imaging technique based on the photoacoustic effect [5, 37].
The photoacoustic effect is based on the conversion of photon's energy into acoustic waves due to light's absorption thermal excitation [25, 37, 63]. When rapid pulses of light are incident on the substrate, their energy can be absorbed and the resulting energy will then be transformed into the heat, which causes sound waves due to pressure variation in the substrate (Fig. 1). Practically, the laser pulses are delivered into an investigated object and the generated sound waves (in ultrasonic frequencies) are detected to form graphical images [26].
Fig 1.
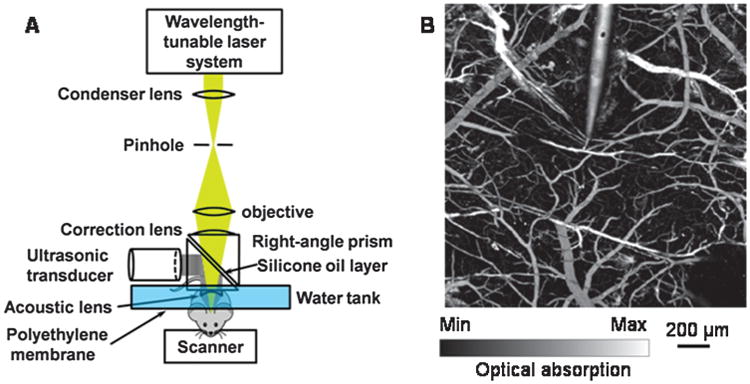
(A) Schematic of the optical-resolution photoacoustic microscope. (B) Photoacoustic images of the mouse cortical microvasculature acquired at 570 nm lasers wavelength; tungsten microelectrode is introduced into the cortical tissue. Reprinted with permission from [63], V. Tsytsarev et al., Photoacoustic microscopy of microvascular responses to cortical electrical stimulation. J. Biomed. Opt. 16, 076002 (2011a). © 2011a, SPIE.
Like in IOS, optical absorption in different parts of the spectrum is determined by physical and physiological features of the substrate, so the magnitude of the ultrasonic waves is proportional to the light absorption and reveals local anatomical and physiological properties of the substrate [33, 55].
Either two- or three-dimensional images of the investigated region can be created by computer [26]. The imaging depth of photoacoustic imaging, like in all other methods of optical imaging, is limited by light penetration and scattering, while the spatial resolution might be determined by ether optical focusing (at shallow depth) or the ultrasound transducer's parameters (deeper into tissue when light scattering makes optical focusing impossible). The spatial resolution depends on imaging depth and can be as high as 1 micrometer, while temporal resolution completely depends on the substrate volume, spatial resolution, and technical characteristics of the imaging system [71]. In some cases, the laser is not scanning the substrate, but staying in the single point. For example, if one wants to monitor functional activity at a single point, or if a planar image is taken with the help of large transducer array, the temporal resolution may reach milliseconds, if not microseconds. If a scanning technique (Fig. 2) similar to optical scanning microscopy is used, it may take a few tens minutes or more to generate a three-dimensional high spatial resolution image of the studied sample. The temporal resolution is therefore quite limited.
Fig 2.
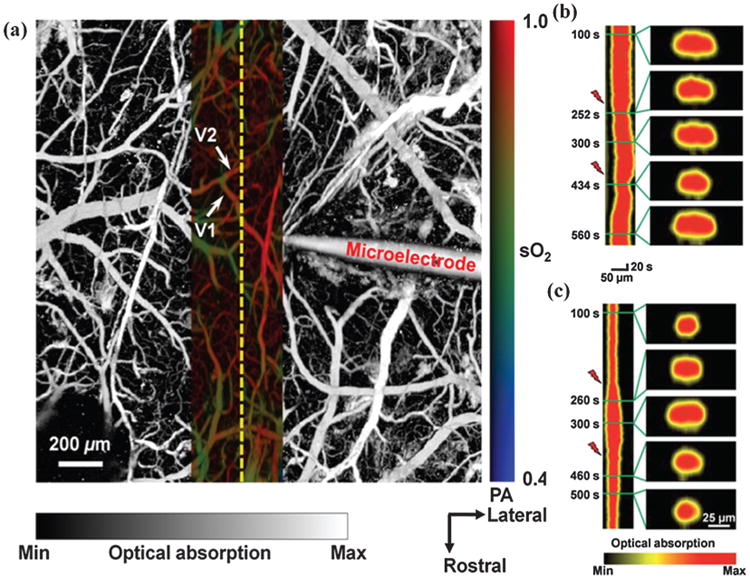
Superimposed open-skull photoacoustic images of the mouse cortical microvasculature (a). The maximum-amplitude projection image acquired at 570 nm is shown in gray scale, and the vessel-by-vessel hemoglobin oxygen saturation mapping of a smaller region calculated from dual-wavelength measurements is shown in color scale. High temporal resolution monitoring of the vascular response was performed along the yellow dashed line. V1 and V2 are the two microvessels studied in the monitoring of vasoconstriction and vasodilatation induced by direct electrical stimulations at (b) 100 and (c) 150 μA. In each panel, the left column is the time course of the change in vessel diameter (represented by the projection of the vessel cross section). The right column is the vessel cross-sectional image at different time points, indicated by the green lines. The red lightning symbol indicates the onset of the stimulation. Reprinted with permission from [63], V. Tsytsarev et al., Photoacoustic microscopy of microvascular responses to cortical electrical stimulation. J. Biomed. Opt. 16, 076002 (2011a). © 2011a, SPIE.
Nevertheless it is not impossible to use PA for functional imaging. Thus, recently PA was employed to monitor cerebrovascular responses to direct brain electrical stimulations (Fig. 2(a)) [63]. Surprisingly, vasomotional responses appeared in two opposite forms: vasoconstriction and vasodilatation (Figs. 2(b, c)) [63].
PA can detect nonfluorescent endogenous pigments with very high sensitivity to optical absorption in vivo [33, Song et al. 2009]. Unfortunately, there are only a few sufficiently absorptive endogenous pigments, hemoglobin being the most prominent among them [26]. Both oxy- and deoxyhemoglobin are major sources of light absorption in the visible and near-infrared part of spectrum. PA is very applicable for the brain imaging based on the local oxygenation and CBF measurement.
Diffuse Optical Tomography (DOT)
Diffuse optical tomography (DOT), is a neural activity visualization method based on the measurement of both photons absorption and scattering, which is related to physiological features of the brain tissue. The DOT spatial resolution reaches several millimeters [11]. Technically, DOT usually employs several near-infrared emitters as well as detectors composed of optical fiber bundles that are positioned on the head surface. In DOT, each detector can receive light from many emitters, not only from the nearest (Fig. 4(a)) [11]. Due to light scattering, photons pass through some tissue depth, which depends on distance from emitter to detector. Another way to obtain depth information involves high frequency amplitude modulation of light source and measurement of small phase delay in modulation of detected light, which depends on the average path length of photons from emitter to detector. This enables production of 3D images of the brain, which is also determined by fiber array geometry as well as bone and scalp thickness. This method is much cheaper than fMRI and NIRS. The serious advantage of DOT [5] is that it can be performed on a freely moving object. The mathematics analysis is of the main parts of DOT, since it is impossible to get any visual information directly from the experiment and any optical data obtained must be converted into information about physiological features of the brain tissue in the particular area. This is referred to as a nonlinear inverse problem. Unfortunately, the exact solution of the inverse problem for light diffusion does not exist, hence quantitative DOT results are somewhat unreliable.
Fig 4.
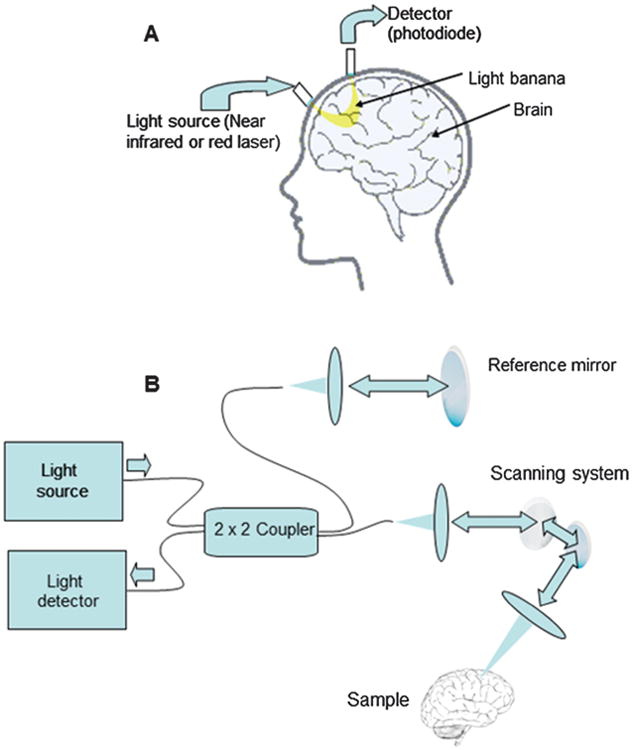
Principle of the diffuse optical tomography (A) and optical coherence tomography (B).
Both clinical and fundamental DOT applications have become increasingly common in the last decade. The hemodynamic response, recorded by DOT technique, demonstrates rising of the blood-oxygen level dependant (BOLD) signal and can be observed in functional magnetic resonance imaging (fMRI). DOT has important advantages over conventional fMRI, notably lower cost and portability.
Optical Coherence Tomography (OCT)
Optical Coherence Tomography (OCT) is an optical technique that measures scattering of light at different depth. It is somewhat similar to pulse/echo sonography, but it uses some form of correlation technique recover depth because light pulses travel too fast to be resolved in time. Basically, OCT is a scanning technique that uses interferometry, which is a process of comparing an interfering incident and scattered light's waves to attribute light scattering to a particular depth. In time domain OCT setup (Fig. 4(b)), coherence light, usually an infrared laser is separated into two beams—the first one towards the studied object and the second toward a moving mirror. This is one of the key parts of the imaging system. The light that is reflected from the mirror and the beam from the sample are directed to the detector (usually a CCD-camera, charge-coupled devices), which measures the light intensity. Positive interference happens only when the photons path of the probe and reference beam are equal. The setup varies with the distance that the light has to travel to reach the moving mirror, so it is possible to get a signal at different depths and generate a 3-D image of the sample [1, 8, 36]. There are other versions of OCT based on constant length interferometer, but time varying optical wavelength (swept-source OCT), or broadband light source, with spectral analysis of light passing through the interferometer (Fourier-domain OCT). There is also a full-field version of time domain OCT where instead of point-to-point scanning, a full 2-D image of the interference pattern between light collected from the reference plane and image plane is analyzed.
OCT allows light to penetrate the scattering medium, achieving, at least in some cases, sub-micrometer resolution. Recently, OCT has been used in animal experimental brain research in vivo as well as in vitro. Commercially available OCT systems are in experimental applications, but also in diagnostic medicine (mainly in ophthalmology) to obtain detailed images of the human retina.
In the last decade, OCT functional response measurements were performed in vivo by a few groups independently in separate experiments. Despite the significance of the obtained data, an explanation of the origin the OCT functional signal requires additional study.
It is clear that local OCT response corresponds with the hemodynamic response and its time course can be easily explained by local hemodynamic changes, but cell-swelling may play an important role as well. A few years ago, it was hypothesized that localized scattering changes (both negative and positive) reflect local changes in erythrocyte density [1]. Without hesitation, we can say that OCT has the potential to become a powerful technique for fundamental and applied neuroscience research.
Impressive results based on the combination of OCT and IOS has been obtained recently on the rat somatosensory cortex [8]. Their results demonstrated that OCT can provide high-resolution, cross-sectional images of hemodynamic activity and show significant spatiotemporal correlations between OCT and IOS signals.
Terahertz Radiation Brain Imaging
Terahertz radiation (T-Ray), or submillimeter waves is a type of electromagnetic ray with frequencies in the terahertz range, roughly from 0.3 to 3 THz, between infrared and microwave parts of the electromagnetic spectrum. T-ray has one important feature: T-photons are nonionizing, but interact with molecules of the absorptive substance. T-Ray could probably be used to get information about molecular activity in living tissue as well as provide good spatial resolution up to hundreds micrometers. However, T-Ray enables penetration of living tissue for up to a few millimeters. Also, since it can detect differences in water and ion concentration, it could provide a new method for the imaging of brain tissue [29]. The terahertz part of the spectrum has remained unknown for a long time for two reasons: A stable T-Ray beam generator did not exist and robust and sensitive T-Ray detectors did not exist. Due to these deficiencies, the terahertz part of the spectrum was named “the terahertz-gap” by the scientific community. Only over the past decade have some improvements been made to overcome all of these difficulties, making it possible to use T-Rays for brain imaging.
Among a relatively small number of brain imaging T-ray applications, we shall mention the brain imaging study performed on fixed brain slices, used only for capturing morphological brain images [13, 43]. Using a terahertz quantum cascade laser as a source of coherent radiation at a wavelength of 87 μm, a resolution better than 250 μm has been obtained [13, 16, 38, 43].
Applied technology allows clear anatomical identification of rat brain structures. Some of brain subcortical structures are more myelinated and therefore have more lipids, allowing for a higher level of T-ray absorption [16, 43, 74]. The cerebral cortex has a much higher content of ionized water and proteins, and, as result, a lower absorption level that gives higher signal intensities in THz images. It is possible that T-Ray has promising properties for a brain imaging, however at this time we do not have enough information to one can say it with certainty [16, 43]. Unicom properties of the T-Ray makes it promising for brain imaging research, however at this time there are not enough data to say certainly if it will be a widely accepted method or remains an exotic technique on the periphery of the neuroscience.
Near Infrared Spectroscopy (NIRS)
A near infrared light (roughly from about 800 nm to 2500 nm) can effectively penetrate the skin, muscle, and bone [3, 70]. Due to different light absorptions by oxy- and deoxyhemoglobin, the value of attenuated light depends on blood oxygenation, thus NIRS can provide voluble information about local metabolic activity in the brain [42, 70].
NIRS can be used for non-invasive assessment of brain function through the intact skull in human subjects by detecting changes in hemoglobin optic features associated with local oxygen consumption, for example, in branches of cognitive psychology as a partial replacement for fMRI techniques [17, 48, 49].
NIRS can be successfully used on infants. Moreover, in contrast with fMRI, an infant is a much more convenient subject for NIRS due to skull thickness [42, 70, 72]. However, NIRS cannot replace fMRI completely because it can only be used to get a signal from cortical tissue, where fMRI can be used to measure activation throughout the brain.
Both temporal (seconds) and spatial (tens of millimeters) resolution is limited, but NIRS has a serious advantage. The subject can be observed while he or she is comfortably seated in the chair, which is especially important for infants [42, 48, 49]. NIRS is currently the only method of portable neuroimaging, which is especially important for the neural study of higher cortical functions such as cognition and language.
Primarily, NIRS was studied in detail as a tool to evoke responses of cerebral hemodynamics, which is quite similar to the main components of IOS. In our opinion, it is very important that this method is also suitable for fast optical signals that are known as Event-Related Optical Signals (EROS) [44].
In the last decade of the 20th centaury, functional-related fast optical signal have been described, probably, for the first time [18]. This signal is strong enough to optically measure vascular activity as well as neuronal activity noninvasively in animals and humans.
According to common knowledge, fast light scattering changes are caused by cell swelling and conformational changes [Carter et al. 2004, Cohen et al. 1968, Salzberg and Obaid 1988, Stepnoski et al. 1991, Tasaki and Byrne 1992, Yao et al. 2005]. In experiments in vivo, such changes have also been detected by a couple of groups [46, 51]. There are different hypothesis about the origins of these optical signals, thus some researchers [Steinbrink et al. 2005] were unable to detect fast optical signals transcranially in humans. In our opinion, the questions concerning the origin of the fast optical intrinsic component and its use in neuroscience research remain open, but technical progress in the light delivery system and light detectors can improve the situation.
Voltage-Sensitive Dyes (VSD) Imaging
Optical imaging with the use of voltage-sensitive dyes (VSD) appears to be one of the best tools in understanding how the large networks of neurons works (Fig. 3). The activity of neuronal populations rather than that of single cells need to be studied. VSD imaging offers a opportunity to study the activity of neuronal ensembles in vivo with relatively high spatial resolution (up to 20 μm) and high temporal resolution (up to tens of microseconds) that is comparable with electrophysiology [40].
Fig 3.
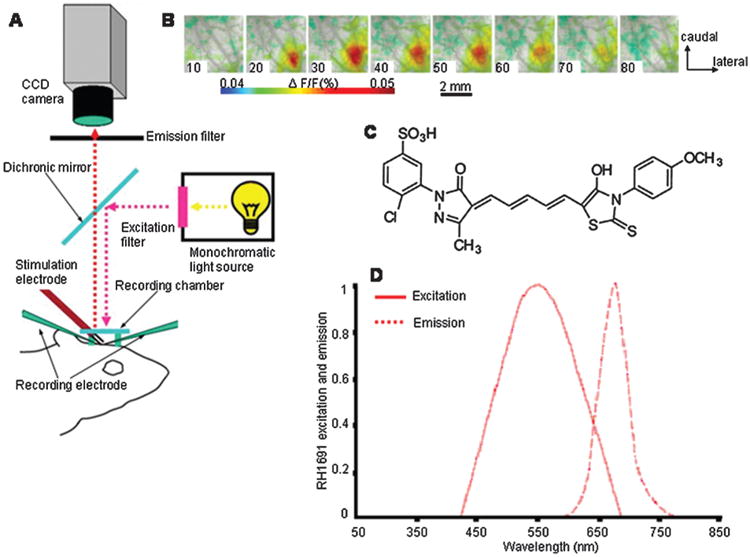
(A) Main parts of the voltage-sensitive dye optical imaging setup. (B) Voltage-sensitive dye optical images of the somatosensory cortex showing single-whisker stimulation fluorescence changes, the time after stimulus onset (ms) is indicated at the bottom left corner of each image. (C) RH1691, one of the most common voltage-sensitive dye molecule. (D) Excitation and emission spectrum of the RH1691 voltage-sensitive dye (Reprinted with permission from [75], F. Zhang et al., Channelrhodopsin-2 and optical control of excitable cells. Nature Methods 3, 785 (2006). © 2006.).
VSD's are chemical compounds that change optical properties in response to a change in membrane's electric field intensity [19]. This imaging technique is based on the main feature of the VSD: dye molecules bind to the membrane and convert changes in membrane potential into the energy of the emitted photons. Frequently these signals are related to membrane potential linearly, thus indicating both hyperpolarization and depolarization, so it allows measuring this potential without using of the electrodes techniques. The VSD works by the principle of electrochromism: after photon's absorption, the molecule undergoes a charge change from the initial level to the excited level, and fluorescence occurs due the emission of a photon during the inverse process—from the excited level back to the initial. The wavelength of the emitted photon is determined by the change in molecular energy.
In contrast to IOS, this optical signal originates directly from rapid neural activity-dependent changes in light absorption or fluorescence, which respond in less than milliseconds.
In regards to cerebral cortex imaging in vivo, the VSD signal is related to the stained membrane area, therefore, the optic signal mainly originates from dendrites and axons. The neural body generates only a minor part of the signal. Dendrites of neurons in a particular cortical structure might cross relatively big cortical areas, so the fact that VSD signal is mainly a dendritic signal definitely affects the spatial resolution.
In regards to “classical” VSD experiments, the skull of an anesthetized animal must be opened and the dura mater usually must be removed above the area of the recording, but in some cases, such as in small and young animals, VSD penetrates the intact dura mater. Fluorescent VSD molecules bind to the external surface of all cell membranes, usually without interrupting their normal functions. Emitted photons detecting by charge-coupled device (CCD—camera) or photodiode array that is allowing to get a high temporal resolution for neuronal activity imaging region of interest.
Glial cell membranes also bind with dye molecules. Among neurons, there are different types of excitatory and inhibitory cells that have different shapes and properties. Therefore, the recorded signal consists of all of these components, which should be considered for data interpretation.
VSD provides direct measurements of neuronal activity and is typically combined with a fluorescence microscope to record neuronal activity at the single cell. Measurement of population activity needs a specially designed optic system, “macroscope,” characterized by a large field of view and relatively long focal length. VSD imaging also needs a fast photosensitive device (CCD—camera or photodiode array). The temporal resolution of the system is determined, mainly, by parameters of the CCD camera. Confocal or multiphoton laser scanning microscopy, in combination with VSD imaging, can increase effective spatial resolution and increase penetration depth due to the reduction of intensity of out-of-focus light. These microscopes have been successfully used to monitor VSD signals in single neurons and neural populations. However, due to the scanning nature of confocal and multiphoton microscopy, the temporal resolution is not sufficient for many purposes.
A minimal recording speed of hundreds of frames per second is required to resolve the time course of physiologically important voltage changes. Many modern CCD—cameras or complementary metal-oxide-semiconductor (CMOS) detectors are acceptable for such recording. However, the speed of recording is not the only critical parameter. The detector must be able to not only allow for fast imaging, but it must have low noise and be able to accept a large number of photons (have a deep well) because induced voltage amplitude variation is typically less than one percent. If the signal-to-noise ratio is not acceptable the noise can be decreased only by the averaging of several recovering trials. The combination of high sensitivity and high spatial (number of pixels per area of recording) and temporal (frame rate) resolution remains the main task for creation of new photosensitive devices that are suitable for VSD imaging.
VSD in vivo imaging requires cranial window while encoded voltage-sensitive proteins allow working with the intact brain [2] if the bone above the area of recording is thinned and flattened. Heart-beat and respiration movements within the experiment cause mechanical noise as well as blood stream fluctuations and changes in the local oxygenation but there is not a universal way to solve these problems. However, synchronization of recording and stimulation with heart rhythm and breathing can improve the situation along with removing these artifacts by off-line data analysis.
Conventional methods of VSD imaging have quite a limited spatial resolution, especially along the depth axis. The situation was dramatically improved by a technique combining VSD with two-photon microscopy.
The new epoch in VSD imaging was started by the development of genetically-encoded voltage-sensitive fluorescent indicators [2, 39, 34]. These proteins have been shown to provide a reliable optical signal corresponding to membrane potential from the cells without extrinsic fluorescent probe in vitro as well as in vivo.
Genetically encoded voltage-sensitive proteins can be used for in vivo epifluorescence experiments. Work over the last couple of decades has yielded an array of established voltage-sensitive imaging methods for optical recording of electrical activity; conventionally using voltage-sensitive dyes and recently using genetically modified neurons [45]. The use of these methods provides answers for many fundamental questions that were previously intractable using other neuroscience methods.
Within the last decade, a series of genetically-encoded voltage-sensitive fluorescent proteins has been generated and used by several scientific groups. In RIKEN (Japan), molecular fusion of the voltage-sensing domain of Ci-VSP (Ciona intestinalis voltage sensor-containing phosphatase) to red-shifted fluorescent protein operands was performed [2, 45]. Without hesitation, we can say that along with the possibility of genetically targeting probes to specific neurons, an optical recording of the neural activities will provide a powerful tool to optical imaging in vitro and in vivo.
The spectrum of the VSD application is very broad, but one particular result, achieved by this method within last decade, must be mentioned in this review.
VSD optical imaging has been used by many groups within the last couple of decades in order to create a functional map of the different parts of the cerebral cortices and has yielded revolutionary results when applied to sensory cortices in different experimental paradigms [73].
Currently, VSD imaging allows visualization of neural activity in the rat barrel cortex in response to the deflection of a single whisker in different directions [Tsytsarev et al. 2010]. Obtained data indicates that the rapid deflection of the single vibrissae in varying directions correlates with different activity patterns in the barrel field. In other words, it was shown that vibrissae deflections cause responses in different cortical neurons according to the direction of the whisker's deflection.
The auditory research with the use VSD has been continued by many groups. Thus, the problem of auditory functional topography in the mouse auditory cortex and thalamus has been studied [22]. Stimulating the thalamus' medial geniculate body (MGBv) along the tonotopic axis in the slice, an orderly shift of VSD signals along the primary auditory cortex tonotopic axis, along with topography in the mouse thalamocortical neural circuit that is preserved in the living slice, has been observed [22]. One of the authors of this review used VSD imaging in vivo to study the cortical representation of interaural time differences in rats. It was found that there are neuronal ensembles that are sensitive to a particular ITD though activity patterns shift up to several hundreds microns in about 40 ms [65].
Analysis of VSD imaging data is similar to the IOS data analysis, though it has some peculiarity and difficulties. It was shown [Takagaki et al. 2008] that the level of fluorescence, ΔF/F, is influenced by dye staining quality along with some other factors. To rectify this problem, another method of normalization referred to as ΔF/ΔF epileptiform was proposed in the last decade [9]. It is based on the use of the neural activity recorded before epileptic seizures as a reference. Such normalization-independent metrics, considering waveform propagation patterns, oscillations in single detectors, and some other factors, may better capture the biological information that is obtained by VSD imaging in vivo.
Metabolic-Related Optical Imaging
Different sorts of light-based methods are suitable to measure of the oxygen consumption, autofluorescence of intrinsic molecules, and, that is most important practically, fluorescence of glucose substitute that allow the measure glucose consumption [21].
The classical methods of using glucose metabolism for visualization of brain activity include isotopic 2-Deooxyglucose (14C) autoradiography postmortem and Fluorodeoxyglucose (18F) positron emission tomography (PET) [52], which requires radioactive glucose [41] accumulation and measurement of radioactive signal. Fluorescent glucose analogs offer the ability to measure glucose uptake in vivo. Once injected into the blood stream, 2-Deooxyglucose (14C) or Fluorodeoxyglucose (18F) can be taken up by different type of cells. They cannot, however, be further metabolized because of the lack of a 2′-hydroxyl group needed for glucose metabolism. Therefore, the distribution of these glucose substitutes is a good reflection of metabolic activity [14, 15, 67]. A fluorescent glucose substitute, 2-(N-(7-nitrobenz-2-oxa-1,3-diazol-4-yl)amino)-2-deoxyglucose (2-NBDG), was successfully used for visualization of neural activity in vitro as well as in vivo [64, 67]. In experimental and clinical practice, a radioactive beam limits the usage of the radioactive labeled 2-DG analog. However, in contrast with the isotopic labeled glucose analog, 2-NBDG solves this issue by providing an optical fluorescence signal. Recently obtained in vivo results have shown that 2-NBDG, as well as similar fluorescence glucose substitutes, is a good indicator of the high metabolic activity caused by cortical tissue activation [66, 69].
In the study, performed with participation of one of the authors [64, 67], 2-NBDG was employed for visualization of in vivo epileptic activities induced by intracortical injection of 4-aminopyridine (4-AP), which is a common potassium-channel inhibitor that causes epileptic activity. The increased uptake rate of 2-NBDG at the injection site of 4-AP reflected increased cortical metabolism caused by epileptic seizures and produced a fluorescent signal in this site.
Although this method can be used to localize neural activity in vivo in the open brain, it is still challenging to apply transcranially. Unfortunately, brain tissue, as well as bone, skin, and muscles, is one of the worst materials for carrying light. Theoretically, we believe, it is possible to apply these techniques for human infants, who have a more transparent skull and smaller-sized brain. It may be promising to use fluorescent glucose substitute methods in combination with diffuse optical tomography (DOT) and photoacoustic tomography (PAT), which allow for an image to be captured from a few centimeters deep.
Recent experiments demonstrated that glucose uptake can be monitored by PAT using 2-NBDG in vivo [67]. Brain imaging experiments demonstrated that PAT can separate 2-NBDG (injected into the blood stream just before imaging session) metabolic and local hemodynamic responses to the paw electrical stimulation. Glucose uptake response and hemodynamic response areas morphologically located in the same place.
Ca2+ and other Ion Sensitive Dye Imaging In Vivo
Ca2+-sensitive dye is a very powerful method based on the changes in intracellular Ca2+ levels, reflected by an optic signal originated from the Ca2+-sensitive chemical probes.
The dye reflects changes in the calcium concentration in the intracellular space. In contrast with VSD, Ca2+-sensitive dye molecules penetrate into the cells through membrane and reflect slow, long-lasting changes in the concentration of intracellular calcium ions [12].
The fluorescence signal of calcium-sensitive dyes is much slower than the VSD signal since it reflects changes in calcium concentration in comparison VSD, which reflects changes in membrane potential. The signal reaches about half of its maximum strength at an intracellular calcium concentration of approximately 0.2 μM.
The fluorescence of the Ca2+-sensitive probes is usually quite strong, but dye loading into the cells is very problematic, therefore the application of this method for in vivo imaging is methodologically limited. Another problem is that, also in contrast with voltage-sensitive dye, the Ca2+-sensitive dye penetrates only into relatively small number of cells, so it is very difficult to get a signal from the neural ensemble. However, Ca2+-sensitive dye application in vivo is not only possible, but also plays an important role among experimental neuroscience methods—in most cases, in combination with 2-photons microscopy. In multi-photon (or, 2-Photon) microscopy, two or more photons are simultaneously (within 10–18 s) absorbed by the same fluorescent molecule. Excitation photons belong to the near-infrared part of the spectrum so they penetrate relatively deep into the tissue because and do not damage living cells.
Within the last decade, a large family of genetically-encoded fluorescent Ca2+ indicator proteins have been generated and used for both in vivo and in vitro experiments, which were applied in the broad spectrum of scientific aims.
Ca2+-sensitive dye, along with another ion-sensitive dye, was more or less successfully applied for the imaging of neural activity in different experimental paradigms. Thus, ion-sensitive technique that uses the fluorescent chloride-sensitive intracellular dye reflects changes in intracellular Cl− by epifluorescence or ultraviolet laser scanning confocal imaging [53]. Intracellular Na+ sensitive fluorescent dye, excitable in the visible spectrum as well as by two-photon illumination, also has been synthesized and described by [30]. At least in vitro, this fluorescence indicator opens new ways of probing the neural network.
Autofluorescence
As mentioned before, optical recording of neural activity, the powerful method for investigating brain functions, can be divided into two types: one that uses extrinsic chemical probes, sensitive to membrane potentials (VSD), calcium (Ca2+ sensitive dye) or pH, and one that uses different sorts of the endogenous signals. One of these endogenous signals reflects aerobic energy metabolism and is used for brain imaging autofluorescence of flavoproteins, peptides that are part of the mitochondrial electron transfer system. This method is called flavoprotein autofluorescence signals (FAS), which originates from the changes in the redox state of mitochondrial metabolic intermediates.
Flavoproteins are peptides molecules that contain a flavin adenine dinucleotide or flavin mononucleotide, and are involved in a many biological processes, some of which are accompanied by bioluminescence [21, 10]. Fluorescence signals from the flavoproteins reflect the coupling between neuronal activity and mitochondrial metabolism and therefore can be used for visualization of neural activity in vivo as well as in vitro.
The FAS was successfully used for the monitoring of brain metabolism during hypoxia, spreading depression, direct cortical stimulation, and other experimental paradigms not only in open brain experiments but also transcranially [60].
Recently, FAS optical imaging gave a strong argument to support that the astrocyte–neuron lactate shuttle hypothesis (ANLSH), according to activity-induced glucose uptake and metabolism, takes place predominantly in astrocytes [47].
Flavoprotein autofluorescence imaging provides a useful tool for both in vivo and in vitro investigating of neuroenergetics and functional mapping patterns of neuronal activity.
Biographies

Vassiliy Tsytsarev received his Ph.D. in Neuroscience in St. Petersburg State University, Russia. His work in the past years were focused on the brain optical imaging, research of the neural circuits and functional brain mapping.

Konstantin I. Maslov graduated from Moscow Institute of Physics and Technology, and received his Ph.D. from Moscow State University in Moscow, Russia. His work in the past decade has focused on the integration of ultrasonics and optics for the imaging of biological tissue, and has led to the inventions of dark field photoacoustic microscopy, optical-resolution photoacoustic microscopy, and photoacoustic Doppler sensing.
References and Notes
- 1.Aguirre AD, Chen Y, Fujimoto JG, Ruvinskaya L, Devor A, Boas DA. Depth-resolved imaging of functional activation in the rat cerebral cortex using optical coherence tomography. Opt Lett. 2006;31:3459. doi: 10.1364/ol.31.003459. [DOI] [PMC free article] [PubMed] [Google Scholar]
- 2.Akemann W, Mutoh H, Perron A, Kyung PY, Iwamoto Y, Knopfel T. Imaging neural circuit dynamics with a voltage-sensitive fluorescent protein. J Neurophysiol. 2012;18 doi: 10.1152/jn.00452.2012. [DOI] [PubMed] [Google Scholar]
- 3.Akiyama T, Ohira T, Kawase T, Kato T. TMS orientation for NIRS-functional motor mapping. Brain Topogr. 2006;19:1. doi: 10.1007/s10548-006-0007-9. [DOI] [PubMed] [Google Scholar]
- 4.Bahar S, Suh M, Zhao M, Schwartz TH. Intrinsic optical signal imaging of neocortical seizures: the ‘epileptic dip’. NeuroReport. 2006;17:499. doi: 10.1097/01.wnr.0000209010.78599.f5. [DOI] [PubMed] [Google Scholar]
- 5.Bauer AQ, Nothdurft RE, Erpelding TN, Wang LV, Culver JP. Quantitative photoacoustic imaging: correcting for heterogeneous light fluence distributions using diffuse optical tomography. J Biomed Opt. 2011;16:096016. doi: 10.1117/1.3626212. [DOI] [PMC free article] [PubMed] [Google Scholar]
- 6.Bonhoeffer T, Grinvald A. Iso-orientation domains in cat visual cortex are arranged in pinwheel-like patterns. Nature. 1991;353:429. doi: 10.1038/353429a0. [DOI] [PubMed] [Google Scholar]
- 7.Chen-Bee CH, Agoncillo T, Lay CC, Frostig RD. Intrinsic signal optical imaging of brain function using short stimulus delivery intervals. J Neurosci Methods. 2010;30187:171. doi: 10.1016/j.jneumeth.2010.01.009. [DOI] [PMC free article] [PubMed] [Google Scholar]
- 8.Chen Y, Aguirre AD, Ruvinskaya L, Devor A, Boas DA, Fujimoto JG. Optical coherence tomography (OCT) reveals depth-resolved dynamics during functional brain activation. J Neurosci Methods. 2009;178:162. doi: 10.1016/j.jneumeth.2008.11.026. [DOI] [PMC free article] [PubMed] [Google Scholar]
- 9.Chen JWY, O'Farrell AM, Toga AW. Optical intrinsic signal imaging in a rodent seizure model. Neurology. 2000;55:312. doi: 10.1212/wnl.55.2.312. [DOI] [PubMed] [Google Scholar]
- 10.Chery R, L'Heureux B, Bendahmane M, Renaud R, Martin C, Pain F, Gurden H. Imaging odor-evoked activities in the mouse olfactory bulb using optical reflectance and autofluorescence signals. J Vis Exp. 2011;e3336 doi: 10.3791/3336. [DOI] [PMC free article] [PubMed] [Google Scholar]
- 11.Culver JP, Durduran T, Furuya D, Cheung C, Greenberg JH, Yodh AG. Diffuse optical tomography of cerebral blood flow, oxygenation, and metabolism in rat during focal ischemia. J Cereb Blood Flow Metab. 2003;23:911. doi: 10.1097/01.WCB.0000076703.71231.BB. [DOI] [PubMed] [Google Scholar]
- 12.Dawitz J, Kroon T, Hjorth JJ, Meredith RM. Functional calcium imaging in developing cortical networks. J Vis Exp. 2011;3550 doi: 10.3791/3550. [DOI] [PMC free article] [PubMed] [Google Scholar]
- 13.Darmo J, Tamosiunas V, Fasching G, Kröll J, Unterrainer K, Beck M, Giovannini M, Faist J, Kremser C, Debbage P. Imaging with a terahertz quantum cascade laser. Opt Express. 2004;12:1879. doi: 10.1364/opex.12.001879. [DOI] [PubMed] [Google Scholar]
- 14.Devor A, Hillman EM, Tian P, Waeber C, Teng IC, Ruvinskaya L, Shalinsky MH, Zhu H, Haslinger RH, Narayanan SN, Ulbert I, Dunn AK, Lo EH, Rosen BR, Dale AM, Kleinfeld D, Boas DA. Stimulus-induced changes in blood flow and 2-deoxyglucose uptake dissociate in ipsilateral somatosensory cortex. J Neurosci. 2008;28:14347. doi: 10.1523/JNEUROSCI.4307-08.2008. [DOI] [PMC free article] [PubMed] [Google Scholar]
- 15.Devor A, Sakadzic S, Srinivasan VJ, Yaseen MA, Nizar K, Saisan PA, Tian P, Dale AM, Vinogradov SA, Franceschini MA, Boas DA. Frontiers in optical imaging of cerebral blood flow and metabolism. J Cereb Blood Flow Metab. 2012;32:1259. doi: 10.1038/jcbfm.2011.195. [DOI] [PMC free article] [PubMed] [Google Scholar]
- 16.Ferguson B, Wang S, Gray D, Abbott D, Zhang XC. Towards functional 3D T-ray imaging. Phys Med Biol. 2002;47:3735. doi: 10.1088/0031-9155/47/21/309. [DOI] [PubMed] [Google Scholar]
- 17.Ferrari M, Quaresima V. A brief review on the history of human functional near-infrared spectroscopy (fNIRS) development and fields of application. Neuroimage. 2012;3 doi: 10.1016/j.neuroimage.2012.03.049. [DOI] [PubMed] [Google Scholar]
- 18.Gratton G, Fabiani M. Fast optical imaging of human brain function. Front Hum Neurosci. 2010;234:52. doi: 10.3389/fnhum.2010.00052. [DOI] [PMC free article] [PubMed] [Google Scholar]
- 19.Grinvald A, Hildesheim R. VSDI: A new era in functional imaging of cortical dynamics. Nat Rev Neurosci. 2004;5:874. doi: 10.1038/nrn1536. [DOI] [PubMed] [Google Scholar]
- 20.Haglund MM, Hochman DW. Imaging of intrinsic optical signals in primate cortex during epileptiform activity. Epilepsia. 2007;48:65. doi: 10.1111/j.1528-1167.2007.01243.x. [DOI] [PubMed] [Google Scholar]
- 21.Hall DJ, Han SH, Chepetan A, Inui EG, Rogers M, Dugan LL. Dynamic optical imaging of metabolic and NADPH oxidase-derived superoxide in live mouse brain using fluorescence lifetime unmixing. J Cereb Blood Flow Metab. 2012;32:23. doi: 10.1038/jcbfm.2011.119. [DOI] [PMC free article] [PubMed] [Google Scholar]
- 22.Hackett TA, Barkat TR, O'Brien BM, Hensch TK, Polley DB. Linking topography to tonotopy in the mouse auditory thalamocortical circuit. J Neurosci. 2011;2331:2983. doi: 10.1523/JNEUROSCI.5333-10.2011. [DOI] [PMC free article] [PubMed] [Google Scholar]
- 23.Hillman EM, Elson DS, Bigio IJ, Levenson RM, So PT. Advances in optics for biotechnology, medicine and surgery. Biomed Opt Express. 2012;13:531. doi: 10.1364/BOE.3.000531. [DOI] [PMC free article] [PubMed] [Google Scholar]
- 24.Hirase H, Creso J, Buzsaki G. Capillary level imaging of local cerebral blood flow in bicuculline-induced epileptic foci. Neu-roscience. 2004;128:209. doi: 10.1016/j.neuroscience.2004.07.002. [DOI] [PubMed] [Google Scholar]
- 25.Hu S, Maslov K, Tsytsarev V, Wang LV. Functional transcranial brain imaging by optical-resolution photoacoustic microscopy. J Biomed Opt. 2009;14:040503. doi: 10.1117/1.3194136. [DOI] [PMC free article] [PubMed] [Google Scholar]
- 26.Hu S, Wang LV. Neurovascular photoacoustic tomography. Front Neuroenerg. 2010;2:10. doi: 10.3389/fnene.2010.00010. [DOI] [PMC free article] [PubMed] [Google Scholar]
- 27.Imamura K, Tanaka S, Ribot J, Kobayashi M, Yamamoto M, Nakadate K, Watanabe Y. Preservation of functional architecture in visual cortex of cats with experimentally induced hydrocephalus. Eur J Neurosci. 2006;23:2087. doi: 10.1111/j.1460-9568.2006.04729.x. [DOI] [PubMed] [Google Scholar]
- 28.Inyushin MY, Volnova AB, Lenkov DN. Use of a simplified method of optical recording to identify foci of maximal neuron activity in the somatosensory cortex of white rats. Neurosci Behav Physiol. 2001;31:201. doi: 10.1023/a:1005272526284. [DOI] [PubMed] [Google Scholar]
- 29.Jin KH, Kim Y, Yee DS, Lee OK, Ye JC. Compressed sensing pulse-echo mode terahertz reflectance tomography. Opt Lett. 2009;1534:3863. doi: 10.1364/OL.34.003863. [DOI] [PubMed] [Google Scholar]
- 30.Lamy CM, Chatton JY. Optical probing of sodium dynamics in neurons and astrocytes. Neuroimage. 2011;58:572. doi: 10.1016/j.neuroimage.2011.06.074. [DOI] [PubMed] [Google Scholar]
- 31.Liao LD, Lin CT, Shih YY, Duong TQ, Lai HY, Wang PH, Wu R, Tsang S, Chang JY, Li ML, Chen YY. Transcranial imaging of functional cerebral hemodynamic changes in single blood vessels using in vivo photoacoustic microscopy. J Cereb Blood Flow Metab. 2012;32:938. doi: 10.1038/jcbfm.2012.42. [DOI] [PMC free article] [PubMed] [Google Scholar]
- 32.Liao LD, Lin CT, Shih YY, Lai HY, Zhao WT, Duong TQ, Chang JY, Chen YY, Li ML. Investigation of the cerebral hemodynamic response function in single blood vessels by functional photoacoustic microscopy. J Biomed Opt. 2012;17:061210. doi: 10.1117/1.JBO.17.6.061210. [DOI] [PMC free article] [PubMed] [Google Scholar]
- 33.Liao LD, Li ML, Lai HY, Shih YYI, Lo YC, Tsang S, Chao PCP, Lin CT, Jaw FS, Chen YY. Imaging brain hemodynamic changes during rat forepaw electrical stimulation using functional photoacoustic microscopy. NeuroImage. 2010;1552:562. doi: 10.1016/j.neuroimage.2010.03.065. [DOI] [PubMed] [Google Scholar]
- 34.Looger LL, Griesbeck O. Genetically encoded neural activity indicators. Curr Opin Neurobiol. 2012;22:18. doi: 10.1016/j.conb.2011.10.024. [DOI] [PubMed] [Google Scholar]
- 35.Ma H, Zhao M, Suh M, Schwartz TH. Hemodynamic surrogates for excitatory membrane potential change during interictal epileptiform events in rat neocortex. J Neurophysiol. 2009;101:2550. doi: 10.1152/jn.90694.2008. [DOI] [PMC free article] [PubMed] [Google Scholar]
- 36.Maheswari RU, Takaoka H, Kadono H, Homma R, Tanifuji M. Novel functional imaging technique from brain surface with optical coherence tomography enabling visualization of depth resolved functional structure in vivo. J Neurosci Methods. 2003;124:83. doi: 10.1016/s0165-0270(02)00370-9. [DOI] [PubMed] [Google Scholar]
- 37.Maslov K, Stoica G, Wang LW. In vivo dark-field reflection-mode photoacoustic microscopy. Opt Lett. 2005;30:625. doi: 10.1364/ol.30.000625. [DOI] [PubMed] [Google Scholar]
- 38.Masson JB, Sauviat MP, Martin JL, Gallot G. Ionic contrast terahertz near-field imaging of axonal water fluxes. Proc Natl Acad Sci USA. 2006;103:4808. doi: 10.1073/pnas.0510945103. [DOI] [PMC free article] [PubMed] [Google Scholar]
- 39.Mishra AM, Bai H, Gribizis A, Blumenfeld H. Neuroimaging biomarkers of epileptogenesis. Neurosci Lett. 2011;497:194. doi: 10.1016/j.neulet.2011.01.076. [DOI] [PMC free article] [PubMed] [Google Scholar]
- 40.Obaid AL, Salzberg BM. Optical recording of electrical activity in guinea-pig enteric networks using voltage-sensitive dyes. J Vis Exp. 2009;4:1631. doi: 10.3791/1631. [DOI] [PMC free article] [PubMed] [Google Scholar]
- 41.Ochs RF, Gloor P, Tyler JL, Wolfson T, Worsley K, Andermann F, Diksic M, Meyer E, Evans A. Effect of generalized spike-and-wave discharge on glucose metabolism measured by positron emission tomography. Ann Neurol. 1987;21:458. doi: 10.1002/ana.410210508. [DOI] [PubMed] [Google Scholar]
- 42.Osharina V, Ponchel E, Aarabi A, Grebe R, Wallois F. Local haemodynamic changes preceding interictal spikes: A simultaneous electrocorticography (ECoG) and near-infrared spectroscopy (NIRS) analysis in rats. Neuroimage. 2010;50:600. doi: 10.1016/j.neuroimage.2010.01.009. [DOI] [PubMed] [Google Scholar]
- 43.Palacios T, Celis-Lopez G, Larraga-Gutirrez M, Garcia-Garduro GM, Zapata-Nava OJ, Diaz A, Ordura A, Torres-Jacome A, de-la-Hidalga-Wade J, Iturbe-Castillo MD. Brain Imaging Using T-Rays Instrumentation Advances AIP Conference Proceedings. 2010;1310(1):146. [Google Scholar]
- 44.Parks NA, Maclin EL, Low KA, Beck DM, Fabiani M, Gratton G. Examining cortical dynamics and connectivity with simultaneous single-pulse transcranial magnetic stimulation and fast optical imaging. Neuroimage. 2012;159:2504. doi: 10.1016/j.neuroimage.2011.08.097. [DOI] [PMC free article] [PubMed] [Google Scholar]
- 45.Perron A, Mutoh H, Launey T, Knöpfel T. Red-shifted voltage-sensitive fluorescent proteins. Chem Biol. 2009;2416:1268. doi: 10.1016/j.chembiol.2009.11.014. [DOI] [PMC free article] [PubMed] [Google Scholar]
- 46.Rector DM, Rogers RF, Schwaber JS, Harper RM, George JS. Scattered-light imaging in vivo tracks fast and slow processes of neurophysiological activation. Neuroimage. 2001;14:977. doi: 10.1006/nimg.2001.0897. [DOI] [PubMed] [Google Scholar]
- 47.Reinert KC, Gao W, Chen G, Wang X, Peng YP, Ebner TJ. Cellular and metabolic origins of flavoprotein autofluorescence in the cerebellar cortex in vivo. Cerebellum. 2011;10:585. doi: 10.1007/s12311-011-0278-x. [DOI] [PMC free article] [PubMed] [Google Scholar]
- 48.Roche-Labarbe N, Zaaimi B, Berquin P, Nehlig A, Grebe R, Wallois F. NIRS-measured oxy- and deoxyhemoglobin changes associated with EEG spike-and-wave discharges in children. Epilepsia. 2008;49:1871. doi: 10.1111/j.1528-1167.2008.01711.x. [DOI] [PubMed] [Google Scholar]
- 49.Roche-Labarbe N, Zaaimi B, Mahmoudzadeh M, Osharina V, Wallois A, Nehlig A, Grebe R, Wallois F. NIRS-measured oxy- and deoxyhemoglobin changes associated with EEG spike-and-wave discharges in a genetic model of absence epilepsy: The GAERS. Epilepsia. 2010;51:1374. doi: 10.1111/j.1528-1167.2010.02574.x. [DOI] [PubMed] [Google Scholar]
- 50.Santisakultarm TP, Schaffer CB. Optically quantified cerebral blood flow. J Cereb Blood Flow Metab. 2011;31:1337. doi: 10.1038/jcbfm.2011.18. [DOI] [PMC free article] [PubMed] [Google Scholar]
- 51.Schei JL, McCluskey MD, Foust AJ, Yao XC, Rector DM. Action potential propagation imaged with high temporal resolution near-infrared video microscopy and polarized light. Neuroim-age. 2008;40:1034. doi: 10.1016/j.neuroimage.2007.12.055. [DOI] [PMC free article] [PubMed] [Google Scholar]
- 52.Shimazawa M, Ito Y, Inokuchi Y, Yamanaka H, Nakanishi T, Hayashi T, Ji B, Higuchi M, Suhara T, Imamura K, Araie M, Watanabe Y, Onoe H, Hara H. An alteration in the lateral geniculate nucleus of experimental glaucoma monkeys: In vivo positron emission tomography imaging of glial activation. PLoS One. 2012;7:e30526. doi: 10.1371/journal.pone.0030526. [DOI] [PMC free article] [PubMed] [Google Scholar]
- 53.Schwartz RD, Yu X. Optical imaging of intracellular chloride in living brain slices. J Neurosci Methods. 1995;62:185. doi: 10.1016/0165-0270(95)00075-5. [DOI] [PubMed] [Google Scholar]
- 54.Schwartz TH, Bonhoeffer T. In vivo optical mapping of epileptic foci and surround inhibition in ferret cerebral cortex. Nature Med. 2000;7:1063. doi: 10.1038/nm0901-1063. [DOI] [PubMed] [Google Scholar]
- 55.Stein EW, Maslov KI, Wang LV, Noninvasive J. In vivo imaging of blood-oxygenation dynamics within the mouse brain using photoacoustic microscopy (Journal Letter) Biomed Opt. 2009;14:020502. doi: 10.1117/1.3095799. [DOI] [PMC free article] [PubMed] [Google Scholar]
- 56.Steinbrink J, Liebert A, Wabnitz H, Macdonald R, Obrig H, Wunder A, Bourayou R, Betz T, Klohs J, Lindauer U, Dirnagl U, Villringer A. Towards noninvasive molecular fluorescence imaging of the human brain. Neurodegener Dis. 2008;5:296. doi: 10.1159/000135614. [DOI] [PubMed] [Google Scholar]
- 57.Tanaka S, Tani T, Ribot J, Yamazaki T. Chronically mountable goggles for persistent exposure to single orientation. J Neurosci Methods. 2007;15160:206. doi: 10.1016/j.jneumeth.2006.09.004. [DOI] [PubMed] [Google Scholar]
- 58.Tani T, Ribot J, O'Hashi K, Tanaka S. Parallel development of orientation maps and spatial frequency selectivity in cat visual cortex. Eur J Neurosci. 2012;35:44. doi: 10.1111/j.1460-9568.2011.07954.x. [DOI] [PubMed] [Google Scholar]
- 59.Tohmi M, Takahashi K, Kubota Y, Hishida R, Shibuki K. Transcranial flavoprotein fluorescence imaging of mouse cortical activity and plasticity. J Neurochem. 2009;109:3. doi: 10.1111/j.1471-4159.2009.05926.x. [DOI] [PubMed] [Google Scholar]
- 60.Tommerdahl M, Favorov OV, Whitsel BL. Dynamic representations of the somatosensory cortex. Neurosci Biobehav Rev. 2009;34:160. doi: 10.1016/j.neubiorev.2009.08.009. [DOI] [PubMed] [Google Scholar]
- 61.Tsytsarev V, Fukuyama H, Pope D, Pumbo E, Kimura M. Optical imaging of interaural time difference representation in rat auditory cortex. Frontiers in Neuroengineering. 2009;2:1. doi: 10.3389/neuro.16.002.2009. [DOI] [PMC free article] [PubMed] [Google Scholar]
- 62.Tsytsarev V, Pope D, Pumbo E, Yablonskii A, Hofmann M. Study of the cortical representation of whisker directional deflection using voltage-sensitive dye optical imaging. Neuroimage. 2010;53:233. doi: 10.1016/j.neuroimage.2010.06.022. [DOI] [PubMed] [Google Scholar]
- 63.Tsytsarev V, Hu S, Yao J, Maslov K, Barbour DL, Wang LV. Photoacoustic microscopy of microvascular responses to cortical electrical stimulation. J Biomed Opt. 2011a;16:076002. doi: 10.1117/1.3594785. [DOI] [PMC free article] [PubMed] [Google Scholar]
- 64.Tsytsarev V, Maslov KI, Yao J, Parameswar AR, Demchenko AV, Wang LV. In vivo imaging of epileptic activity using 2-NBDG, a fluorescent deoxyglucose analog. J Neurosci Methods. 2011b;203:136. doi: 10.1016/j.jneumeth.2011.09.005. [DOI] [PMC free article] [PubMed] [Google Scholar]
- 65.Tsytsarev V, Premachandra K, Takeshita D, Bahar S. Imaging cortical electrical stimulation in vivo: Fast intrinsic optical signal versus voltage-sensitive dyes. Opt Lett. 2008;33:1032. doi: 10.1364/ol.33.001032. [DOI] [PubMed] [Google Scholar]
- 66.Yamada K, Saito M, Matsuoka H, Inagaki N. A real-time method of imaging glucose uptake in single, living mammalian cells. Nat Protoc. 2007;2:753. doi: 10.1038/nprot.2007.76. [DOI] [PubMed] [Google Scholar]
- 67.Yao J, Xia J, Maslov KI, Nasiriavanaki M, Tsytsarev V, Demchenko AV, Wang LV. Noninvasive photoacoustic computed tomography of mouse brain metabolism in vivo. Neuroimage. 2012 doi: 10.1016/j.neuroimage.2012.08.054. Epub ahead of print. [DOI] [PMC free article] [PubMed] [Google Scholar]
- 68.Yokoo T, Knight BW, Sirovich L. An optimization approach to signal extraction from noisy multivariate data. Neuroimage. 2001;14:1309. doi: 10.1006/nimg.2001.0950. [DOI] [PubMed] [Google Scholar]
- 69.Uematsu M, Haginoya K, Togashi N, Hino-Fukuyo N, Nakayama T, Kikuchi A, Abe Y, Wakusawa K, Matsumoto Y, Kakisaka Y, Kobayashi T, Hirose M, Yokoyama H, Iinuma K, Iwasaki M, Nakasato N, Kaneta T, Akasaka M, Kamei A, Tsuchiya S. Unique discrepancy between cerebral blood flow and glucose metabolism in hemimegalencephaly. Epilepsy Res. 2010;92:201. doi: 10.1016/j.eplepsyres.2010.09.010. [DOI] [PubMed] [Google Scholar]
- 70.Wallois F, Patil A, Heberle C, Grebe R. EEG-NIRS in epilepsy in children and neonates. Neurophysiol Clin. 2010;40:281. doi: 10.1016/j.neucli.2010.08.004. [DOI] [PubMed] [Google Scholar]
- 71.Wang X, Pang Y, Ku G, Xie X, Stoica G, Wang LV. Non-invasive laser-induced photoacoustic tomography for structural and functional in vivo imaging of the brain. Nat Biotechnol. 2003;21:803. doi: 10.1038/nbt839. [DOI] [PubMed] [Google Scholar]
- 72.Watanabe E, Nagahori Y, Mayanagi Y. Focus diagnosis of epilepsy using near-infrared spectroscopy. Epilepsia. 2002;43:50. doi: 10.1046/j.1528-1157.43.s.9.12.x. [DOI] [PubMed] [Google Scholar]
- 73.Salzberg BM. Optical recording of electrical activity. J Membr Biol. 2005;208:89. doi: 10.1007/s00232-005-0821-0. [DOI] [PubMed] [Google Scholar]
- 74.Zhang XC. Terahertz wave imaging: Horizons and hurdles. Phys Med Biol. 2002;47:3667. doi: 10.1088/0031-9155/47/21/301. [DOI] [PubMed] [Google Scholar]
- 75.Zhang F, Wang LP, Boyden ES, Deisseroth K. Channelrhodopsin-2 and optical control of excitable cells. Nature Methods. 2006;3:785. doi: 10.1038/nmeth936. [DOI] [PubMed] [Google Scholar]