Abstract
Radiofrequency catheter ablation procedures are a first-line method of clinical treatment for atrial fibrillation. However, they suffer from suboptimal success rates and are also prone to potentially serious adverse effects. These limitations can be at least partially attributed to the inter- and intra- patient variations in atrial wall thickness, and could be mitigated by patient-specific approaches to the procedure.
In this study, a modelling approach to optimising ablation procedures in subject-specific 3D atrial geometries was applied. The approach enabled the evaluation of optimal ablation times to create lesions for a given wall thickness measured from MRI. A nonliner relationship was revealed between the thickness and catheter contact time required for fully transmural lesions. Hence, our approach based on MRI reconstruction of the atrial wall combined with subject-specific modelling of ablation can provide useful information for improving clinical procedures.
I. Introduction
Atrial fibrillation (AF) is the most common cardiac arrhythmia. Effects of AF include a decreased quality of life and more serious morbidities including the increased risk of stroke [1]. While the underlying mechanisms of AF are not completely understood, the arrhythmia is known to arise from irregular electrical activity in the atria. Ultimately, clinical treatments of AF aim to target this irregular activity.
Radiofrequency catheter ablation (RFCA) procedures are one such treatment. An ablation catheter is used to produce electrically inert, transmural lesions in the myocardium to isolate or remove areas contributing to the generation or maintenance of the activity sustaining AF. However, RFCA procedures are not always effective in treating AF. Thus, when considering paroxysmal AF, the success rates for pulmonary vein isolations (PVI) are between 38-70% after a single procedure, or 65-90% after repeated procedures [2]. For persistent cases of AF, PVI alone is not sufficient and further areas of the atrial wall are targeted. Moreover, RFCA procedures are not without risks, and major complications have been found to occur in 4.5% of patients [3].
High inter- and intra- patient variations in atrial wall thickness (AWT) presents a major issue when creating the transmural lesions required for effective RFCA treatments. Patient-specific knowledge of AWT could provide clinicians with useful information to optimise the ablation procedure by using the minimal amount of RF energy, thereby improving the efficacy of the procedure by ensuring the optimal catheter contact time to achieve lesion transmurality. Furthermore, patient-specific knowledge could also reduce the risk of complications. For example, PV stenosis can be avoided by minimising catheter contact time at target areas of the atrial wall to ensure temperatures stay below noted risk levels [4].
Such a patient-specific approach requires information of the AWT variations throughout the atria. Until recently, the existing medical imaging modalities failed to provide detailed AWT information for human subjects. However, recent developments of novel magnetic resonance imaging (MRI) protocols have enabled detailed AWT reconstruction [5]. This opens up new pathways towards the patient-specific evaluation and prediction of thermal effects during RFCA. Since testing of novel approaches in a clinical setting can be extremely difficult, computational modelling has emerged as an increasingly accepted method of virtual evaluation [6].
This study aims to apply computational modelling to simulate RFCA of subject-specific atrial wall geometries [5]. This will provide novel information on the catheter contact time required to achieve transmural ablation lesions in atrial tissue with different thicknesses. Thus, the optimal time for producing fully transmural ablation lesions will be found for specific AWT. Finally, a PVI procedure will be simulated on a realistic atrial geometry to test the efficacy in the model. The model predictions could potentially be used to develop patient-specific approaches to RFCA procedures in the clinic.
II. Methods
A. 3D atrial geometry reconstruction
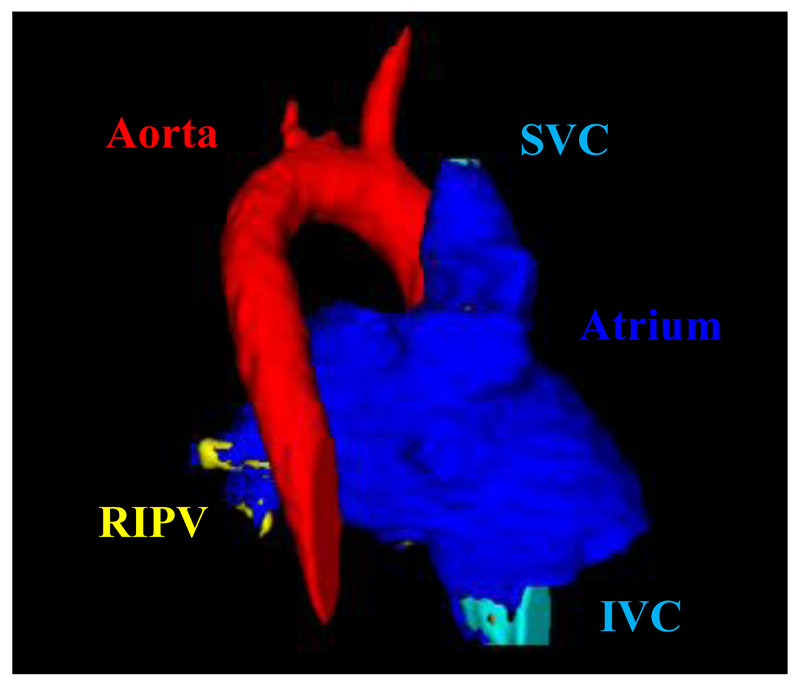
A healthy volunteer was imaged in a Phillips 3T Achieva scanner [5]. Images were acquired in a para-axial plane using a black blood PSIR sequence with 1.4-mm isotropic resolution. Cardiac triggering was performed in late atrial diastole, which was identified from the visual inspection of a 4-chamber CINE image, as is commonly done in the clinical setting. The images were manually segmented using ITK snap, and in-house Matlab scripts were then utilised to process and interpolate the segmented data to produce a higher 0.47mm3 resolution 3D atrial geometry (Figure 1). The latter was used as the basis for the 3D model for ablation (see below), providing a subject-specific AWT distribution.
Fig. 1.
Illustration of the final segmentation of the subject-specific atrial MRI scan. Dark blue sections represent the atrial walls, the red section represents the aorta (partially obscured by the superior vena cava, SVC), the yellow sections (left) show the branching right inferior pulmonary vein (RIPV) and the light blue section represents the inferior vena cava (IVC).
B. Model development and validation
The ablation procedure was modelled in two stages. Firstly, the propagation of heat throughout the tissue due to the ablation catheter was computed by solving the modified Pennes bioheat equation in the following form [7,8]:
| (1) |
Here ρ is the density of the tissue (kg/m3), c is the specific heat capacity of the tissue (J/kg·K), k is the thermal conductivity of the tissue (W/m·K), qcatheter is the heat applied by the catheter (W/m3), Qp is the perfusion heat loss (W/m3) and Qm is the metabolic heat gain (W/m3). Qm and Qp were omitted due to their negligible magnitude.
In Equation 1, qcatheter was calculated using the Laplace equation with the tissue electrical conductivity σ (S/m):
| (2) |
The equations were solved using the finite differences method on the reconstructed 3D atrial geometry, with a spatial step of 0.47mm and a temporal step of 5ms. Further to this, the tissue geometries were initialised with a uniform temperature of 310.15K and uniform potential of 0V. The catheter was modelled based on a 7-french geometry (2.33 mm diameter), matching both clinical standards and previous studies [7,8]. The catheter was modelled as perpendicular to the endocardial tissue surface, which produced radially symmetric ablation and heat propagation patterns.
To model tissue damage, the Arrhenius method was used:
| (3) |
Here the integral limits are over the time period of ablation, A is the rate factor measuring molecular collisions (s-1), ΔE is the energy barrier the tissue must overcome to be denatured (J/mol), R is the gas constant (8.3134 J/mol·K), T and is the temperature of the tissue (K). Ω(t) is a dimensionless value, and can be interpreted as the logarithmic ratio between the initial volume of undamaged tissue and the volume of damaged tissue at time t. An Ω-value of 1 or greater signifies 63% irreversible tissue damage, while a value greater than 4.3 signifies 99% irreversible tissue damage [9]. This equation was solved concurrently with Equation 1 for T.
The Arrhenius method was preferred over temperature isotherms, as the latter method has been demonstrated to overestimate the lesion size [10]. More crucially, the parameters affecting lesion growth (A and ΔE) could be sourced from literature enabling the model to be tuned to produce ablation times in accordance with empirical data, specifically ablation times between 30s and 60s [11].
Table 1 shows the values of physical constants utilized by this model, which were taken from previous studies [12,13].
Table I.
Physical constants used in the model
| Physical constants | |||||
|---|---|---|---|---|---|
|
ρ (kg·m-3) |
c (J/kg·K) |
k (W/m·K) |
σ (S/m) |
A (s-1) |
ΔE (J/mol) |
| 1200 | 3200 | 0.550 | 0.222 | 1.28×10²² | 145 000 |
The model was initially validated using a 26.32mm square slab of atrial wall adjacent to the right inferior PV. This was due to the section being a typical example of a realistic ablation target in a clinical environment. The temperature propagation was tested before implementing the damage modelling, and the ablation times were tested against clinical data to ensure the efficacy of the model. The appropriate values for A and ΔE were found at this point to ensure that damaged tissue with Ω(t) ≥ 1 corresponded to 323.15K tissue temperatures and ablation times between 30s and 60s. Thus, the model parameters and outcomes on test simulations in atrial slabs were in agreement with previous studies [7,8].
Note that this model did not include cooling effects from the blood flow in the atria, and also kept the electrical conductivity of the tissue constant throughout. While these can be physically significant [14], this was done to keep the model simple and focus on the effects of atrial geometry.
C. Simulation of ablation in atrial slabs
To explore relationships between the AWT and catheter contact time, 3D atrial slabs were generated at thicknesses ranging from 0.94mm to 5.64mm, in increments of 0.47mm. These values corresponded to the AWT measurements in the reconstructed subject-specific atrial geometry. The catheter was applied at the centre of the top surface of each slab, and a marker point on the opposite side was monitored to check its temperature and Ω-value, so as to flag when the lesion had reached transmurality (with Ω(t) ≥ 1). The ablation simulation for each AWT ran for an arbitrarily long period of time to allow for this to happen, with a constant catheter voltage of 10V, and an effective catheter depth of 0.47mm.
Similar simulations of transmural lesions were then run on 3D atrial slabs extracted from representative locations in the subject-specific 3D atria reconstruction (see Figure 2).
Fig. 2.
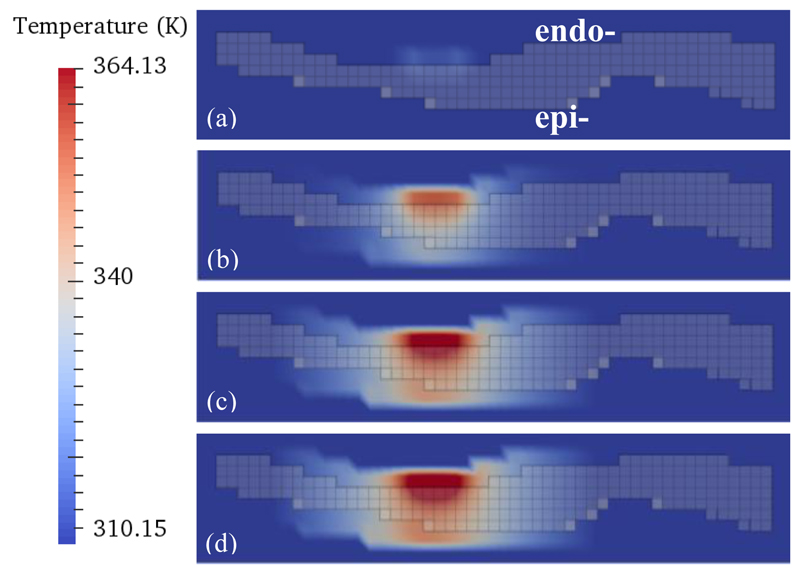
Heat distribution maps for the subject-specific 3D atrial geometry. One section of atrial wall is shown (viewed transmurally) with the addition of a catheter at the top (endocardial surface). The temperature scale is shown on the left. Different moments of time throughout the ablation simulation are shown: (a) 1 second, (b) 25 seconds, (c) 75 seconds and (d) 100 seconds. The semi-transparent grey grid shows the transmural cross section of the atrial wall. Bright red corresponds to the increasingly heated catheter and lighter red shows the heat spreading through the wall and also into boundary layers.
D. Simulation of pulmonary vein isolation
The right inferior PV was targeted in the simulated PVI. Ablation points were selected to replicate a realistic clinical procedure, with the points close enough to one another to enclose the RIPV completely, while also maintaining some distance from the PV ostium. From a clinical viewpoint, this is done to enclose more potential AF triggers or re-entry areas while also mitigating the risk of PV stenosis. The catheter was applied at each point on the endocardial surface with a constant voltage of 10V. A congruent monitoring point was then selected on the epicardial surface to flag when the ablation had reached full transmurality, and the simulation ran for each point until this had been achieved. Note that each ablation point was simulated independently of the others.
III. Results
A. Ablation of realistic atrial geometries
Figure 1 shows the segmented 3D atrial geometry that proved a good platform for the computational framework. Only the left atrium and PVs were used for the ablation simulations, since these are the most common targets for clinical RFCA [1]. AWT computed in these regions ranged from 1mm in distal PVs to 5mm in the left atrial appendage, which was in good agreement with anatomical knowledge.
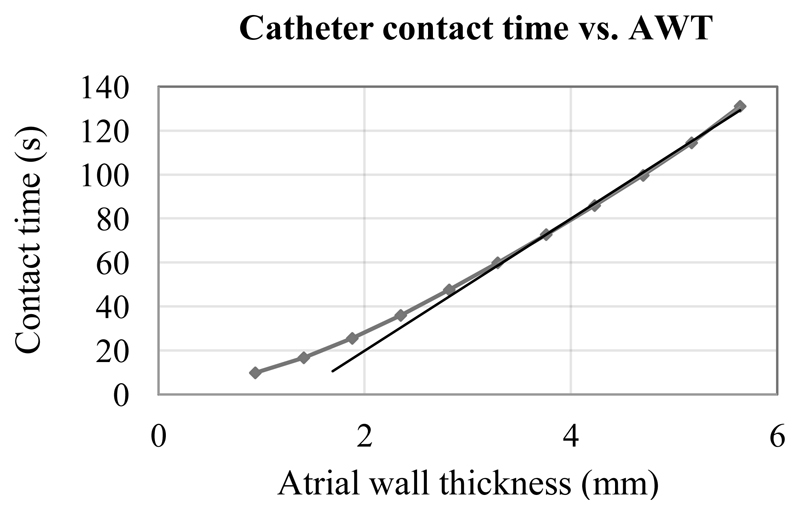
Figure 2 illustrates the temperature distribution during several time steps of a simulated ablation procedure. During ablation of a region of the atrial wall with an average AWT of about 4 mm, a fully transmural lesion was formed after about 75ms (Figure 2c). This is in agreement with the respective results obtained for atrial slabs of varying uniform thickness (Figure 3). The lesion was substantially wider at the endocardial surface where the catheter was applied, with quasi-spherical heat propagation through the wall resulting in a narrow lesion on the opposite epicardial side (Figure 2c). The lesion widths became more uniform on both surfaces (i.e., fully transmural) after about 100ms (Figure 2d).
Fig. 3.
Catheter contact time required for transmural lesion formation for different tissue thicknesses. Data points come from simulations of 3D atrial slabs of varying thickness, and results of simulating 3D slabs taken from the subject-specific atrial geometry fall onto the same curve (see Figure 2). The straight line represents a linear trend for the AWT values above 3mm.
Note that, when viewed from the surface, the lesion exhibited radial symmetry about the catheter centre point, as expected (not shown). The glowing effect at the borders of the atrial tissue (Figure 2) was a result of the implementation of the zero-flux boundary conditions, where temperature at the boundary was designated the same value as the adjacent tissue temperature, ensuring no temperature flux through the tissue surface. In real atria, such an effect would correspond to the heat spread into the adjacent pericardium and blood.
An optimal catheter voltage of 10V was found to produce realistic heat spread and tissue damage parameters, as well as the most efficient ablation times [13]. These results effectively validate the choice of model parameters.
B. Catheter contact time vs. tissue thickness
The simulated relationship between the catheter contact time required for lesion transmurality and AWT is shown in Figure 3. The relationship is nonlinear, showing a linear phase only for relatively thick walls, but increasingly diverging from a straight line as the wall thickness decreases. The nonlinear phase becomes especially apparent for AWT below 3mm. Since the average thickness of the left atrial wall is about 2mm [5,15], an assumption about a simple linear relationship between the AWT and contact time relation cannot be used for most clinically relevant situations.
Note that the simulated ablation times per tissue point are in the range from 10 to 130 ms, depending on AWT. These are much faster than the actual ablation times in a clinical setting. Note also that the electrical tissue conductivity can increase by 1.5-2% for every 1 degree rise in temperature [16]. If this behaviour had been accounted for in this study, this would have lead to an even faster rate of lesion formation. This provides further evidence to the fact that clinical RFCA procedures may not be time-efficient, and that the knowledge of AWT can be used to optimise them.
C. Simulation of pulmonary vein isolation
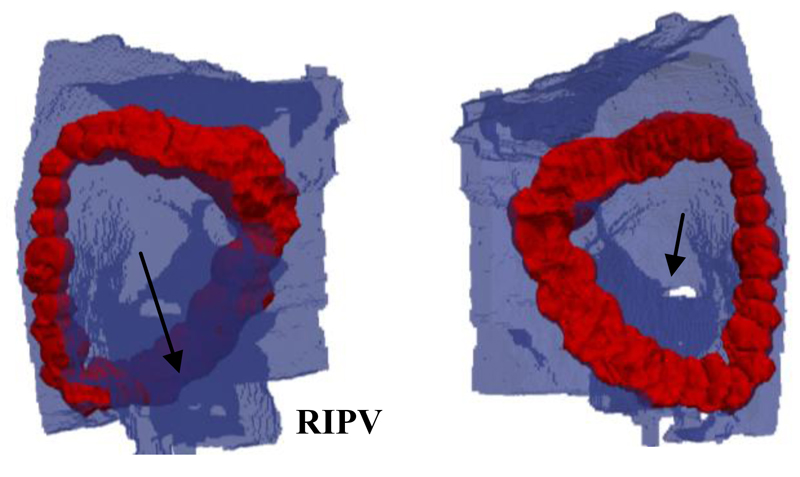
Figure 4 shows the results of simulating PVI procedures in the realistic subject-specific 3D atrial geometry. In the simulations, the RIPV was fully isolated within about 30 minutes of catheter contact time. This is substantially faster than clinical RFCA procedures blinded to AWT. The simulation produced continuous, fully transmural lesions isolating the PV. It should be noted that the lesion widths at points of high AWT became relatively large (about 10mm). This was a natural consequence of the longer ablation times required for achieving the lesion transmurality, combined with the radially symmetric growth of the lesions. In the clinic this could have adverse effects on the mechanical properties of the atrium, such as decreased tissue elasticity.
Fig. 4.
Result of the PVI simulation in the subject-specific 3D atrial model. The blue areas represent the atrial wall, while the red areas represent lesion tissue where Ω(t) ≥ 1. The right panel shows the epicardial view and the left panel shows the endocardial view, and the respective two arrows show the right inferior pulmonary vein (RIPV) and the ostium of the RIPV.
IV. Conclusion
We developed a modelling approach to optimising RFCA in subject-specific 3D atrial geometries (Figure 1). The approach enabled measuring the optimal ablation times to achieve lesions with sufficient tissue transmurality for a given AWT (Figure 2). Moreover, we found a qualitative relationship between the AWT and catheter contact time required to create transmural lesions. The relationship is nonlinear, with a substantial divergence from a straight line for AWT below 3mm (Figure 3). Since AWT information can be obtained from subject-specific MRI [5], utilizing such information during a clinical RFCA procedure has a potential to improve its efficacy, as well as minimise the related risks.
Similar MRI techniques can easily be applied to measure AWT in AF patients after their cardioversion to sinus rhythm, which is commonly performed before ablation procedures. Computed tomography may also provide information about AWT, but this modality is prone to poor soft tissue contrast.
In proof-of-concept simulations, we also evaluated ablation patterns required for subject-specific PVI (Figure 4), with estimates of the procedure time and tissue damage. The simulated procedures were relatively quick (~30 minutes), although the fully transmural lesions were achieved at an inevitable price of wide lesions in regions of high AWT. While the model had its limitations, it did demonstrate the viability of patient-specific evaluation of RFCA procedures, which could provide useful information for the clinic and ultimately lead to the improved clinical treatment of AF.
Limitations of the model include disregarding cooling effects by the blood in the atria, which may lead to a decrease of the lesion formation times [14], as well as the use of one specific catheter geometry [7,8]. A study by Gallagher et al. [7] has suggested that changing the catheter depth and angle would vary the ratio of the lesion depth to the lesion width. This would more accurately model a real ablation scenario where a 90° contact angle (as used in our study) is not always implemented or feasible. Addressing these two limitations in future studies could help to find optimal clinical strategies for creating transmural lesions with the optimal time and minimal amount of tissue damage.
Finally, it would be useful to combine the current model with electrophysiologically and anatomically detailed 3D atrial models [6] and test the efficacy of different ablation strategies in treating the mechanistic factors underlying AF. For example, areas which demonstrate irregular electrical activity could have corresponding ablation patterns imposed on them to test customised, patient-specific RFCA therapy.
In summary, this study developed a modelling approach to optimising RFCA in subject-specific 3D atrial geometries. The results demonstrated the viability of a patient-specific evaluation of the optimal ablation times for a given atrial wall geometry, which could potentially provide clinicians with valuable data and improve the efficacy of RFCA procedures.
Acknowledgments
Research supported by the British Heart Foundation (PG/15/8/31130).
References
- [1].Camm AJ, Lip GYH, De Caterina R, Savelieva I, Atar D, Hohnloser SH, Hindricks G, Kirchhof P. 2012 focused update of the ESC Guidelines for the management of atrial fibrillation: an update of the 2010 ESC Guidelines for the management of atrial fibrillation. Eur Heart J. 2012 Oct;33:2719–47. doi: 10.1093/eurheartj/ehs253. [DOI] [PubMed] [Google Scholar]
- [2].Nademanee K, Lockwood E, Oketani N, Gidney B. Catheter ablation of atrial fibrillation guided by complex fractionated atrial electrogram mapping of atrial fibrillation substrate. J Cardiol. 2010 Jan;55:1–12. doi: 10.1016/j.jjcc.2009.11.002. [DOI] [PubMed] [Google Scholar]
- [3].Cappato R, Calkins H, Chen SA, Davies W, Iesaka Y, Kalman J, Kim YH, Klein G, Natale A, Packer D, Skanes A, et al. Updated worldwide survey on the methods, efficacy, and safety of catheter ablation for human atrial fibrillation. Circ Arrhythm Electrophysiol. 2010 Feb;3:32–38. doi: 10.1161/CIRCEP.109.859116. [DOI] [PubMed] [Google Scholar]
- [4].Kok CK, Everett TH, Akar JG, Haines DE. Effect of heating on pulmonary veins: how to avoid pulmonary vein stenosis. J Cardiovasc Electrophysiol. 2003 Mar;14:250–54. doi: 10.1046/j.1540-8167.2003.02490.x. [DOI] [PubMed] [Google Scholar]
- [5].Varela M, Kolbitsch C, Theron A, Morgan R, Henningsson M, Schaeffter T, Aslanidi O. 3D high-resolution atrial wall thickness maps using black-blood PSIR. J Cardiovasc Magn Reson. 2015 Feb;17(Suppl 1):239. [Google Scholar]
- [6].Aslanidi OV, Colman MA, Stott J, Dobrzynski H, Boyett MR, Holden AV, Zhang H. 3D virtual human atria: A computational platform for studying clinical atrial fibrillation. Prog Biophys Mol Biol. 2011 Oct;107:156–68. doi: 10.1016/j.pbiomolbio.2011.06.011. [DOI] [PMC free article] [PubMed] [Google Scholar]
- [7].Gallagher N, Fear EC, Byrd IA, Vigmond EJ. Contact geometry affects lesion formation in radio-frequency cardiac catheter ablation. PLoS ONE. 2013 Sep;8(9):e73242. doi: 10.1371/journal.pone.0073242. [DOI] [PMC free article] [PubMed] [Google Scholar]
- [8].Berjano EJ, Hornero F. Thermo-electrical modeling for epicardial atrial radiofrequency ablation. IEEE Trans Biomed Eng. 2004 Aug;51:1348–57. doi: 10.1109/TBME.2004.827545. [DOI] [PubMed] [Google Scholar]
- [9].Chang IA. Considerations for thermal injury analysis for RF ablation devices. Open Biomed Eng J. 2010 Feb;4:3–12. doi: 10.2174/1874120701004020003. [DOI] [PMC free article] [PubMed] [Google Scholar]
- [10].Chang IA, Nguyen UD. Thermal modeling of lesion growth with radiofrequency ablation devices. Biomed Eng Online. 2007 Aug;3:27. doi: 10.1186/1475-925X-3-27. [DOI] [PMC free article] [PubMed] [Google Scholar]
- [11].Gill JS. How to perform pulmonary vein isolation. Europace. 2004 Mar;6:83–91. doi: 10.1016/j.eupc.2003.12.003. [DOI] [PubMed] [Google Scholar]
- [12].Liu P, Liu J, Duab H. Thermal modeling for endocardiac radiofrequency ablation: comparison of hyperbolic bioheat equation and Pennes bioheat equation with finite element method. arXiv: 1204.0098v1. 2012 [Google Scholar]
- [13].Pearce JA, Thomsen S. Thermal damage processes in myocardium. Conf Proc IEEE Eng Med Biol Soc. 1998;20(1):256–58. [Google Scholar]
- [14].Tungjitkusolmun S, Woo EJ, Cao H, Tsai JZ, Vorperian VR, Webster JG. Thermal-electrical finite element modeling for radio frequency cardiac ablation: effects of changes in myocardial properties. Med Biol Eng Comput. 2000 Sep;38:562–68. doi: 10.1007/BF02345754. [DOI] [PubMed] [Google Scholar]
- [15].Beinart R, Abbara S, Blum A, Ferencik M, Heist K, Ruskin J, Mansour M. Left atrial wall thickness variability measured by CT scans in patients undergoing pulmonary vein isolation. J Cardiovasc Electrophysiol. 2011 Nov;22:1232–36. doi: 10.1111/j.1540-8167.2011.02100.x. [DOI] [PubMed] [Google Scholar]
- [16].Schwan HP, Foster KR. RF-fields interactions with biological systems: Electrical properties and biophysical mechanism. Proc IEEE. 1980 Jan;68:104–13. [Google Scholar]


