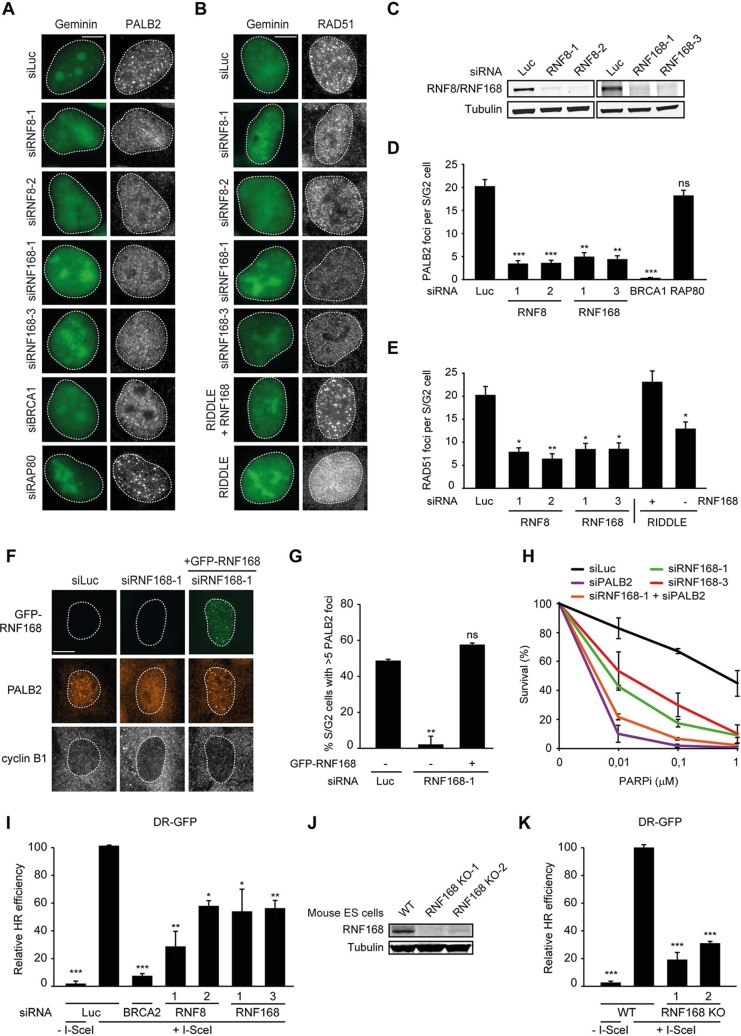
Figure 2. RNF168 promotes PALB2 and RAD51 recruitment and HR.
(A) Effect of the indicated siRNAs on PALB2 (white) IRIF formation at 6 hr after 10 Gy in mAG-geminin-expressing (green) S/G2 U2OS cells. (B) RAD51 (white) IRIF formation at 6 hr after 10 Gy in mAG-geminin-expressing (green) S/G2 U2OS cells transfected with the indicated siRNAs and in RNF168-deficient RIDDLE S/G2 cells complemented with either an empty vector or wild-type RNF168 expression vector. (C) Western blot analysis of RNF8 and RNF168 expression in U2OS cells treated with the indicated siRNAs. (D) Quantification of A. (E) Quantification of B. Indicated significance in D and E is compared to siLuc. (F) PALB2 IRIF formation (orange) in cyclin B1-positive S/G2 U2OS cells (white) transfected with the indicated siRNAs and siRNA-resistant GFP-tagged RNF168 cDNA (green). (G) Quantification of F. Indicated significance is compared to siLuc. (H) Effect of the indicated siRNAs on the survival of U2OS cells following treatment with PARP inhibitor (PARPi) KU-0058948. (I) Effect of the indicated siRNAs on HR efficiency measured using the DR-GFP reporter in human HEK293T cells. Indicated significance is compared to siLuc + I-SceI. (J) Western blot analysis of RNF168 expression in RNF168 mouse ES knock-out clones. (K) Effect of RNF168 knock-out on HR in two individual mouse ES clones with an integrated DR-GFP reporter. Indicated significance is compared to WT + I-SceI. Quantified data are represented as mean ± S.E.M. (n = 3), except in D where n = 2. Scale bar = 5 µm.


