

Abstract
Here we present two types of all-printable, highly stretchable, and inexpensive devices based on platinum (Pt)-decorated graphite for glucose determination in physiological fluids. Said devices are: a non-enzymatic sensor and an enzymatic biosensor, the latter showing promising results. Glucose has been quantified by measuring hydrogen peroxide (H2O2) reduction by chronoamperometry at -0.35 V (vs pseudo-Ag/AgCl) using glucose-oxidase immobilized on Pt-decorated graphite. The sensor performs well for the quantification of glucose in phosphate buffer solution (0.25 M PBS, pH 7.0), with a working range between 33 μM and 0.9 mM, high sensitivity and selectivity, and a low limit of detection (LOD). Thus it provides an alternative non-invasive and on-body quantification of glucose levels in human perspiration. This biosensor has been successfully applied on real human perspiration samples and results also show a significant correlation between glucose concentration in perspiration and glucose concentration in blood measured by a commercial glucose meter.
Keywords: glucose biosensor, printed electronics, stretchable device, H2O2, catalyst, perspiration
1. Introduction
Diabetes is a chronic disease with overwhelming human, social and economic consequences. It is caused by insufficient insulin production or secretion, which impedes the ability of cells to digest glucose from the blood. Seven million people develop diabetes annually and the World Health Organization (WHO) has forecast a 50% increase in the number of diabetes-related deaths over the next decade (Wang and Lee, 2015). Although there is no way to cure or prevent diabetes, appropriate monitoring and quantification of glucose levels can improve treatment efficiency and simplify patient lifestyle. As a result, there is substantial interest in electrochemical sensors for glucose detection and quantification. Most of these electrochemical sensors are enzyme-based, and depend on invasive blood sampling techniques (Cui et al., 2001; Harborn et al., 1997; Zhu et al., 2002). Even modern glucose meters, like the popular Accu-Check®, rely on the measurement on blood samples (Galant et al., 2015). The painful finger-stick is the main drawback leading to patient non-compliance and also makes it impossible to achieve real-time information required for some biomedical applications. Therefore, major scientific effort is being made to develop non-invasive glucose monitoring diagnostic tools (Liu et al., 2015; Lodgotra et al., 2016; Rabti et al., 2016). For instance, human perspiration offers valuable information about health status depending on the levels of several analytes, like lactate, ammonium, and glucose (Labroo and Cui, 2013; Mitsubayashi et al., 1994). Interestingly, glucose monitoring provides a correlation between glucose levels in blood and perspiration for diabetic patients, with concentration ranging between 10 μM and 0.7 mM, the common perspiration glucose concentrations of hypoglycaemic and hyperglycaemic patients as well as healthy people (Moyer et al., 2012; Lee et al., 2016; Sakaguchi et al., 2013).
Development of soft, stretchable and body-integrated glucose sensors has the potential to address the lack of devices for real-time monitoring of glucose levels. Taking into account that the human epidermis is continuously subjected to bending and stretching movements during common physical activity, skin-worn stick-on sensors must have high resilience. As a result, Wang and co-workers focused on the development of wearable electrochemical devices able to monitor several target analytes in physiological fluids, like saliva, tears or perspiration (Bandodkar et al., 2016, 2015; Jia et al., 2013; Kim et al., 2015).
First we present the development of a highly stretchable Pt-decorated graphite based non-enzymatic glucose sensor. To our knowledge this is the first example of a stick-on Pt nanoparticles (Pt-NPs) based stretchable non-enzymatic electrochemical sensor. The highly stretchable nature and enzyme-free glucose detection offered by the Pt-NPs ink developed in this study provides an attractive alternative to the present blood glucose meters for developing body-worn sensors for real-time, non-invasive diabetes management. In the present study, Pt-decorated graphite was used as the ink filler. Pt-NPs have high electro-activity, even with low amounts of the platinum metal on the electrode, thus keeping the cost of the device low (Peng and Yang, 2009; Zhang et al., 2016).
Although the enzyme-free electrochemical determination of glucose concentration is the most desirable, the selectivity and sensitivity can be greatly enhanced by the immobilization of glucose oxidase (GOx). This enzyme contains the flavin adenine dinucleotide cofactor (FAD), the active center where glucose oxidation takes place (Wilson and Turner, 1992). First-generation biosensors are based on the use of oxygen as electron acceptor and the ensuing generation and quantification of H2O2 (Bankar et al., 2009; Wang, 2008). The presence of Pt within the stretchable electrodes permits the detection of H2O2 at less positive potentials and thus minimizes interference by electro-active species, such as, ascorbic acid (AA) or uric acid (UA), which are electro-active at more positive potentials (Prabhu et al., 1981). Despite these benefits, most of the first-generation biosensors were developed to detect H2O2 oxidation and few studies can be found on the electrochemical detection of glucose based on H2O2 reduction (Pu et al., 2016; Wang et al., 1994). This represents the first example of a stretchable electrochemical sensor able to detect glucose in perspiration samples by measuring reduction of H2O2 with the lowest cathodic potential. The sensors are based on graphite decorated with Pt and GOx (GOx/Pt-graphite biosensor) (Figure 1A). This sensor is useful for real-time, non-invasive enzymatic detection and quantification of glucose by H2O2 reduction in perspiration. The skin-worn sensor reported here has been successfully applied to real human perspiration samples, proving an attractive route for the non-invasive detection of glucose.
Figure 1.
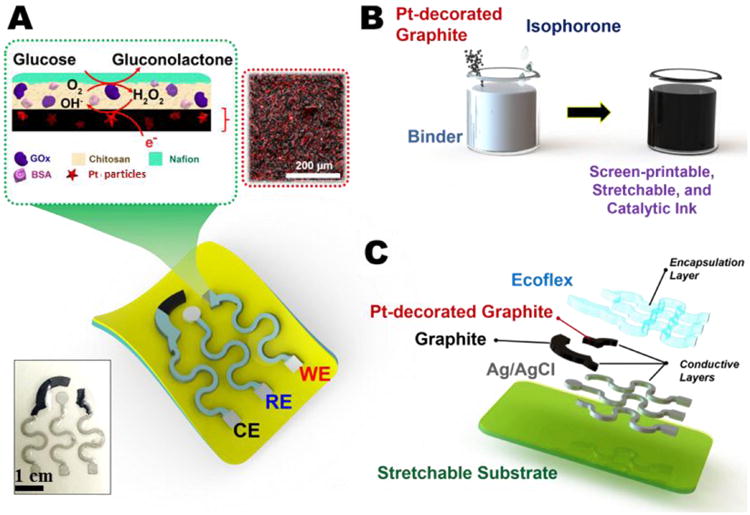
A) Diagram illustrating the design of the stretchable sensor, the enzymatic immobilization on the printed catalytic layer, and the reaction during detection. The inset shows a real image of a screen-printed sensor. B) Preparation of the screen-printable, stretchable and catalytic ink. C) Screen-printing process showing layers of the components.
2. Materials and methods
2.1. Reagents and apparatus
Graphite black powder was purchased from ACROS Organics™ (A Thermo Fisher Scientific), isophorone was obtained from Alfa Aesar, flexible stretchable fabric glue polymer (binder) from Aleene's, silver/silver chloride ink (E2414) from Ercon Inc. Silver epoxy adhesive was bought from Electron Microscopy Sciences.
Hexacloroplatinic acid (H2PtCl6), sodium borohydride (NaBH4), Ecoflex® 00-30 (Smooth-On, Inc., PA), temporary transfer tattoo paper (HPS Papilio, Rhome, TX), polyurethane (PU) (Tecoflex SG-80A), potassium ferricyanide, chitosan from crab shells, glucose oxidase from Aspergillus niger, bovine serum albumin (BSA), Nafion® 117 solution 5%, glucose, uric acid (≥99%, crystalline), L-ascorbic acid (reagent grade, crystalline), dopamine hydrochloride, and epinephrine standard chemicals, were provided by Sigma-Aldrich. Potassium dihydrogen phosphate (KH2PO4) and dipotassium hydrogen phosphate (K2HPO4) obtained by Emsure® and Sigma-Aldrich respectively, were used to prepare buffer solutions. Sodium hydroxide (NaOH) was purchased from Merk. Glacial acetic acid for analysis was obtained from Panreac. Ultrapure water was obtained by a treatment in Purelab Ultra Elga with a resistivity of 18 MΩ cm. A Contour XT® glucose meter and strips Contour®Next were purchased from Bayer.
Ecoflex® 00-30 was prepared by mixing equal volumes of pre-polymer A with pre-polymer B provided by the supplier. Similarly, conductive silver epoxy adhesive was prepared by mixing equal volumes of two parts provided by the supplier.
Transmission electron microscopy measurements (TEM) were carried out using a JEOL TEM, JEM-2010 model, which is equipped with an Oxford X-ray detector (EDS), INCA Energy TEM 100 model, and GATAN acquisition camera. Scanning electron micrographs were taken using an ORIUS SC600 model Field Emission Scanning Electron Microscope (FE-SEM) using a ZEISS microscope, Merlin VP Compact model, with an EDX Bruker, Quantax 400 model.
X-ray photoelectron spectroscopy (XPS) was performed using a VG-Microtech Multilab 3000 spectrometer using non-monochromatized MgKα (1253.6 eV) radiation from a twin anode source operated at 300 W (20 mA, 15 kV). Photoelectrons were collected in a hemispherical analyzer working in the constant energy mode at the pass energy of 50 eV. The binding energy (BE) of the C ls peak at 286.4 eV was taken as internal standard.
2.2. Preparation of the sensors
2.2.1. Pt-decorated graphite synthesis and purification
Pt-NPs were synthesized on the graphite support by following a reduction method at room temperature and atmospheric pressure. In order to achieve 4% (w/w) of Pt-NPs on graphite support, the following procedures were applied:
Solution I, 0.6 g of graphite was added to 2 mL of distilled water in a glass container. The solution was maintained under stirring conditions for 12 hours to achieve homogeneous dispersion. After that, 4 mL of hexachloroplatinic acid (H2PtCl6, 30 mM) was added to solution I and stirred for an hour.
Solution II (85 mg mL-1 NaBH4) was slowly added to solution I and stirred for 2 hours in order to reduce most of the Pt precursor.
The prepared nanoparticles deposited on graphite were purified by vacuum filtration, washed with an excess of ethanol and, finally, the solid obtained was dried in an oven at 60°C for 30 min.
2.2.2. Preparation of the inks
Three different inks were used for the further printing of the working electrode (WE), counter electrode (CE) and pseudo-reference electrode (RE).
For WE preparation, a 75% Pt-graphite/25% binder (w/w) ink was prepared as follows: 100 mg of Pt-Graphite powder was well mixed with 30 mg of stretchable binder to ensure a good homogeneity. Next, 200 μL of isophorone was added to the mixture in 50 μL aliquots and manually mixed (Figure 1B). Employing the same method, an ink comprising 75% graphite/ 25% binder (w/w) was prepared for further printing of the CE.
Finally, a commercial silver/silver chloride (Ag/AgCl) ink was used as RE, with 10% of Ecoflex® to ensure stretchability of the final device. The inks were electrochemically characterized by cyclic voltammetry (Figure S1) and various physicochemical techniques (Figure S2).
2.2.3. Preparation of the sensors
As illustrated in Figure 1C, sensor preparation involves the screen printing of inks on a polyurethane (PU) sheet, previously modified, as shown below. Sensor patterns were designed in AutoCAD and outsourced for manufacture on stainless steel through-hole 12″ × 12″ framed stencils of 125 μm thickness. Initially, a screen printing of a thick layer of Ecoflex® was done on a temporary transfer tattoo paper and allowed to half-cure for two hours at room temperature. After that, Ecoflex® was carefully placed on a PU sheet, where Ecoflex® curing was completed, ensuring proper contact between the two polymers. Special attention was paid to this step to avoid the appearance of air bubbles or wrinkles during attachment of the Ecoflex® layer onto the PU sheet. After that, a temporary transfer tattoo paper was used to cover the Ecoflex® layer and subsequently, the protective paper on top of the PU sheet was removed to exhibit the PU layer. Two types of devices were printed. The simple one consists of a printed line of Pt-graphite ink, or graphite ink, which acts as working electrode (Pt-graphite line electrode and graphite line electrode), with Ag/AgCl and a wire of Pt being external reference and counter electrodes, respectively. This kind of device was employed to optimize all parameters of the proposed method (see supplementary information). The second device was made by successive manual printing of stretchable Ag/AgCl (pseudo-reference electrode and serpentine interconnects), stretchable graphite (counter electrode) and Pt-decorated graphite (Pt-graphite, working electrode) inks to produce the whole electrochemical sensor (stretchable Pt-graphite sensor, Figure 1C). The printed stretchable Ag/AgCl was cured at 90°C for 4 min, and stretchable graphite and Pt-decorated graphite were cured at 50°C for 30 min, all in a convection oven. Finally, an Ecoflex® layer was printed to define the electrode area and contact pads were bound to the serpentine interconnects by using silver epoxy ink as a conductive adhesive. The final device was cured at 65°C for 10 min and kept at room temperature until use.
2.2.4. Preparation of amperometric glucose biosensors
Glucose biosensors (GOx/Pt-graphite line electrode and GOx/Pt-graphite biosensor) were manufactured by functionalizing the Pt-graphite with GOx enzyme (Figure 1A). To improve the GOx immobilization on the Pt-graphite electrode, the surface of the WE was covered with 1.5 μL of chitosan solution (0.5 wt%, 0.1 M acetic acid) and allowed to dry at room temperature. Next, 4.3 μL of a solution of GOx in PBS (34 mg mL-1) containing BSA (15 mg mL-1) as enzyme stabilizer, was added to the same area. When the electrode surface was completely dry, 6 μL of 5% Nafion® was added. The modified sensor was kept at 4°C until use.
2.3. Electrochemical methods
All electrochemical measurements were carried out on a BIOLOGIC SP-300 potentiostat. All potentials presented are referred to the Ag/AgCl electrode. A three-electrode configuration was used, with three different designs. Firstly, a glassy carbon (GC) electrode modified with Pt-graphite powder was used as WE in order to characterize the synthesized material, an external Ag/AgCl as RE and a Pt wire as CE. This was the only experiment performed in a nitrogen atmosphere. The second design consisted of a printed line of graphite, Pt-graphite or GOx/Pt-graphite as WE, an external Ag/AgCl as RE and a Pt wire as CE. The last design employed was the stretchable electrochemical biosensor (GOx/Pt-graphite biosensor) comprised of a GOx/Pt-graphite WE, a graphite CE and a stretchable printed Ag/AgCl pseudo-reference electrode. All measurements were taken in an air atmosphere, unless otherwise stated.
Cyclic voltammetry was used to characterize the material synthesized and to determine the reduction potential for H2O2. Quantification of H2O2 and glucose were carried out by chronoamperometry. The glucose sensor was calibrated in the glucose concentration range between 10 μM and 0.9 mM, levels corresponding to the typical perspiration glucose concentration (Lee et al., 2016; Moyer et al., 2012). All measurements were carried out in PBS (0.25 M, pH 7.0) and in triplicate (n = 3).
For real samples determination, filtered human perspiration was used and no other treatment was carried out.
3. Results and Discussion
3.1. Pt-decorated graphite line sensors. Glucose oxidation
Electrochemical non-enzymatic glucose detection was performed with a Pt-graphite printed line electrode. Figure 2A shows the voltammograms obtained for the Pt-graphite line electrode in PBS (dashed line) and 80 mM glucose solution (solid line) in which the reduction peaks at 0 V and -0.8 V related to the reduction of platinum oxide and hydrogen evolution reaction, respectively, are clearly visible in the reverse scan. In the presence of glucose, two anodic currents appear in the cyclic voltammogram. The first one, at -0.4 V, corresponding to the “hydrogen region”, is related to glucose oxidation at a potential where adsorbed hydrogen exits on the platinum surface. It should be noted that glucose produces the unique behavior of electrochemical oxidation in the hydrogen region when Pt is used as a working electrode (Park et al., 2006). The second one corresponds to the oxidation peak that appears in the “double layer region”, at around 0.1 V (Park et al., 2006). These results agree with the literature since it is proposed that glucose oxidation on platinum in neutral phosphate buffer involves the dehydrogenation at C1 carbon, showing two anodic signals (Park et al., 2006).
Figure 2.

A) Cyclic voltammogram for Pt-graphite line electrode in PBS (0.25 M, pH 7.0) (dashed line) and in glucose 80 mM (solid line). Inset: magnified zone. B) Calibration curves obtained from chronoamperometry representing the linear range at -0.4 V (solid line) and at 0.2 V (dashed line).
Chronoamperometry was performed with the Pt-graphite line electrode for glucose concentrations between 0 mM and 82 mM at 0.2 V and -0.4 V. The corresponding calibration curves obtained are shown in Figure 2B.
Analytical parameters are given in Table 1. The LOD was determined empirically, by progressively measuring more diluted concentrations of the analyte. The LOD was the lowest concentration whose signal could be clearly distinguished from the blank. Moreover, the LOQ was calculated as 3.3 times the LOD (LOQ = 3.3LOD). Additionally, coefficient of variation (CV) values were obtained for 3 replicates at 61 mM of glucose (Miller, J. and Miller, J.C., 2010).
Table 1.
Analytical figures of merit for glucose quantification with Pt-graphite line electrode at -0.4 V and 0.2 V and GOx/Pt-graphite biosensor at -0.35 V.
| Parameter | Pt-graphite line | GOx/Pt-graphite biosensor | |
|---|---|---|---|
|
| |||
| -0.4 V | 0.2 V | -0.35 V | |
| Sensitivity (μA cm-2 mM-1) | 0.69 ± 0.06 | 0.24 ± 0.02 | 105 ± 3 |
| Intercept (μA cm-2) | -175 ± 3 | -5.6 ± 0.9 | 10.9 ± 1.4 |
| r | 0.996 | 0.999 | 0.992 |
| N | 6 | 6 | 13 |
| n | 3 | 3 | 3 |
| Linear range (mM) | 0 -82 | 0-82 | 0.0-0.9 |
| LOD (mM) | 6.6 | 4.8 | 0.010 |
| LOQ (mM) | 21.8 | 15.9 | 0.033 |
| CV (%) (n = 3; C = 61 mM) | 5.7 | 7.7 | 9 |
Glucose levels in perspiration fluids are lower than the LOD achieved with this electrode, therefore these results are not applicable to perspiration samples. However, the proposed sensor may be used to quantify glucose in other physiological fluids like blood where glucose levels can reach 19 mM in diabetic patients (Moyer et al., 2012). Although enzyme-free electrochemical determination of glucose concentration is preferable, enzyme use can greatly improves the lack of selective catalytic activity and low sensitivity towards glucose, which is due to the slow kinetic of glucose oxidation. Enzymatic quantification of glucose through H2O2 reduction should improve the sensitivity and LOD compared to glucose quantification with the non-enzymatic containing electrode. To accomplish this aim, we first evaluated the behavior of graphite and Pt-graphite line electrodes towards H2O2 reduction (Figure S3).
3.2. Pt-graphite line biosensors. Glucose detection
Electrochemical behavior of GOx/Pt-graphite line electrode towards glucose additions was investigated by cyclic voltammetry and chronoamperometry. Figure 3A shows the voltammograms obtained with the GOx/Pt-graphite line electrode in PBS (dashed line) and in a solution of glucose 25 mM (solid line). The peaks related to H2O2 oxidation and reduction are clearly visible at 0.6 V and -0.2 V, respectively, indicating that glucose oxidation is catalyzed by GOx, producing H2O2 by the further re-oxidation of GOx by molecular oxygen. In order to find the optimum potential at which sensitivity towards H2O2 reduction is the highest, chronoamperometry was performed at 0.0 V, -0.1 V and -0.2 V. According to the sensitivity values (results not shown), it was decided to perform the chronoamperometry at -0.2 V. Figure 3B inset includes the j-t curves obtained for successive additions of glucose, with concentrations between 0.01 mM and 5 mM.
Figure 3.

A-B) Electrochemical behavior of GOx/Pt-graphite line electrode: A) cyclic voltammograms in PBS (0.25 M, pH 7.0) (dashed line) and in PBS containing 25 mM glucose (solid line), vscan = 0.05 V s1, B) calibration curve obtained representing the linear range. Inset: j-t curves at -0.2 V obtained on increasing glucose concentrations: 0 mM (a), 0.01 mM (b), 0.05 mM (c), 0.1 mM (d), 0.25 mM (e), 0.5 mM (f), 0.75 mM (g), 1 mM (h), 2 mM (i), 3 mM (j), 4 mM (k) and 5 mM (l), Ei = 0 V, Ef = -0.2 V. C-F) Electrochemical behavior of the stretchable GOx/Pt-graphite biosensor: C) cyclic voltammograms in PBS (0.25M, pH 7.0) (dashed line) and in 0.9 mM glucose solution (solid line); vscan = 0.05 V s1, D) calibration curve representing the linear range. Inset: j-t curves at -0.35 V obtained on increasing glucose concentrations from 0 mM (a) 0.01 mM (b), 0.03 mM (c), 0.05 mM (d), 0.1 mM (e), 0.2 mM (f), 0.3 mM (g), 0.4 mM (h), 0.5 mM (i), 0.6 mM (j), 0.7 mM (k), 0.8 mM (l) and to 0.9 mM (m), Ei = 0.0 V, Ef = -0.35 V. E) Evaluation of enzyme immobilization by Michaelis constant. F) j-t curve showing the effect at spiking level of 10 μM AA, 5 μM UA, 1 μM DP and 0.5 μM EPI on a solution containing glucose 100 μM at -0.35 V. Ei = 0.0 V.
Chronoamperometries were performed three times at each concentration in order to determine analytical parameters. The calibration curve is shown in Figure 3B.
3.3. Stretchable GOx/Pt-graphite biosensor
Before GOx immobilization, in order to ensure that the device is applicable to human skin and the deformations experienced, stretching tests were performed to determine the maximum strain sensors can withstand without losing their detection properties. Device stretchability was evaluated by resistance measurements and by cyclic voltammetry of K4Fe(CN)6 probe. The results show that the device can be elongated up to 75% of its initial length without variations in its electrochemical behavior (Figure S4). Moreover, it has been checked that the sensor can be fixed on human skin.
3.3.1. Glucose detection in standard solutions
Figure 3C presents the voltammograms obtained between -1.1 V and 0.6 V for the GOx/Pt-graphite biosensor in a PBS solution (dashed line) and in a glucose solution 0.9 mM (solid line). In the presence of glucose, cathodic and anodic waves are observed at -0.35 V and 0.0 V, corresponding to the reduction and oxidation of H2O2, respectively. Concerning the stretchable GOx/Pt-graphite biosensor, the cathodic signal related to H2O2 appears at lower potentials (-0.35 V vs -0.2 V) due to the Ag/AgCl pseudo-reference electrode used.
Chronoamperometry at -0.35 V was carried out for the glucose concentration range between 10 μM and 0.9 mM in PBS (Figure 3D inset), and the corresponding calibration curve is shown in Figure 3D.
Due to the heteroscedastic data obtained (Figure 3D), a weighted regression model was applied. It is noteworthy that such data processing is not only used to determine the slope and the intercept of the calibration plot or the concentration of samples, but also to estimate the confidence limits for those concentrations. These are much more realistic than those obtained by the unweighted regression method (Miller, J. and Miller, J.C., 2010). The LOD was determined empirically, by progressively measuring more diluted concentrations of the analyte. The LOD was the lowest concentration whose signal could be clearly distinguished from the blank. Moreover, the LOQ was calculated as 3.3 times the LOD (LOQ = 3.3LOD). The CV values were obtained for 3 replicates at 0.5 mM glucose concentration (Miller, J. and Miller, J.C., 2010). All analytical parameters obtained for the reported method are shown in Table 1. This enzymatic detection significantly improved sensitivity and LOD compared to the method using direct glucose oxidation on Pt-graphite line electrode (Figure 2B and Figure 3D). The new biosensor proved adequate for the normal levels of glucose in perspiration fluids for diabetic patients (Moyer et al., 2012).
The developed stretchable biosensor greatly improves both the electrochemical and analytical parameters obtained with other biosensors using similar electroactive material to that used in the proposed biosensor. Kudo et al. (Kudo et al., 2006) developed a flexible biosensor based on a platinum working electrode able to quantify H2O2. However, the amount of glucose was quantified by applying a much higher potential (0.55 V), with the consequent interference of AA and UA. Besides, the sensitivity they obtained was lower than that achieved in the present work. Another flexible glucose sensor based on graphene (Kwak et al., 2012) achieves adequate sensitivity, but with a working range between 3.3 mM and 10.9 mM. These levels are higher than glucose levels in samples to which these stick-on sensors can be applied, like perspiration or tears, and have been improved with the proposed stretchable biosensor. Table S1 shows a more extensive comparison between glucose biosensors reported in the last years with the GOx/Pt-graphite biosensor developed in this work.
Moreover, in order to evaluate the efficiency of GOx immobilization, we found that the double reciprocal plot (Figure 3E) could be correlated with the Lineweaver-Burk equation:
| Equation (1) |
Where Iss is the steady-state current reached after glucose addition, Cglucose is the glucose concentration in the bulk and Imax is the maximum current observed at glucose saturation. The apparent Michaelis constant was evaluated to be at around 1.2 mM, which is lower than the values obtained from GOx in solution and in agreement with reported enzymatic GOx-based sensor (Vagin et al., 2016). This result illustrates the effective immobilization as the low value of the electrode shows the high affinity towards glucose substrate.
Biosensor specificity was studied considering that perspiration consists of a plethora of metabolites and electrolytes (Harvey et al., 2010). The stretchable GOx/Pt-graphite biosensor was evaluated towards potential interferences commonly present in physiological fluids by studying their effect at -0.35 V. AA, UA, DP and EPI were added in a 100 μM glucose solution, to reach concentrations of 10 μM, 5 μM, 1 μM, and 0.5 μM, respectively (Figure 3F), which are higher than the common concentration of these analytes in human perspiration samples (Ancel Keys, 1934). No interference from these biochemical compounds was observed. Note that the perturbation in the j-t curve after the addition of different aliquots is due to the homogenization of the solution. However, the current is recovered in a few minutes reaching the initial current density.
Stretching tests were performed to determine the maximum strain that the GOx/Pt-graphite biosensor can withstand without losing its glucose detection performance. Figure S4C shows the images of the GOx/Pt-graphite biosensor for strain levels between 0% and 75%. Figure S4D presents the j-t curves obtained after strain levels of 25%, 50% and 75% were applied 50 times each. A CV of 1.3% (Cglucose = 0.9 mM; n = 4) was obtained, indicating that the GOx/Pt-graphite biosensor could be subjected to a strain of 75% without significant modifications of its sensing properties.
3.3.2. Human perspiration samples
Perspiration samples were collected from five healthy volunteers (men and women in their twenties) with no medical history of diabetes after an intense sport session and were investigated by chronoamperometry at -0.35 V. The final application of the biosensor is to be fixed to the human skin; however, the sensors were tested in the analysis of perspiration samples collected in glass containers by volunteers. Perspiration samples were filtered to eliminate solid contamination by skin collected by the volunteers during sampling. No dilution or treatment was performed to simulate sampling conditions during real-time measurement. The glucose concentrations calculated are shown in Table 2. No matrix effects were found allowing the use of the external calibration curve obtained above for all samples measured (Figure 3D). Also, the perspiration sample from subject I was used to evaluate inter-sensor reproducibility by using three different biosensors, giving a CV of 23%. This value, which is due to the handmade biosensor printing process, could be greatly reduced by the use of a printing machine during sensor manufacture. Trueness of the method was checked by measuring the glucose concentration in perspiration samples speaked at 0.4 mM of glucose, leading a recovery between 71 and 84% (Table 2). Even though GOx activity is dependent on pH (optimal values between 5.0 and 7.0) and temperature (optimal values between 25-60 °C) (Bankar et al., 2009), the results obtained for glucose recoveries indicate that these parameters do not significantly vary the enzyme activity.
Table 2. Determination of glucose in real perspiration samples.
| Subject | Initial (mM) | Spiked (mM) | Found (mM) | Recovery (%) |
|---|---|---|---|---|
| I | 0.27 ± 0.06 | 0.4 | 0.56 ± 0.05 | 83 |
| II | 0.14 ± 0.06 | 0.4 | 0.38 ± 0.07 | 71 |
| III | 0.31 ± 0.07 | 0.4 | 0.59 ± 0.11 | 84 |
| IV | 0.17 ± 0.07 | 0.4 | 0.46 ± 0.09 | 81 |
Perspiration sample from subject V was taken to compare glucose levels obtained under fasting and post-meal conditions, giving concentrations of (0.14 ± 0.06) mM and (0.53 ± 0.10) mM, respectively. Perspiration sample under fasting conditions was collected 12 h after the last food intake, while the post-meal sample was collected 30 min after substantial glucose intake. In both cases, perspiration samples were gathered after 30 min of intense sport activity. The results show large differences between glucose levels under fasting and post-meal conditions.
Currently, there is no commercially available diagnostic tool for measuring glucose levels in perspiration. Therefore, to compare and benchmark the performance of the biosensor developed in this work, we used a Contour XT®glucose measurement meter from Bayer, a commercially available diagnostic tool for measuring glucose in peripheral blood. This analysis was done for a limited number of samples (i.e., 6 samples). Blood samples of volunteers were collected prior to the sport activities necessary to generate the perspiration samples. To do so, a time interval of 30 min was observed between the perspiration and blood samples collection. To quantify the correlation between the concentrations in both fluids, we used the R2-value of regression analysis for the correlation between the response of the sensors under development and the response from the Contour XT® results. Figure 4 presents the correlation plot, where the sensors showed an R2-value of 0.968, indicating a significant correlation in the results obtained.
Figure 4.

Comparison of Contour XT® glucose meter (CGLU BLOOD) and biosensor (CGLU PERSPIRATION) using regression analysis for perspiration and blood samples.
4. Conclusions
In the present work, an all-printable, highly stretchable, and low-cost device, based on Pt-decorated graphite (stretchable Pt-graphite sensor, 3 %wt Pt), was developed for non-invasive glucose monitoring in physiological fluids. The synthesized Pt-graphite electrode was exhaustively characterized by cyclic voltammetry, TEM, FE-SEM and XPS.
Glucose in phosphate buffer solution (0.25 M PBS, pH 7.0) was investigated by two different methods: non-enzymatic and enzymatic detection. On the one hand, enzyme-free detection was carried out by recording the glucose oxidation current by chronoamperometry at -0.4 V and 0.2 V. The results obtained at negative potential show the higher sensitivity of this method. The sensitivity obtained with this sensor was 0.69 ± 0.06 μA cm-2 mM-1, and a LOD of 6.6 mM. Given the LOD achieved, this non-enzymatic sensor is useful to detect glucose in physiological fluids like blood, where glucose levels are higher than in other human fluids like perspiration.
On the other hand, enzymatic detection was performed after immobilization of GOx on a Pt-decorated graphite electrode (GOx/Pt-graphite biosensor). Glucose quantification in this case, was done by measuring the current of H2O2 reduction via chronoamperometry at -0.35 V. The latter method greatly improved the sensitivity levels obtained with the enzyme-free sensor. Excellent results have been obtained for glucose quantification in phosphate buffer solution (0.25 M PBS, pH 7.0), where the GOx/Pt-graphite biosensor exhibits a low LOD of 10 μM with a linear range between 0 μM and 0.9 mM. The sensitivity obtained with this enzymatic sensor was 105 ± 3 μA cm-2 mM-1. Repeatability was studied for a glucose concentration of 0.5 mM providing a CV of 9%. No interferences of UA, AA, DP and EPI were observed, confirming the high specificity of the sensor for glucose. Stretchability tests were performed to study the influence of stress-strain on detection performance. The results show that the GOx/Pt-graphite biosensor can be stretched up to 75% of its original size with a CV for glucose detection of 1.3% and it has been checked that the sensor can be fixed in human skin.
Inter-sensor reproducibility and the trueness of the proposed method were investigated by the analyses of human perspiration samples, providing a CV of 23% and a recovery between 71% and 84%. Moreover, statistically significant differences were found in the glucose levels obtained from perspiration samples collected under fasting and post-meal conditions. Finally, results obtained by measuring glucose concentrations in human perspiration with a GOx/Pt-graphite biosensor and human blood with a commercial glucose meter indicate a significant correlation between these values.
These data indicate that the present stretchable biosensor is competitive, making it an alternative stick-on, non-invasive device for the continuous quantification of glucose levels in human perspiration samples.
Supplementary Material
Highlights.
Stretchable electrochemical biosensors for glucose determination in perspiration
The obtained working range and sensitivity are 33 μM-0.9 mM and 105μA•cm-2mM-1, respectively
An alternative for the non-invasive quantification of glucose in human perspiration
Real human perspiration were used to evaluate the inter-sensor reproducibility and trueness
Acknowledgments
This work is supported by the Generalitat Valenciana (Prometeo2013/038), by the Ministerio de Economia y Competitividad (MAT2016-76595-R), and the U.S. National Institute of Biomedical Imaging and Bioengineering of NIH (R21EB019698). A. Abellán also thanks the Generalitat Valenciana for her fellowship and the Universidad de Alicante for her fellowship for a research stay in University of San Diego, California.
Footnotes
Publisher's Disclaimer: This is a PDF file of an unedited manuscript that has been accepted for publication. As a service to our customers we are providing this early version of the manuscript. The manuscript will undergo copyediting, typesetting, and review of the resulting proof before it is published in its final citable form. Please note that during the production process errors may be discovered which could affect the content, and all legal disclaimers that apply to the journal pertain.
References
- Ancel Keys OM. J Biol Chem. 1934;27:839–848. [Google Scholar]
- Bandodkar AJ, Jeerapan I, Wang J. ACS Sens. 2016;1:464–482. [Google Scholar]
- Bandodkar AJ, Jia W, Yardımcı C, Wang X, Ramirez J, Wang J. Anal Chem. 2015;87:394–398. doi: 10.1021/ac504300n. [DOI] [PubMed] [Google Scholar]
- Bankar SB, Bule MV, Singhal RS, Ananthanarayan L. Biotechnol Adv. 2009;27:489–501. doi: 10.1016/j.biotechadv.2009.04.003. [DOI] [PubMed] [Google Scholar]
- Cui G, Yoo JH, Woo BW, Kim SS, Cha GS, Nam H. Talanta. 2001;54:1105–1111. doi: 10.1016/s0039-9140(01)00377-0. [DOI] [PubMed] [Google Scholar]
- Galant AL, Kaufman RC, Wilson JD. Food Chem. 2015;188:149–160. doi: 10.1016/j.foodchem.2015.04.071. [DOI] [PubMed] [Google Scholar]
- Harborn U, Xie B, Venkatesh R, Danielsson B. Clin Chim Acta. 1997;267:225–237. doi: 10.1016/s0009-8981(97)00151-4. [DOI] [PubMed] [Google Scholar]
- Harvey CJ, LeBouf RF, Stefaniak AB. Toxicol In Vitro. 2010;24:1790–1796. doi: 10.1016/j.tiv.2010.06.016. [DOI] [PubMed] [Google Scholar]
- Jia W, Bandodkar AJ, Valdés-Ramírez G, Windmiller JR, Yang Z, Ramírez J, Chan G, Wang J. Anal Chem. 2013;85:6553–6560. doi: 10.1021/ac401573r. [DOI] [PubMed] [Google Scholar]
- Kim J, Imani S, de Araujo WR, Warchall J, Valdés-Ramírez G, Paixão TRLC, Mercier PP, Wang J. Biosens Bioelectron. 2015;74:1061–1068. doi: 10.1016/j.bios.2015.07.039. [DOI] [PMC free article] [PubMed] [Google Scholar]
- Kudo H, Sawada T, Kazawa E, Yoshida H, Iwasaki Y, Mitsubayashi K. Biosens Bioelectron, Selected Papers from the 2nd International Meeting on Microsensors and Microsystems. 2006;22:558–562. doi: 10.1016/j.bios.2006.05.006. [DOI] [PubMed] [Google Scholar]
- Kwak YH, Choi DS, Kim YN, Kim H, Yoon DH, Ahn SS, Yang JW, Yang WS, Seo S. Biosens Bioelectron. 2012;37:82–87. doi: 10.1016/j.bios.2012.04.042. [DOI] [PubMed] [Google Scholar]
- Labroo P, Cui Y. Biosens Bioelectron. 2013;41:852–856. doi: 10.1016/j.bios.2012.08.024. [DOI] [PubMed] [Google Scholar]
- Lee H, Choi TK, Lee YB, Cho HR, Ghaffari R, Wang L, Choi HJ, Chung TD, Lu N, Hyeon T, Choi SH, Kim DH. Nat Nanotechnol. 2016;11:566–572. doi: 10.1038/nnano.2016.38. [DOI] [PubMed] [Google Scholar]
- Lee JK, Kang SM, Yang SH, Cho WK. J Biomed Nanotechnol. 2015;11:2081–2110. doi: 10.1166/jbn.2015.2097. [DOI] [PubMed] [Google Scholar]
- Liu C, Sheng Y, Sun Y, Feng J, Wang S, Zhang J, Xu J, Jiang D. Biosens Bioelectron. 2015;70:455–461. doi: 10.1016/j.bios.2015.03.070. [DOI] [PubMed] [Google Scholar]
- Lodgotra A, Verma P, Raj SS. J Clin Diagn Res. 2016;10:ZC56–ZC61. doi: 10.7860/JCDR/2016/19135.7995. [DOI] [PMC free article] [PubMed] [Google Scholar]
- Miller J, Miller JC. Statistics and chemometrics for analytical chemistry, 6th edition. 6th Pearson; 2010. [Google Scholar]
- Mitsubayashi K, Suzuki M, Tamiya E, Karube I. Anal Chim Acta. 1994;289:27–34. [Google Scholar]
- Moyer J, Wilson D, Finkelshtein I, Wong B, Potts R. Diabetes Technol Ther. 2012;14:398–402. doi: 10.1089/dia.2011.0262. [DOI] [PubMed] [Google Scholar]
- Park S, Boo H, Chung TD. Anal Chim Acta, Young Analytical Faculty in Asia. 2006;556:46–57. doi: 10.1016/j.aca.2005.05.080. [DOI] [PubMed] [Google Scholar]
- Peng Z, Yang H. Nano Today. 2009;4:143–164. [Google Scholar]
- Prabhu VG, Zarapkar LR, Dhaneshwar RG. Electrochimica Acta. 1981;26:725–729. [Google Scholar]
- Pu Z, Wang R, Wu J, Yu H, Xu K, Li D. Sens Actuators B Chem. 2016;230:801–809. [Google Scholar]
- Rabti A, Argoubi W, Raouafi N. Microchim Acta. 2016;183:1227–1233. [Google Scholar]
- Sakaguchi K, Hirota Y, Hashimoto N, Ogawa W, Hamaguchi T, Matsuo T, Miyagawa JI, Namba M, Sato T, Okada S, Tomita K, Matsuhisa M, Kaneto H, Kosugi K, Maegawa H, Nakajima H, Kashiwagi A. J Diabetes Sci Technol. 2013;7:678–688. doi: 10.1177/193229681300700313. [DOI] [PMC free article] [PubMed] [Google Scholar]
- Vagin MY, Jeerapan I, Wannapob R, Thavarungkul P, Kanatharana P, Anwar N, McCormac T, Eriksson M, Turner APF, Jager EWH, Mak WC. Electrochimica Acta. 2016;190:495–503. [Google Scholar]
- Wang HC, Lee AR. J Food Drug Anal. 2015;23:191–200. doi: 10.1016/j.jfda.2014.12.001. [DOI] [PMC free article] [PubMed] [Google Scholar]
- Wang J. CHAPTER 3 - Electrochemical glucose biosensors in electrochemical sensors, biosensors and their biomedical applications. Academic Press; San Diego: 2008. pp. 57–69. [Google Scholar]
- Wang J, Liu J, Chen L, Lu F. Anal Chem. 1994;66:3600–3603. [Google Scholar]
- Wilson R, Turner APF. Biosens Bioelectron. 1992;7:165–185. [Google Scholar]
- Zhang H, Bo X, Guo L. Electrochimica Acta. 2016;201:117–124. [Google Scholar]
- Zhu J, Zhu Z, Lai Z, Wang R, Guo X, Wu X, Zhang G, Zhang Z, Wang Y, Chen Z. Sensors. 2002;2:127–136. [Google Scholar]
Associated Data
This section collects any data citations, data availability statements, or supplementary materials included in this article.