

Abstract
Oxidative stress alters physiological function in most biological tissues and can lead to cell death. In the retina, oxidative stress initiates a cascade of events leading to focal loss of RPE and photoreceptors, which is thought to be a major contributing factor to geographic atrophy. Despite these implications, the molecular regulation of RPE oxidative stress under normal and pathological conditions remains largely unknown. A better understanding of the mechanisms involved in regulating RPE and photoreceptors oxidative stress response is greatly needed. To this end we evaluated photoreceptor and RPE changes in mice deficient DJ-1, a protein that is thought to be important in protecting cells from oxidative stress.
Young (3 months) and aged (18 months) DJ-1 knockout (DJ-1 KO) and age-matched wild-type mice were examined. In both aged mice scanning laser ophthalmoscopy (SLO) showed the presence of a few autofluorescent foci. The 18 month-old DJ-1 KO retinas were also characterized by a noticeable increase in RPE fluorescence to wild-type. Optical coherence tomography (OCT) imaging demonstrated that all retinal layers were present in the eyes of both DJ-1 KO groups. ERG comparisons showed that older DJ-1 KO mice had reduced sensitivity under dark- and light-adapted conditions compared to age-matched control. Histologically, the RPE contained prominent vacuoles in young DJ-1 KO group with the appearance of enlarged irregularly shaped RPE cells in the older group. These were also evident in OCT and in whole mount RPE/choroid preparations labeled with phalloidin. Photoreceptors in the older DJ-1 KO mice displayed decreased immunoreactivity to rhodopsin and localized reduction in cone markers compared to the wild-type control group. Lower levels of activated Nrf2 were evident in retina/RPE lysates in both young and old DJ-1 KO mouse groups compared to wild-type control levels. Conversely, higher levels of protein carbonyl derivatives and iNOS immunoreactivity were detected in retina/RPE lysates from both young and old DJ-1 KO mice.
These results demonstrate that DJ-1 KO mice display progressive signs of retinal/RPE degeneration in association with higher levels of oxidative stress markers. Collectively this analysis indicates that DJ-1 plays an important role in protecting photoreceptors and RPE from oxidative damage during aging.
Keywords: DJ-1 knockout, retina, retinal degeneration, photoreceptors, retinal pigment epithelium, vacuoles, oxidative stress, aging, physiology, histology, immunohistology
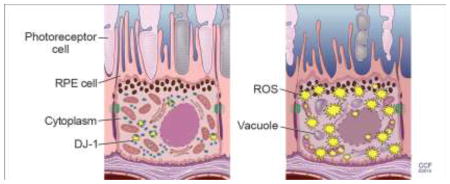
Graphical Abstract
1. Introduction
DJ-1 is a multifunctional protein that plays an important role in the oxidative stress response in sporadic Parkinson’s disease (PD) [1–3] and in other neurodegenerative disorders such as amyotrophic lateral sclerosis (ALS) [4], Alzheimer’s disease (AD) [2] and Huntington’s disease (HD) [5]. Deletion of or mutations in the DJ-1 gene (PARK7) result in early-onset familial PD [6–8].
DJ-1 is ubiquitously expressed in many tissues, including the brain, where it functions as an antioxidant, redox-sensitive molecular chaperone and transcriptional regulator that protects cells from oxidative stress. DJ-1 has been intensely studied in neurons; however, its role in the retina and retinal pigment epithelium (RPE) cells is poorly understood. Our initial experiments identified DJ-1 peptides in RPE fractions of both young and old rats [9]. Further analysis detected higher levels of DJ-1 in RPE lysates from older animals [9]. Consistent with its role as an antioxidant, we previously demonstrated that increased DJ-1 expression in RPE cultures prior to exposure to oxidative stress significantly decreased ROS generation [10]. We also reported mild structural and physiological changes in the retinas of the young vs middle-aged DJ-1 knockout (DJ-1 KO) mice in association with increased oxidative stress. These included an increase in the amplitude of the scotopic ERG b-wave (reflecting bipolar cell function), an increase in amplitude of the cone ERG, decreased amplitude of a subset of the dc-ERG components (reflecting RPE function) at 6 months of age in the KO compared to the control, RPE thinning, decreased tyrosine hydroxylase in dopaminergic neurons, and increased 7,8- dihydro-8-oxoguanine-labeled DNA oxidation [11].
Here, we report that the severity of these changes increased with age through the analysis of older (18 month-old) mice and compared the results to young control mice. We identified retinal thinning, morphological and physiological changes in the RPE and photoreceptors, and accumulation of markers of oxidative stress. Our results suggest that the DJ-1 KO mice are a model of mild chronic RPE oxidative stress that results in a progressive phenotype of age-related retinal degeneration.
2. Materials and methods
2.1 DJ-1 knockout (KO) model
Mice with a deletion of the second exon of DJ-1 have been characterized previously [12]. Mice were housed in a 12-h light/dark cycle and fed a regular diet ad libitum. All animal procedures were approved by the Institutional Animal Care and Use Committee (IACUC protocol number ARC 2016-1048) at the Cleveland Clinic. Homozygous DJ-1 KO mice were backcrossed onto the C57Bl/6J background to generate wild-type control mice. Mice negative for the presence of the DJ-1 PCR product were used as control. DJ-1 heterozygous KO mice were not analyzed. Analyses were carried out in both male and female 3- and 18-month-old mice. The number of mice/genotype/age examined in this study is summarized in Table 1. For in vivo imaging and retinal function experiments, mice were anesthetized with sodium pentobarbital (Nembutal sodium solution, USP, 65 mg/kg, Oak Pharmaceuticals, Inc., subsidiary of Akorn, Inc., Lake Forest, IL), and all efforts were made to minimize procedural stress.
Table 1.
Experimental study groups.
| Experiment | Number of Mice | Genotype | Age |
|---|---|---|---|
| In vivo imaging | 5 (M) | Control | 3 month-old |
| In vivo imaging | 4 (M), 2 (F) | Control | 18 month-old |
| In vivo imaging | 2 (M), 3 (F) | DJ-1 KO | 3 month-old |
| In vivo imaging | 5 (M) | DJ-1 KO | 18 month-old |
|
| |||
| Retinal function | 2 (M), 1 (F) | Control | 3 month-old |
| Retinal function | 2 (M), 2 (F) | Control | 18 month-old |
| Retinal function | 3 (M), 5 (F) | DJ-1 KO | 3 month-old |
| Retinal function | 3 (M), 5 (F) | DJ-1 KO | 18 month-old |
|
| |||
| Histology | 4 (M), 5 (F) | Control | 3 month-old |
| Histology | 3 (M), 6 (F) | Control | 18 month-old |
| Histology | 6 (M), 5 (F) | DJ-1 KO | 3 month-old |
| Histology | 5 (M), 2 (F) | DJ-1 KO | 18 month-old |
|
| |||
| RPE and retina whole-mounts | 8 (M), 4 (F) | Control | 3 month-old |
| RPE and retina whole-mounts | 4 (M), 8 (F) | Control | 18 month-old |
| RPE and retina whole-mounts | 6 (M), 3 (F) | DJ-1 KO | 3 month-old |
| RPE and retina whole-mounts | 7 (M), 3 (F) | DJ-1 KO | 18 month-old |
|
| |||
| Elisa/Western blots | 2 (M), 3 (F) | Control | 3 month-old |
| Elisa/Western blots | 2 (M), 2 (F) | Control | 18 month-old |
| Elisa/Western blots | 2 (M), 3 (F) | DJ-1 KO | 3 month-old |
| Elisa/Western blots | 1 (M), 3 (F) | DJ-1 KO | 18 month-old |
M- male, F- female
2.2 Genotyping
Genomic DNA was isolated from tail biopsies using DirectPCR Lysis Reagent (mouse tail, Viagen Biotech, Los Angeles, CA) and subjected to PCR amplification using specific sets of PCR primers for the DJ-1 genotype as previously reported [11]. We confirmed the absence of Crb1 rd8 mutation in our mice by PCR amplification as previously described [13].
2.3 In vivo imaging of retinas
Imaging by confocal scanning laser ophthalmoscopy [14] (model HRA2; Heidelberg Engineering, Inc., Vista, CA) and spectral-domain optical coherence tomography (SD-OCT) (model SDOIS; Bioptigen, Inc., Research Triangle Park, NC) was carried out following sodium pentobarbitol anesthesia and pupil dilation with 1.5 μL of 0.5% Mydrin-P drops (Santen Pharmaceutical Co., Ltd., Osaka, Japan) and topical anesthesia 0.5% proparacaine HCl as previously described [15]. Autofluorescence SLO (AF-SLO) images were obtained using illumination and excitation wavelength of 488nm. SD-OCT images from the horizontal and vertical meridian were collected using 1000 A-scans/B-scan x 10 B-scans. B-scans from each meridian were co-registered and averaged using ImageJ. In-depth profiles (see Supplement Fig. S1) of retinal morphology, extracted from SD-OCT B-scans were analyzed as previously described [11]. Five mice of each genotype and age were analyzed.
2.4 Retinal function
Retinal function of young and aged DJ-1 KO and control mice was studied after overnight dark adaptation as previously described [11]. Mice were anesthetized with ketamine (80 mg/kg) and xylazine (16 mg/kg). Eye drops were used to anesthetize the cornea (1% proparacaine HCl) and to dilate the pupil (2.5% phenylephrine HCl, 1% tropicamide, and 1% cyclopentolate HCl). Mice were placed on a temperature-regulated heating pad throughout the recording session. Electroretinogram (ERG) components generated by the neural retina were measured in response to strobe flash stimulation using a recording protocol that has been developed for mice as previously described [16]. Strobe flash ERGs were recorded using a stainless steel electrode in contact with the corneal surface with 1% methylcellulose. Needle electrodes were placed in the cheek for the reference and in the tail for the ground leads. Dark-adapted responses were presented within an LKC ganzfeld and recorded using increasing flash intensities from 3.6 to 2.1 log cd s/m2. The number of successive responses averaged together decreased from 20 for low-intensity flashes to 2 for the highest intensity stimuli. Conversely, the duration of the interstimulus interval (ISI) increased from 4 s for low-intensity flashes to 90 s for the highest-intensity stimuli. Responses were differentially amplified (0.3–1,500 Hz), averaged, and stored using a UTAS E-3000. (3mo cntl, n=3; 3mo DJ-1 KO, n=8; 18mo cntl, n=4; 18mo DJ-1 KO, n=8). The direct-current coupled (dc)–ERG components generated by the RPE in response to a 7 minute duration stimulus were also recorded and analyzed as previously described [17]. Briefly, white light stimuli were derived from an optical channel using a Leica microscope illuminator as the light source and delivered to the test eye with a 1-cm-diam fiber optic bundle. Thirty seconds of baseline recording prior to the stimulus and 90 seconds following the light off were recorded to capture the c-wave, fast oscillation, light peak and off responses (3mo control, n=3; 3mo DJ-1 KO, n=6; 18mo control, n=3; 18mo DJ-1 KO, n=4).
2.5 Histology and transmission electron microscopy of retinas
Eyes were enucleated and fixed by immersion in 2% paraformaldehyde, 2.5% glutaraldehyde and 5% CaCl2 made in 0.1 M cacodylate buffer overnight at 4°C and processed for epon embedding as previously described [11]. For bright-field microscopy, semi-thin sections were cut with a diamond histotech knife, collected on glass slides, and stained with toluidine blue. Slides were photographed with a Zeiss AxioImager.Z1 light microscope and AxioCam MRc5 camera. For transmission electron microscopy (TEM), the same block of epon-embedded samples was thin sectioned on an RMC, PowerTome-XL (Tucson, AZ) ultramicrotome, stained with uranyl acetate and lead citrate and viewed in a Tecnai 20–200 kV digital electron microscope (Philips, Hillsboro, OR) equipped with a Gatan image filter and digital camera at 3600 diameters as previously described [11].
2.5.1 Morphometric analysis of retinal layers thickness and of the number of RPE vacuoles
Micrographs from toluidine blue section images were acquired 100 μm away from the optic nerve head (on both sides) using identical settings. Images from mice in each group were acquired and exported to ImageJ 1.43u (http://rsb.info.nih.gog/ij). Micrographs were calibrated from a scale reference embedded in the image. Retinal lamina, including the RPE (from the basal infoldings to the melanin pigments), photoreceptor inner and outer segments (IS/OS), outer and inner nuclei layers were delineated using the freehand line and measured in triplicate to obtain a mean thickness for each mouse. Six measurements were performed throughout each acquired image within 2 sections/eye. Within these same regions, the number of vacuoles present in the RPE cytoplasm was manually counted throughout each acquired image. All measurements and quantifications were performed in a masked fashion.
2.6 Immunohistochemistry
2.6.1 Cryosections preparation and labeling
After enucleation, eyes were fixed by overnight immersion in 4% paraformaldehyde in PBS at 4°C. Eyes were quenched with 50 mM NH4Cl for 30 min and then infused successively with 10% and 20% sucrose in PBS, and finally Tissue-Tek “4583” (Miles Inc., Elkhart, IN). Cryosections (8 μm) were cut on a cryostat HM 505E (Microm, Walldorf, Germany) equipped with a CryoJane Tape-Transfer system (Leica Inc., Buffalo Grove, IL). For labeling, sections were washed to remove embedding medium, blocked in PBS supplemented with 1% BSA (PBS/BSA) for 30 min, and incubated with primary followed by secondary antibodies coupled to Alexa 488 as well as with TO-PRO-3 for nuclear labeling (LifeTechnologies, Grand Island, NY) as previously described [10]. A series of 0.3-μm xy (en face) sections were collected using a laser scanning confocal microscope (Leica TCS-SP8, Exton, PA) using the same acquisition parameters for each channel in the Leica confocal software LAS AF. Antibodies used included rhodopsin (clone B630N, from Dr. G. Adamus, Oregon Health and Science University, Portland, OR, 1:100), red/green opsin (AB5405, Millipore, Billerica, MA, 1:600) and ezrin (ab41672, Abcam, 1:250).
2.6.2 Whole-mounted RPE and retina preparation and labeling
Enucleated eyes were fixed for 20 min at 4°C in 4% paraformaldehyde, retinas were mechanically detached from RPE/choroid and both whole-mounts were further fixed for additional 60 min at 4°C, washed in PBS and quenched in 50mM NH4Cl made in PBS for 20 min at room temperature. Next, both retina and RPE/choroid whole-mounts were permeabilized in PBS supplemented with 1% triton X-100 for 30 min. at room temperature in a rotator and blocked in PBS supplemented with 2% BSA and 0.03%Triton for 30 min at room temperature. Retina whole-mounts were incubated in anti-red/green opsin antibody while RPE/choroid whole-mounts were labeled with phalloidin-TRITC (Sigma-Aldrich, 1:1000) in the same blocking buffer overnight at 4°C. Whole-mounted retinas were prepared on glass slides and images were acquired using a laser scanning confocal microscope (Leica TCS SP8). Retina and RPE/choroid whole-mount images from 4–8 different mice in each group were acquired using identical settings. A series of 1.4 μm xy (en face) sections and tiles of the whole labeled retina was collected, scans were merged and a three-dimensional projection of the entire whole-mount was generated. The mean intensity of the fluorescence signal in each whole-mount retina Z-stack was quantified using the Leica Application Suite X Version 1.1.0.12420. The number of enlarged RPE cells within the RPE layer in each whole-mount was manually counted in a masked fashion using ImageJ 1.43u and a mean number was determined for each mouse.
2.7 Elisa Analysis
2.7.1 Nrf2 activity kit
Isolated Retina/RPE were lysed in T-PER Tissue Protein Extraction Reagent (Thermo Scientific) supplemented with protein and phosphatase inhibitors (Sigma-Aldrich). Nuclear Nrf2 activity, measuring the ARE oligonucleotide DNA binding activity of the Nrf2, was quantified in 5μg of total lysate using the TransAM Nrf2 activity kit (Active Motif, CA), according to the manufacturer’s instructions. The final A450 was read on a SpectraMax 384 Plus Multi-Mode Microplate Reader supplied with SoftMax® Pro Data Acquisition & Analysis Software (Molecular Devices).
2.7.2 Protein Carbonyl kit
Isolated Retina/RPE were lysed in T-PER Tissue Protein Extraction Reagent as described above. Protein carbonyl residues in samples were quantified in 5μg of total lysate using the OxiSelect Protein Carbonyl ELISA Kit (Cell Biolabs, Inc.), according to the manufacturer’s instructions. The final A450 was read on a SpectraMax 384 Plus Multi-Mode Microplate Reader supplied with SoftMax® Pro Data Acquisition & Analysis Software (Molecular Devices).
2.8 Western Blot Analysis of Retina/RPE lysates
Mouse eyes were enucleated; the retina/RPE was mechanically detached from the choroid, and lysed by sonication in T-PER Tissue Protein Extraction Reagent as described above. Extracted proteins were quantitated using a BCA protein assay (Thermo Scientific). Lysates (10μg protein) were resolved by SDS-PAGE on 4–20% Novex®-Tris-Glycine gel (Life Technologies) and electro-transferred to Immobilon PVDF membranes (Millipore, Bedford, MA). Membranes were blocked with SuperBlock T20 (TBS) Blocking Buffer (Thermo Scientific) for 30 min. and incubated overnight in the same solution with antibodies to iNOS (ab49999, Abcam) and GAPDH (ab9484, Abcam). PVDF membranes were exposed to film. Films were digitized using a densitometer (GS800; Bio-Rad) and quantification of the bands was accomplished using Quantity One 4.6.8 software (Bio-Rad). Plotted signals represent density OD/mm2 for each band subtracted from the background signal and divided by the pixels in the GADH western blots.
2.9 Statistical Analysis
All data were analyzed for statistical significance using GraphPad Prism v6.0a (GraphPad Software, La Jolla, CA). SD-OCT retinal profiles and retinal function by ERG was analyzed as previously described [11, 16, 17]. Morphometric analysis of retinal lamina thicknesses was performed using a two-way repeated measures ANOVA with an alpha value of 0.05. Whole-mount retina fluorescence, enlarged RPE, ELISA and western blot assays and were analyzed by unpaired Student’s t-test.
3. Results
3.1 Age-related functional and structural analysis of retinas
We previously reported structural and physiological changes in the retinas of the 3 month-old DJ-1 KO mice that progressively increased at 6 months [11]. In the present study we extended our analysis to older (18 month-old) mice to determine whether DJ-1 absence affects retinal morphology and physiology during aging. In vivo retinal morphology of young (3 month-old) control and DJ-1 KO mice analyzed using AF-SLO (Fig. 1A, 1B) and SD-OCT (Fig. 1E, 1F) imaging identified no obvious retinal abnormalities. A few autofluorescent foci were visible in the 18 month-old control (Fig. 1C, arrowheads) and DJ-1 KO (Fig. 1D, arrowheads) retinas however; the 18 month-old DJ-1 KO retinas were characterized by the presence of widespread hyperfluorescence compared to age-matched controls. Cross-sectional, in-depth views using SD-OCT showed preservation of all retinal cell layers in both 3-month- (Fig. 1E) and 18-month-old (Fig. 1G) control and DJ-1 KO retinas (Fig. 1F, 1H). Further review of the DJ-1 KO retinas indicated a less well-delineated division between photoreceptor inner and outer segments (Fig. 1F, 1H, brackets) when compared to controls (Fig. 1E, 1G). These morphological features were quantified through the analysis of the longitudinal reflectance profile (LRP) of the retina between external limiting membrane and the choriocapillaris to establish layer presence and locate layer boundaries, as previously described [11]. Representative graphs of the mean reflectance signal amplitude normalized to the smallest and largest signal intensities of control mice vs. axial tissue depth are depicted in Fig. 1I and 1J. Eighteen month-old DJ-1 KO retinas displayed photoreceptor outer segments that were significantly different from control mice in all eye quadrants (Supplemental Fig. 1). This observation was specific to the proximal outer segments (near to the IS/OS junction and/or inner segments, Fig. 1J). At 18-months DJ-1 KO showed evidence of significant photoreceptor layer thinning in all four quadrants relative to control mice. Another recognizable phenotype for the DJ-1 KO mice was the presence of a hyper-reflective band on top of the retina, visible in 100% percent of the DJ-1 KO mice at both 3 and 18 months of age (Fig. 1F and 1H, white arrows). Further experiments are underway to understand the source of this band in the DJ-1 KO retinas.
Fig. 1. In vivo, light and electron microscopy of retinas lacking DJ-1 with quantitative comparisons.

(A–D) AFSLO images of the retinas of 3-month- (A) and 18-month-old (C) control mice compared to 3-month- (B) and 18-month-old (D) DJ-1 KO; a few autofluorescent foci were present in the 18 month-old retinas (arrowheads). (E–H) OCT images of 3-month- (E) and 18 month-old (G) control mice compared to 3-month- (F) and 18-month-old (H) DJ-1 KO; 18 month-old DJ-1 KO mice (H) displayed loss of laminar delineation between photoreceptor IS and OS (brackets); 100% of the DJ-1 KO mice also displayed a hyper-reflective band seen on both sides of the optic nerve (arrows). Analysis of normalized OCT mean reflectance signal of photoreceptor (nasal quadrant) vs. axial tissue depth in 3-month- (I) and 18-month-old (J) mice identified significant difference in the proximal OS (adjacent to the IS/OS junction and/or inner segments, black arrows) of 18 month-old DJ-1 KO in comparison to control mice. The photoreceptor signal was subdivided as follows: ELM= external limiting membrane; IS= inner segments; OS= outer segments; RPE= retinal pigment epithelium; CC= choriocapillaris; ONL= outer nuclei layer. Blue line = control mice, red lines = DJ-1 KO mice. P-values= 3 m.o. ELM (0.0197); 18 m.o. ELM (n.s.); 3 m.o. OS (n.s.); 18 m.o. OS (0.0041). Light microscopy images of toluidine blue stained plastic sections of retinas from 3-month- (K) and 18-month-old (M) control mice compared to 3-month- (L) and 18-month-old (N) DJ-1 KO mice showed accumulation of vacuoles in the RPE from both young and aged DJ-1 KO mice; the 18 month-old DJ-1 KO retinas displayed significant retinal thinning. (O) Measurements of the mean photoreceptor IS/OS thickness, ONL, OPL (outer plexiform layer), INL (inner nuclei layer) were calculated and determined significant decrease in the mean thickness of photoreceptor IS/OS, ONL and OPL of the 18 month-old DJ-denote statistical significance with respect to control mice (*p=0.0005, **p=0.0006, ***p=0.0092, ****p=0.0024). Electron micrographs of the photoreceptor OS (P–S) and RPE (T–W) of 3-month- (P, T) and 18-month-old (R, V) control mice compared to 3-month- (Q, U) and 18-month-old (S, W) DJ-1 KO mice. Both young and aged DJ-1 KO mice display photoreceptor outer segment swollen, vacuolized, and with disorganized disc membranes. Three month-old control RPE (T) apical surface elaborates apical microvilli (MV), while the RPE from 3 month-old DJ-1 KO mice (U) and 18-month-old control (V) and DJ-1 KO (W) extended irregular, short, and fewer microvilli. P, pigment granules; BI, basal infoldings; BM, Bruch’s membrane; N, nuclei.
We evaluated retinal and photoreceptor appearance in young and aged control and DJ-1 KO mice by carrying out a detailed morphometric analysis of histological retinal sections (Fig. 1K to 1N). At 3 months DJ-1 KO mice (Fig. 1L) display comparable retinal thickness to control mice (Figs. 1K). However, at 18 months the DJ-1 KO mice (Fig. 1N) displayed significant reductions in retinal thickness when compared to control (Fig. 1M) mice. The decrease was prominent in the photoreceptors inner and outer segments (IS/OS), in the outer nuclei layer (ONL) and the outer plexiform layer (OPL). Both 3-month- and 18 month-old DJ-1 KO RPE cells displayed accumulation of vacuoles in their cytoplasm (Fig. 1L, 1N, arrows) when compared to the control RPE cells (Fig. 1K, 1M). No significant changes in the thickness of any of the retinal layers analyzed were observed at 3 months (Fig. 1O). In contrast, significant decrease in thickness of the photoreceptor IS/OS (29%), ONL (27%), OPL (12%) and overall retina (17.4%) was identified in the 18 month-old DJ-1 KO retinas when compared to age-matched control mice (Fig. 1O).
Ultrastructural analysis of the photoreceptor OS and RPE from control and DJ-1 KO mice was also carried out by transmission electron microscopy (Fig. 1P to 1W). One hundred percent of control photoreceptor outer segments of both 3-month (Fig. 1P) and 18 month-old (Fig. 1R) mice displayed the typical, flat lobulated discs arranged in parallel stacks. The 3-month-old (Fig. 1Q) DJ-1 KO mice displayed photoreceptor OS with apparent osmotic fragility giving the appearance of swollen, vacuolized, and disorganized disc membranes. Moreover, the OS structure of the 18 month-old DJ-1 KO mice (Fig. 1S) was substantially disorganized and misaligned in comparison to age-matched control photoreceptor OS (Fig. 1R). The RPE apical surface elaborates apical microvilli (MV), while their basal surface is greatly increased by the presence of basal infoldings (BI). Both surface structures were visible and present in the RPE cells of from 3 month-old control (Fig. 1T), 3 month-old DJ-1 KO mice (Fig. 1U), and 18-month-old control (Fig. 1V) and DJ-1 KO mice (Fig. 1W). The cytoplasm of DJ-1 KO RPE was more vacuolated than the controls at both 3 months and 18-months of age (Fig. 1U & 1W, black asterisks). These results indicate that absence of DJ-1 leads to degenerative changes due to thinning in the OPL, ONL and photoreceptors IS and OS and alterations in the structure of the RPE cells.
3.2 Age-related functional and structural analysis of photoreceptors
After determining that photoreceptors are significantly compromised in aged DJ-1 KO mice, we decided to perform additional testing to determine whether this observation impacted retinal function and the distribution of abundant photoreceptor proteins. Representative strobe-flash ERG tracings from 3 of 10 stimuli are depicted for 3-month (Fig. 2B) and 18-month-old (Fig. 2D) mice. We initially observed, as previously published [11], that while there was no difference in amplitude of the a-wave or light-adapted cone response, the b-wave amplitude in the DJ-1 KO mice at 3 months tended to be larger than that of the controls (Fig 2B, C). However, in the 18 month DJ-1 KO mice, the a-wave amplitude was significantly smaller at 18 months as compared to 3 months (Fig 2A, B, D). The DJ-1 KO a-wave amplitude at 18 months was also significantly smaller than the control response at the same age (Fig. 2A, D). Contrary to our findings of larger b-wave amplitudes at 3 months of age, we also identified a decrease in 18 month-old DJ-1 KO b-wave (Fig. 2C, D) amplitude in response to all stimuli presented, but which was significantly different at the − 0.6 to −1.8 and 2.1 log cd s/m2 stimuli by ANOVA. While the DJ-1 KO b-wave amplitude was always smaller than the control b-wave amplitude at each stimulus, no significant difference in b-wave amplitude was found between genotypes by two-way ANOVA. Stimulus-response function (Fig. 2E) and representative (Fig. 2F) cone ERG responses measured in the presence of a light-adapting field were also generated and analyzed. For both the 18-month-old DJ-1 KO and control mice, the cone ERG was significantly decreased in response to the 0.9 to 1.9 log cd s/m2 stimuli in comparison to young mice by ANOVA. (For all graphs, *p<0.05; **p<0.001; ***p<0.0001; Statistical significance for all comparisons is documented in Supplemental Table 2).
Fig. 2. Effects of loss of DJ-1 on photoreceptors.

ERG tracings measured from 3-month- (B) and 18-month-old (D) mice and plotted ERG a-wave (A) and b-wave (C) amplitudes; the a-wave amplitude for the DJ-1 KO mice was significantly smaller at 18 months as compared to 3 month-old control and DJ-1 KO (A). The decrease in 18 month-old DJ-1 KO b-wave (C) was significant only at the - 0.6 to −1.8 and 2.1 log cd s/m2 stimuli by ANOVA. Stimulus-response function (E) and representative cone ERG tracings (F) obtained from 18-month-old DJ-1 KO mice were significantly decreased in response to the 0.4 to 1.9 log cd s/m2 stimuli (For all graphs, *p<0.05; **p<0.001; ***p<0.0001). (For the strobe flash and light adapted ERG, 3mo control, n=3; 3mo DJ-1 KO, n=8; 18mo control, n=4; 18mo DJ-1 KO, n=8.) Staining of retinal sections labeled with red/green opsin (green) and rhodopsin (red) antibodies around optic nerve region from 3-month- (G, H) and 18-month-old (I, J) mice. Comparable distribution of both cone and rod OS were observed in both mice at 3 months of age. At 18 months of age the DJ-1 KO retina (J) displayed decreased immunoreactivity to rhodopsin and decreased patchy distribution of red/green opsin. Retina whole-mounts labeled with red/green cone opsin at 3 month (K. L) and 18 months (M, N) of age. At 3 months both control (K) and DJ-1 KO (L) displayed comparable labeling for red/green opsin homogeneously expressed across the retina. At 18 months the DJ-1 KO mice displayed patchy regions with notably decreased immunodetection of red/green opsin and the presence of outer segments wider and less organized (N, arrows). Quantitation of the red/green opsin immunoreactivity (O) identified significant decreased in the signal intensity of this opsin in both the 3- and 18 month-old DJ-1 KO when compared to control retinas.
To determine whether the decrease in ERG responses was due to changes in light-sensitive proteins found in photoreceptor cell proteins, we compared retinal sections obtained from young and aged control and DJ-1 KO mice. Confocal microscopy examination of retinal sections of 3 month-old control (Fig. 2G) and DJ-1 KO (Fig. 2H) around the optic nerve region revealed comparable immunocytochemical staining for both red/green opsin (Fig. 2G to J, green) and rhodopsin (Fig. 2G to J, red). Retinal sections of 18 month-old control (Fig. 2I) and DJ-1 KO (Fig. 2J) revealed notably decreased immunocytochemical staining for both red/green opsin and rhodopsin around the optic nerve region. Moreover, 18 month-old DJ-1 KO retinas displayed striking decreased red/green opsin and rhodopsin immunoreactivity as compared to control retinas. These observations were more easily identified when higher magnification images of these sections were acquired in the periphery and central regions of these retinas (Supplemental Fig. 2).
Since our observations of the whole retinal sections labeled with red/green cone opsin suggested sparse distribution of these proteins in the aged DJ-1 KO, we proceeded to analyze whole-mounted retinas labeled with this same antibody. At 3 months both control (Fig. 2K) and DJ-1 KO (Fig. 2L) displayed comparable labeling for red/green opsin homogeneously expressed across the retina. However, the 18 month-old DJ-1 KO mice displayed patchy regions with a noticeable decreased immunodetection of red/green opsin (Fig. 2N) when compared to age-matched controls (Fig. 2M). Cone outer segments in these mice were frequently wider and less organized (Fig. 2N, arrows). These results demonstrated that the aged DJ-1 KO retina has degenerative changes that affect both rod and cone photoreceptors.
3.3 Age-related functional and structural analysis of RPE
After determining that the DJ-1 KO RPE was significantly impacted from aging (Fig. 1J, 1N), we carried out both morphological and functional analysis of these cells (Fig. 3). Representative light-evoked responses of the RPE (dc-ERG) tracings, generated secondary to rod photoreceptor activity in the form of a c-wave, fast oscillation, light peak, and off-response are depicted for 3-month (Fig. 3A) and 18-month-old (Fig. 3B) mice. The overall amplitude of the dc-ERG was decreased for both the B6 and the DJ-1 KO mice from 3 to 18 months of age (Fig. 3A–B). However, the reduction in the DJ-1 KO mice from 3 to18 months of age was greater than that observed in the B6 control mice. A significant decrease was detected between the 3 month- and 18-month-old DJ-1 KO for the c-wave (80%, Fig. 3C), fast oscillation (75%, Fig. 3D), and the off response (80%, Fig. 3F). Interestingly, between genotypes, we noted only a significant reduction by two-way ANOVA for the off response in 3-month-old mice (Fig. 3F). Statistical analyses are tabulated in Supplemental Table 2.
Fig. 3. Effects of loss of DJ-1 on RPE.

dc-ERG tracings measured at 3-month- (A) and 18-month-old (B) mice and plotted ERG c-wave (C), fast oscillation (D), light peak (E) and off responses (F). At both 3 (A) and 18 months (B) of age, the overall amplitude of the dc-ERG of DJ-1 KO mice was decreased. Significant decrease was determined for the off response in 3-month-old mice (a 80% reduction – between 3 and 18 months for the DJ1 KO; 70% reduction between 18-month-old control and 18 -month-old DJ-1 KO, F). (For the dc-ERG, 3mo control, n=3; 3mo DJ-1 KO, n=6; 18mo control, n=3; 18mo DJ-1 KO, n=4.) Light microscopy images of toluidine blue stained plastic sections of RPE from 3-month- (G) and 18-month-old (I) control mice compared to 3-month- (H) and 18-month-old (J) DJ-1 KO mice; both young and aged DJ-1 KO RPE displayed accumulation of vacuoles (arrowheads). Quantification of the mean RPE thickness (K) and number of cytosolic vacuoles (L) determined significant increase in the RPE thickness (brackets) of 18 month-old control mice; the number of vacuoles was increased in DJ-1 KO both in 3 moth- and 18 month-old mice; data are expressed as me (*p=0.0430 in K, and *p=0.0208, **p=0.0081 in L). Images recurrently detected the presence of enlarged RPE (asterisks) in 18 month-old DJ-1 KO (N, P, R, T) but not control (M, O, Q, S) mice in OCT imaging (M, N), toluidine blue sections (O, P), and cryosections displaying immunoreactivity (S, T) or not (Q, R) to ezrin antibodies. At 18 months, DJ-1 KO RPE/choroid whole-mounts labeled with phalloidin frequently displayed cytoskeleton remodeling of the RPE cells surrounding the enlarged RPE (V, arrowheads); such enlarged cells within the RPE layer were mostly absent from age-matched control mice (U). Quantification of enlarged RPE cells (W) exposed a significant increase in the 18 month-old DJ-1 KO when compared to age-matched control whole-mounts (*p<0.0001).
As we identified RPE functional decay, we proceeded to perform a detailed analysis of histological sections from both young and aged control and DJ-1 KO mice (Fig. 3G to 3J). Observation of the posterior retina of the DJ-1 KO and control mice suggested RPE thinning, which was quantified (Fig. 3K). The mean RPE thicknesses for the 3-month-old control (Fig. 3G) and DJ-1 KO (Fig. 3H) groups were 4.73 μm and 4.45 μm, respectively; which was not significantly different. At 18 months, the RPE of aged-control mice displayed a significant increase (*p=0.0430) in thickness compared to young, 3 month-old controls. The mean RPE thickness of the 18-month-old control (Fig. 3I) and DJ-1 KO (Fig. 3H) mice was 5.46 μm and 5.33 μm, respectively; which was not significantly different.
RPE of the DJ-1 KO mice displayed abnormal morphology with vacuole formation, a sign of RPE degeneration, both in the 3 month- (Fig. 3H, arrowheads) and 18 month-old (Fig. 3J, arrowheads) mice. Only a few vacuoles were present in the cytoplasm of RPE cells from both 3 month- (Fig. 3G) and 18 month-old (Fig. 3I) control mice. However, quantification of RPE vacuoles in the cytoplasm of both 3 month- and 18 month-old DJ-1 KO mice confirmed a significant increase when compared to control RPE (Fig. 3L). The average number of vacuoles present in 3 month-old control RPE cells was 1.2, but in the DJ-1 KO RPE, this number increased to 4.8. Similarly, the average number of vacuoles present in 18 month-old control RPE cells was 0.9, but in the DJ-1 KO RPE, this number increased to 4.9.
At 18 months of age the RPE also displayed more pronounced changes such as the presence of localized RPE atrophy (Fig. 3M to 3V); these structures varied in size and were observed throughout the RPE monolayer. In-vivo SD-OCT imaging detected the presence of a gentle mound RPE contour in the retinas of 18 month-old DJ-1 KO mice (Fig. 3N, asterisk) which was never observed in the RPE cells from 18 month-old control mice (Fig. 3M). Similarly, in histological sections, enlarged RPE were present in focal areas within the RPE layer of the 18 month-old DJ-1 KO retinas (Fig. 3P, asterisk) and not in the RPE layer of the 18 month-old control retinas (Fig. 3O). The enlarged RPE cells were accompanied by disorganization and shortening of the overlying photoreceptor outer segments. RPE of aged control and DJ-1 KO mouse retinas was visualized by differential interference contrast (DIC, Figs. 3Q, 3R), by labeling of cryosections with ezrin antibodies (Fig. 3S, 3T) to highlight the RPE microvilli, and by labeling RPE/choroid whole-mounts with phalloidin-TRITC to highlight actin filaments (Fig. 3V). Using these methods enlarged RPE within the RPE layer were frequently observed in the 18 month-old DJ-1 KO RPE (Figs. 3R, 3T, 3V, asterisks) but not in the control RPE (Figs. 3Q, 3S, 3U). Quantification of these features confirmed that their presence is significantly increased in the cytoplasm of 18 month-old DJ-1 KO when compared to age-matched control RPE (Fig. 3W). The average number of enlarged RPE cellls present in 18 month-old control whole-mounts was 3, but in the DJ-1 KO, this number increased to 6.75. Also, RPE/choroid whole-mounts labeled with phalloidin-TRITC and Tom20 displayed the increased presence of fragmented mitochondria in the enlarged RPE cells. The RPE cells surrounding these enlarged RPE lost their hexagonal shape and displayed decreased presence of mitochondria (Supplemental Fig. 3). These results demonstrated that the RPE of the DJ-1 KO mouse displays degenerative changes.
3.4 Age-related analysis of oxidative stress in the retina
The transcription factor nuclear factor erythroid 2-related factor 2 (Nrf2) is the key regulator of responses to endogenous and exogenous oxidative stresses. Since DJ-1 prevents the interaction of Nrf2 with its inhibitor protein Kelch-like ECH associated protein 1 (keap1) in the cytoplasm [18–20], we measured the DNA binding activity of activated Nrf2 in the retina/RPE of control and DJ-1 KO mice. Significantly less Nrf2 was activated and bound to its ARE-binding sequence in lysates from DJ-1 KO at both 3 months and 18 months of age when compared to age-matched controls (Fig. 4A). Moreover, in the DJ-1 KO mice significantly less Nrf2 was activated in the 18 month-old in comparison to the 3 month-old retinas. Since the most common products of protein oxidation in biological samples are the carbonyl derivatives of proline, lysine, arginine and threonine residues [21], these derivatives were measured in the retina/RPE of control and DJ-1 KO mice. Significantly increased protein carbonyl content was measured in lysates from DJ-1 KO at 3 month- and 18 months of age when compared to age-matched controls (Fig. 4B). Inducible nitric oxide synthase (iNOS) is a pro-inflammatory enzyme generated in inflammatory ocular pathologic conditions such as diabetic retinopathy, macular degeneration and glaucoma [22–24]. Immunoblots of lysates revealed that 3 month-old DJ-1 KO retinas displayed significant increased iNOS immunoreactivity (Fig. 4C, lanes 4 to 6) when compared to 3 month-old control retinas (Fig. 4C, lanes 1 to 3) and normalized to the levels of GAPDH. Notably, iNOS immunoreactivity was significantly increased in the lysates of 18 month-old control (Fig. 4C, lanes 7 to 9) and DJ-1 KO mice (Fig. 4, lanes 10 to 12). Quantification of these lysates demonstrated a 8.5 fold increase in the iNOS content of 3 month-old DJ-1 KO lysates, when comparing iNOS immunoreactivity to the one of 3 month-old control (Fig. 4D). These results demonstrated that absence of DJ-1 leads to increase in markers of oxidative stress and inflammation in the retinas of DJ-1 KO mice.
Fig. 4. Effects of loss of DJ-1 on retinal oxidative stress.
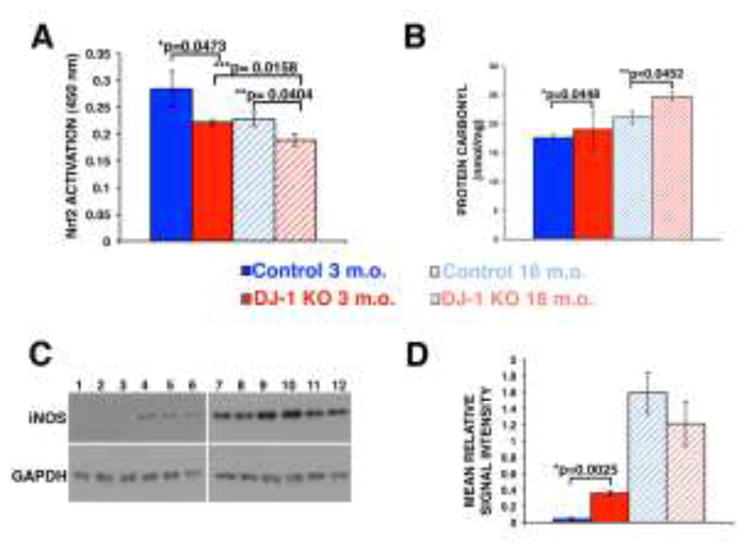
Quantification of the ARE-nuclear binding of Nrf2 by ELISA TransAM kit (A) at 3-month- and 18-month-old control mice compared to 3-month- and 18-month-old DJ-1 KO mice; significant decrease in the DNA binding activity of Nrf2 was detected in both the 3 month- and 18 month-old DJ-1 KO mice. Data are expressed as relative arbitrary units ± SEM (n=5); *p<0.0473 and **p=0.0404 compared with control. (B) Quantitation of the protein carbonyls formation; significant increase was detected in both 3-month- and 18-month-old DJ-1 KO lysates when compared to control. Data are expressed as relative arbitrary units ± SEM (n=5); *p=0448, **p=0.0452. Representative western blots for iNOS (C) in 3-month- and 18-month-old control and DJ-1 KO; significant increased iNOS immunoreactivity (C, lanes 4 to 6) was observed in 3 month-old DJ-1 KO lysates when compared to control (C, lanes 1 to 3). In addition, iNOS immunoreactivity was significantly increased in the lysates of 18 month-old control (C, lanes 7 to 9) and DJ-1 KO mice (C, lanes 10 to 12). Quantification of the signal intensities (D) demonstrated a 8.5 fold increase in the iNOS content of 3 month-old DJ-1 KO lysates, when compared to iNOS immunoreactivity of 3 month-old control; *p=0.0025.
4. Discussion
The ability of DJ-1 to protect from oxidative stress in several cell types has been widely reported [25–28]. Mutations and deletion in the DJ-1 gene (PARK7) result in early-onset PD in patients and in loss of the entire protein or loss-of-function versions of the protein [6]. Our previous work also reported for the first time the anti-oxidant protection provided by DJ-1 in RPE cells in vitro and in the retina of DJ-1-deficient mice in vivo [10, 11]. Thus, the DJ-1-deficient mice analyzed here, generated by deletion of the first coding exon (exon 2) [12], are appropriate to predict retinal changes that are likely in this subset of PD patients. The percent of patients with PD due to PARK7 mutations that also develop retinal changes is not known but our results suggest that the standard of care for these patients should include monitoring their retinas and visual function. Additionally, DJ-1 is also a multifunctional protein that plays an important role in the oxidative stress response in sporadic PD [1–3] and in neurodegenerative disorders such as ALS [4], AD [2] and HD [5].
Age-related macular degeneration (AMD) is the leading cause of severe, irreversible vision loss in the elderly population of industrialized countries [29, 30]. The vision loss observed in AMD is a result of impairment of the macular photoreceptors, RPE, and choroid. AMD etiology is complex because it includes the interaction of both genetic components and environmental risk factors [31–35]. Recent studies suggest that oxidative stress and chronic inflammation are elicited by genetic and environmental risk factors such as cigarette smoking, nutritional deficits, sunlight exposure or low ocular melanin to drive the AMD pathogenesis [36]. Here, we evaluated the effect of DJ-1 absence during retinal aging in DJ-1 KO mice. Our data indicates the older DJ-1 KO mice show degeneration of RPE cells and photoreceptors associated with increased chronic oxidative stress. Therefore, our findings are of relevance to AMD. Indeed, our findings in the DJ-1 KO mice are comparable to findings in several mouse models that attempt to recapitulate AMD pathology by increasing retinal oxidative stress with systemic iron overload [37], by knocking out Sod1 [38], Sod-2 [39], or inserting the human apoB100 transgene in mice [40]. These mouse models displayed progressive retinal degeneration starting at 2 and 7–8 months and continuing to at least 9–12 months. As in the DJ-1 KO mice, the degeneration in these mouse models included changes in RPE morphology, photoreceptor degeneration, and oxidative stress. Although vacuoles are uncommon in AMD patients, several of the AMD mouse models also reported accumulation of vacuoles in the RPE. This phenotype may represent a difference between the physiology of the RPE from mice and humans.
Previously we reported that DJ-1 is highly expressed in the RPE and photoreceptor cells, mostly at the inner segments and cell body, while DJ-1 also displays lesser expression in the OPL [11]. Our data showed that 18 month-old DJ-1-deficient retinas display reduced thickness of the photoreceptor IS/OS, ONL, OPL and overall retina. These phenotypic changes are localized to cells in the retinal lamina known to express DJ-1. Previous studies also reported decreased retinal thickness during aging and age-related pathological conditions such as AD, PD and AMD [39, 41–44].
In the retina dopamine neurons are present in the IPL, GCL, OPL, and the OS of photoreceptors [45]. In addition, levodopa, a dopamine precursor, is produced by RPE as an intermediate product in the melanin biosynthetic pathway [46]. Visual symptoms such as dimness, blurring, blunted shapes, double vision and difficulty reading, and complex visual hallucinations are common features in PD [47–51]. These symptoms have been correlated to psychophysical, electrophysiological and morphological disruption of retinal structure and function, in addition to disorders of ‘higher’ (cortical) visual processing [45]. OCT has been used to identify retinal nerve fiber layer, IRL and foveal thinning in PD patients [52, 53].
OCT imaging of DJ-1 KO retinas shows a less well-delineated division between photoreceptor inner and outer segments when compared to controls. Similar changes in the optical reflectivity of the photoreceptor inner and outer segments were reported in rats injected with NaIO3 and are related to pathological changes in photoreceptor cells [54]. The ERG a-wave reflects photoreceptor activity. The a-wave amplitude and cone ERG responses of 18 month-old DJ-1 KO retinas were significantly reduced from age-matched control mice responses. These electrophysiological findings were corroborated by retinal sections labeled with antibodies specific to both red/green opsin and rhodopsin since 18 month-old DJ-1 KO retinas displayed striking decreased red/green opsin and rhodopsin immunoreactivity as compared to control retinas. Previous studies reported significant decline in rod number in retinas of a 70 year-old man and 2 year-old rodents, with an approximate of 30% of cells lost over lifetime [55–57]. We did not measure photoreceptor cell death specifically. However, our measurements of the IS/OS and ONL did not suggest significant decrease in rod nuclei and outer segment length in the aged control mice. This apparent discrepancy may be related to the age of the mice analyzed, time of death when the tissue was harvested for analysis, to the area within the retina that was analyzed, or it could be due to variations between different species. Interestingly, our data detected significant decrease in the cone ERG together with striking decrease in the red/green opsin immunoreactivity in the retinas of the 18-month-old DJ-1 KO mice but not of age-matched control mice. Previous studies identified a decline in the cone driven photopic ERG in aging mice but failed to detect changes in the number [57] and density [58] of cones in aged mice. More recently, a specific, significant decline was reported in immunoreactivity for red/green cone opsins in the periphery of C57BL/6 mice together with a decrease in quantitative real-time polymerase chain reaction for the two type of cone opsins [59]. Further experiments are needed to understand the basis for the accelerated decrease in cone function and immunoreactivity in the DJ-1 KO mice. However, our findings may be related to DJ-1 function in the mitochondria of these mice since cones contain twice as many mitochondria as rods in the mouse retina [60] and DJ-1 is known to localize and modulate mitochondrial function [26, 61, 62].
Pronounced changes were observed in the RPE in DJ-1 KO including reduced amplitude of the dc-ERG off response at both 3 and 18 months of age, and the presence of vacuoles and of enlarged cells. We previously noted the reduction of the off response at 3 months of age, which was not persistent at 6 months [11]; however, this deficit was present again at 18 months. The significance of the smaller off response amplitude is unclear as the origins of the dc-ERG off response are not currently understood [17]. Interestingly, and unlike the other dc-ERG components, the amplitude and polarity of the off response is intensity dependent. In three different mouse strains, at low flash intensities, the off response is negative; however with increasing flash intensities, the amplitude deceases before its polarity flips to a positive waveform and again grows in amplitude [17]. Therefore, it is entirely unclear how to interpret the significant reduction in only the off response at 3 months and 18 months. Unfortunately, due to the overall reduction in amplitude of each of the components because of the reductions to the a-wave and as a result of aging, the differences between the control mice and DJ-1 KO c-wave and fast oscillation were not statistically significant. Nevertheless, it is apparent that the RPE function is severely impaired in the DJ-1 KO at 18 months as evidenced by the significant reductions in c-wave and fast oscillation amplitudes in addition to the off response. These findings correlate with our structural findings. The presence of vacuolated and enlarged RPE are indicators of both widespread and isolated degeneration that suggest cellular stress or toxicity, that can ultimately lead to cell death and retinal dystrophy. Similar features have been reported in several other mouse models displaying age-related stress [40, 63–70]. Interestingly, we have previously reported similar RPE histology in young mice immunized with CEP-modified mouse serum albumin [71]. Our data showed that the enlarged RPE displayed fragmented mitochondria. Thus, we hypothesized that these cells are dying. Further experiments will be carried out to determine the cell death mechanisms (apoptosis or necrosis) affecting these RPE cells.
Significantly less Nrf2 was activated and bound to its ARE-binding sequence in lysates from DJ-1 KO at both 3 months and 18 months of age when compared to age-matched controls. These results are consistent the role of DJ-1 in preventing the interaction of Nrf2 with its inhibitor protein keap-1. Oxidative stress is caused by an imbalance between the production of reactive oxygen species (ROS), mostly in the mitochondria, and antioxidant protective mechanisms. Under stress conditions, RPE cells harness the master nuclear regulator Nrf2 to modify the transcription of genes encoding antioxidant proteins [72]. Indeed, increased transcriptional activity of Nrf2 protects RPE cells from oxidative injury [73] while mice lacking Nrf2 developed pathological features similar to human AMD [67]. Moreover, moderate but statistically significant decreases in both a- and b-wave amplitudes on ERG and histological confirmation of drusen formation, extensive RPE atrophy with numerous vacuoles, increased autofluorescence inside the RPE layer and CNV were observed in the Nrf2−/− at 12 months of age [67]. Further experiments are needed to understand the decrease in Nrf2 activation in aged control mice.
Lysates from DJ-1 KO at 3 month- and 18 months of age displayed increased protein carbonyl content (the most common products of protein oxidation in biological samples) when compared to age-matched controls. The increase in carbonylated proteins represents a hallmark of aged cells, organs and organisms and is believed to be causally involved in the functional decline and increased vulnerability that occurs during the aging process [74–76].
Significant increased immunological nitric oxide synthase (iNOS) immunoreactivity was detected in lysates of 3 month-old DJ-1 KO retinas when compared to 3 month-old control retinas. iNOS immunoreactivity was also significantly increased in the lysates of both 18 month-old control and DJ-1 KO mice. This enzyme is inducible in pathological conditions by endotoxins, inflammation, and certain cytokines. Once induced, iNOS floods the tissue with toxic concentrations of NO for long periods of time, so that it is converted into NO2, nitrite, peroxynitrite and free radicals, which induce pathophysiological actions, such as optic nerve degeneration and posterior retinal degeneration lesion, which lead to glaucoma, retinopathy, AMD, myopia, cataracts and uveitis [77, 78]. Previous studies reported increased expression of iNOS in rat retinas after continuous illumination [79], and in retinas of experimental diabetic rodents [80–82], among others.
The PD-associated gene DJ-1 encodes a protein that responds to and protects neurons from oxidative stress by inducing cell survival and antioxidative potential. Therefore, in summary, due to the evidence presented here connecting lack of DJ-1 to oxidative stress and retinal degeneration, it is conceivable that oxidative stress-degeneration observed in diseases such as AMD is mediated by loss of the antioxidant functions of DJ-1.
5. Conclusions
During aging, the retinas in DJ-1 KO mice show degenerative changes in photoreceptors and RPE cells due to loss of antioxidant protection afforded by DJ-1.
Supplementary Material
Highlights.
Decreased ERG values under dark- and light-adapted conditions in aged DJ-1 KO mice
Significant histological changes in the photoreceptors and RPE of aged DJ-1 KO mice
Progressive signs of retinal/RPE degeneration in aged DJ-1 KO mice
Increased levels of oxidative stress markers in aged DJ-1 KO mice
Acknowledgments
This work was supported by Research to Prevent Blindness, Wolf Family Foundation, Foundation Fighting Blindness, a VA Merit Award i01-BX002754 from Biomedical Laboratory Research and Development (ISS) and a National Eye Institute P30 Core Grant. The author thanks David Schumick, BS, CMI for the preparation of the graphic abstract.
Abbreviations
- PD
Parkinson’s disease
- DJ-1 KO
DJ-1 knockout
- RPE
retinal pigment epithelium
- ROS
reactive oxygen species
- AMD
age-related macular degeneration
Footnotes
Conflict of interest
None.
Publisher's Disclaimer: This is a PDF file of an unedited manuscript that has been accepted for publication. As a service to our customers we are providing this early version of the manuscript. The manuscript will undergo copyediting, typesetting, and review of the resulting proof before it is published in its final citable form. Please note that during the production process errors may be discovered which could affect the content, and all legal disclaimers that apply to the journal pertain.
References
- 1.Bandopadhyay R, et al. The expression of DJ-1 (PARK7) in normal human CNS and idiopathic Parkinson’s disease. Brain. 2004;127(Pt 2):420–30. doi: 10.1093/brain/awh054. [DOI] [PubMed] [Google Scholar]
- 2.Choi J, et al. Oxidative damage of DJ-1 is linked to sporadic Parkinson and Alzheimer diseases. J Biol Chem. 2006;281(16):10816–24. doi: 10.1074/jbc.M509079200. [DOI] [PMC free article] [PubMed] [Google Scholar]
- 3.Zhong Z, et al. Disassembled DJ-1 high molecular weight complex in cortex mitochondria from Parkinson’s disease patients. Mol Neurodegener. 2009;4:30. doi: 10.1186/1750-1326-4-30. [DOI] [PMC free article] [PubMed] [Google Scholar]
- 4.Lev N, et al. DJ-1 changes in G93A-SOD1 transgenic mice: implications for oxidative stress in ALS. J Mol Neurosci. 2009;38(2):94–102. doi: 10.1007/s12031-008-9138-7. [DOI] [PubMed] [Google Scholar]
- 5.Sajjad MU, et al. DJ-1 modulates aggregation and pathogenesis in models of Huntington’s disease. Hum Mol Genet. 2014;23(3):755–66. doi: 10.1093/hmg/ddt466. [DOI] [PubMed] [Google Scholar]
- 6.Bonifati V, et al. Mutations in the DJ-1 gene associated with autosomal recessive early-onset parkinsonism. Science. 2003;299(5604):256–9. doi: 10.1126/science.1077209. [DOI] [PubMed] [Google Scholar]
- 7.Hulleman JD, et al. Destabilization of DJ-1 by familial substitution and oxidative modifications: implications for Parkinson’s disease. Biochemistry. 2007;46(19):5776–89. doi: 10.1021/bi7001778. [DOI] [PubMed] [Google Scholar]
- 8.Abou-Sleiman PM, Healy DG, Wood NW. Causes of Parkinson’s disease: genetics of DJ-1. Cell Tissue Res. 2004;318(1):185–8. doi: 10.1007/s00441-004-0922-6. [DOI] [PubMed] [Google Scholar]
- 9.Gu X, et al. Age-related changes in the retinal pigment epithelium (RPE) PLoS One. 2012;7(6):e38673. doi: 10.1371/journal.pone.0038673. [DOI] [PMC free article] [PubMed] [Google Scholar]
- 10.Shadrach KG, et al. DJ-1-dependent regulation of oxidative stress in the retinal pigment epithelium (RPE) PLoS One. 2013;8(7):e67983. doi: 10.1371/journal.pone.0067983. [DOI] [PMC free article] [PubMed] [Google Scholar]
- 11.Bonilha VL, et al. Loss of DJ-1 elicits retinal abnormalities, visual dysfunction, and increased oxidative stress in mice. Exp Eye Res. 2015;139:22–36. doi: 10.1016/j.exer.2015.07.014. [DOI] [PMC free article] [PubMed] [Google Scholar]
- 12.Chandran JS, et al. Progressive behavioral deficits in DJ-1-deficient mice are associated with normal nigrostriatal function. Neurobiol Dis. 2008;29(3):505–14. doi: 10.1016/j.nbd.2007.11.011. [DOI] [PMC free article] [PubMed] [Google Scholar]
- 13.Mattapallil MJ, et al. The Rd8 mutation of the Crb1 gene is present in vendor lines of C57BL/6N mice and embryonic stem cells, and confounds ocular induced mutant phenotypes. Invest Ophthalmol Vis Sci. 2012;53(6):2921–7. doi: 10.1167/iovs.12-9662. [DOI] [PMC free article] [PubMed] [Google Scholar]
- 14.Curcio CA, et al. Distribution and morphology of human cone photoreceptors stained with anti-blue opsin. J Comp Neurol. 1991;312(4):610–24. doi: 10.1002/cne.903120411. [DOI] [PubMed] [Google Scholar]
- 15.Bell BA, et al. Baseline imaging reveals preexisting retinal abnormalities in mice. Adv Exp Med Biol. 2012;723:459–69. doi: 10.1007/978-1-4614-0631-0_58. [DOI] [PubMed] [Google Scholar]
- 16.Samuels IS, et al. Light-evoked responses of the retinal pigment epithelium: changes accompanying photoreceptor loss in the mouse. J Neurophysiol. 2010;104(1):391–402. doi: 10.1152/jn.00088.2010. [DOI] [PMC free article] [PubMed] [Google Scholar]
- 17.Wu J, Peachey NS, Marmorstein AD. Light-evoked responses of the mouse retinal pigment epithelium. J Neurophysiol. 2004;91(3):1134–42. doi: 10.1152/jn.00958.2003. [DOI] [PMC free article] [PubMed] [Google Scholar]
- 18.Clements CM, et al. DJ-1, a cancer- and Parkinson’s disease-associated protein, stabilizes the antioxidant transcriptional master regulator Nrf2. Proc Natl Acad Sci U S A. 2006;103(41):15091–6. doi: 10.1073/pnas.0607260103. [DOI] [PMC free article] [PubMed] [Google Scholar]
- 19.Malhotra D, et al. Decline in NRF2-regulated antioxidants in chronic obstructive pulmonary disease lungs due to loss of its positive regulator, DJ-1. Am J Respir Crit Care Med. 2008;178(6):592–604. doi: 10.1164/rccm.200803-380OC. [DOI] [PMC free article] [PubMed] [Google Scholar] [Retracted]
- 20.Gan L, Johnson DA, Johnson JA. Keap1-Nrf2 activation in the presence and absence of DJ-1. Eur J Neurosci. 2010;31(6):967–77. doi: 10.1111/j.1460-9568.2010.07138.x. [DOI] [PMC free article] [PubMed] [Google Scholar]
- 21.Madian AG, Regnier FE. Proteomic identification of carbonylated proteins and their oxidation sites. J Proteome Res. 2010;9(8):3766–80. doi: 10.1021/pr1002609. [DOI] [PMC free article] [PubMed] [Google Scholar]
- 22.Zheng L, et al. Salicylate-based anti-inflammatory drugs inhibit the early lesion of diabetic retinopathy. Diabetes. 2007;56(2):337–45. doi: 10.2337/db06-0789. [DOI] [PubMed] [Google Scholar]
- 23.Neufeld AH, Hernandez MR, Gonzalez M. Nitric oxide synthase in the human glaucomatous optic nerve head. Arch Ophthalmol. 1997;115(4):497–503. doi: 10.1001/archopht.1997.01100150499009. [DOI] [PubMed] [Google Scholar]
- 24.Cherepanoff S, et al. Bruch’s membrane and choroidal macrophages in early and advanced age-related macular degeneration. Br J Ophthalmol. 2010;94(7):918–25. doi: 10.1136/bjo.2009.165563. [DOI] [PubMed] [Google Scholar]
- 25.Yan YF, et al. DJ-1 upregulates anti-oxidant enzymes and attenuates hypoxia/re-oxygenation-induced oxidative stress by activation of the nuclear factor erythroid 2-like 2 signaling pathway. Mol Med Rep. 2015;12(3):4734–42. doi: 10.3892/mmr.2015.3947. [DOI] [PubMed] [Google Scholar]
- 26.Di Nottia M, et al. DJ-1 modulates mitochondrial response to oxidative stress: clues from a novel diagnosis of PARK7. Clin Genet. 2016 doi: 10.1111/cge.12841. [DOI] [PubMed] [Google Scholar]
- 27.Eltoweissy M, et al. Protein DJ-1 and its anti-oxidative stress function play an important role in renal cell mediated response to profibrotic agents. Mol Biosyst. 2016;12(6):1842–59. doi: 10.1039/c5mb00887e. [DOI] [PubMed] [Google Scholar]
- 28.Parsanejad M, et al. DJ-1 interacts with and regulates paraoxonase-2, an enzyme critical for neuronal survival in response to oxidative stress. PLoS One. 2014;9(9):e106601. doi: 10.1371/journal.pone.0106601. [DOI] [PMC free article] [PubMed] [Google Scholar]
- 29.Leibowitz HM, et al. The Framingham Eye Study monograph: An ophthalmological and epidemiological study of cataract, glaucoma, diabetic retinopathy, macular degeneration, and visual acuity in a general population of 2631 adults, 1973–1975. Surv Ophthalmol. 1980;24(Suppl):335–610. [PubMed] [Google Scholar]
- 30.Klein R, et al. The relationship of age-related maculopathy, cataract, and glaucoma to visual acuity. Invest Ophthalmol Vis Sci. 1995;36(1):182–91. [PubMed] [Google Scholar]
- 31.de Jong PT. Age-related macular degeneration. N Engl J Med. 2006;355(14):1474–85. doi: 10.1056/NEJMra062326. [DOI] [PubMed] [Google Scholar]
- 32.Nowak JZ. Age-related macular degeneration (AMD): pathogenesis and therapy. Pharmacol Rep. 2006;58(3):353–63. [PubMed] [Google Scholar]
- 33.Ding X, Patel M, Chan CC. Molecular pathology of age-related macular degeneration. Prog Retin Eye Res. 2009;28(1):1–18. doi: 10.1016/j.preteyeres.2008.10.001. [DOI] [PMC free article] [PubMed] [Google Scholar]
- 34.Kaarniranta K, et al. Age-related macular degeneration (AMD): Alzheimer’s disease in the eye? J Alzheimers Dis. 2011;24(4):615–31. doi: 10.3233/JAD-2011-101908. [DOI] [PubMed] [Google Scholar]
- 35.Kinnunen K, et al. Molecular mechanisms of retinal pigment epithelium damage and development of age-related macular degeneration. Acta Ophthalmol. 2012;90(4):299–309. doi: 10.1111/j.1755-3768.2011.02179.x. [DOI] [PubMed] [Google Scholar]
- 36.Pujol-Lereis LM, et al. Interrelation Between Oxidative Stress and Complement Activation in Models of Age-Related Macular Degeneration. Adv Exp Med Biol. 2016;854:87–93. doi: 10.1007/978-3-319-17121-0_13. [DOI] [PubMed] [Google Scholar]
- 37.Hadziahmetovic M, et al. Ceruloplasmin/hephaestin knockout mice model morphologic and molecular features of AMD. Invest Ophthalmol Vis Sci. 2008;49(6):2728–36. doi: 10.1167/iovs.07-1472. [DOI] [PMC free article] [PubMed] [Google Scholar]
- 38.Imamura Y, et al. Drusen, choroidal neovascularization, and retinal pigment epithelium dysfunction in SOD1-deficient mice: a model of age-related macular degeneration. Proc Natl Acad Sci U S A. 2006;103(30):11282–7. doi: 10.1073/pnas.0602131103. [DOI] [PMC free article] [PubMed] [Google Scholar]
- 39.Mao H, et al. Mitochondrial oxidative stress in the retinal pigment epithelium leads to localized retinal degeneration. Invest Ophthalmol Vis Sci. 2014;55(7):4613–27. doi: 10.1167/iovs.14-14633. [DOI] [PMC free article] [PubMed] [Google Scholar]
- 40.Fujihara M, et al. A human apoB100 transgenic mouse expresses human apoB100 in the RPE and develops features of early AMD. Exp Eye Res. 2009;88(6):1115–23. doi: 10.1016/j.exer.2009.01.017. [DOI] [PMC free article] [PubMed] [Google Scholar]
- 41.Hinton DR, et al. Optic-nerve degeneration in Alzheimer’s disease. N Engl J Med. 1986;315(8):485–7. doi: 10.1056/NEJM198608213150804. [DOI] [PubMed] [Google Scholar]
- 42.Ho WL, et al. Investigating degeneration of the retina in young and aged tau P301L mice. Life Sci. 2015;124:16–23. doi: 10.1016/j.lfs.2014.12.019. [DOI] [PubMed] [Google Scholar]
- 43.Kim CS, et al. Treadmill Exercise Attenuates Retinal Oxidative Stress in Naturally-Aged Mice: An Immunohistochemical Study. Int J Mol Sci. 2015;16(9):21008–20. doi: 10.3390/ijms160921008. [DOI] [PMC free article] [PubMed] [Google Scholar]
- 44.Samuel MA, et al. Age-related alterations in neurons of the mouse retina. J Neurosci. 2011;31(44):16033–44. doi: 10.1523/JNEUROSCI.3580-11.2011. [DOI] [PMC free article] [PubMed] [Google Scholar]
- 45.Archibald NK, et al. The retina in Parkinson’s disease. Brain. 2009;132(Pt 5):1128–45. doi: 10.1093/brain/awp068. [DOI] [PubMed] [Google Scholar]
- 46.Schraermeyer U, et al. Tyrosinase biosynthesis in adult mammalian retinal pigment epithelial cells. Exp Eye Res. 2006;83(2):315–21. doi: 10.1016/j.exer.2005.12.015. [DOI] [PubMed] [Google Scholar]
- 47.Bodis-Wollner I. The visual system in Parkinson’s disease. Res Publ Assoc Res Nerv Ment Dis. 1990;67:297–316. [PubMed] [Google Scholar]
- 48.Bodis-Wollner I. Visual electrophysiology in Parkinson’s disease: PERG, VEP and visual P300. Clin Electroencephalogr. 1997;28(3):143–7. doi: 10.1177/155005949702800305. [DOI] [PubMed] [Google Scholar]
- 49.Bodis-Wollner I. Visualizing the next steps in Parkinson disease. Arch Neurol. 2002;59(8):1233–4. doi: 10.1001/archneur.59.8.1233. [DOI] [PubMed] [Google Scholar]
- 50.Bodis-Wollner I. Foveal vision is impaired in Parkinson’s disease. Parkinsonism Relat Disord. 2013;19(1):1–14. doi: 10.1016/j.parkreldis.2012.07.012. [DOI] [PubMed] [Google Scholar]
- 51.Barnes J, David AS. Visual hallucinations in Parkinson’s disease: a review and phenomenological survey. J Neurol Neurosurg Psychiatry. 2001;70(6):727–33. doi: 10.1136/jnnp.70.6.727. [DOI] [PMC free article] [PubMed] [Google Scholar]
- 52.Satue M, et al. Use of Fourier-domain OCT to detect retinal nerve fiber layer degeneration in Parkinson’s disease patients. Eye (Lond) 2013;27(4):507–14. doi: 10.1038/eye.2013.4. [DOI] [PMC free article] [PubMed] [Google Scholar]
- 53.Garcia-Martin E, et al. Ability and reproducibility of Fourier-domain optical coherence tomography to detect retinal nerve fiber layer atrophy in Parkinson’s disease. Ophthalmology. 2012;119(10):2161–7. doi: 10.1016/j.ophtha.2012.05.003. [DOI] [PubMed] [Google Scholar]
- 54.Hariri S, et al. Noninvasive imaging of the early effect of sodium iodate toxicity in a rat model of outer retina degeneration with spectral domain optical coherence tomography. J Biomed Opt. 2013;18(2):26017. doi: 10.1117/1.JBO.18.2.026017. [DOI] [PubMed] [Google Scholar]
- 55.Cunea A, Jeffery G. The ageing photoreceptor. Vis Neurosci. 2007;24(2):151–5. doi: 10.1017/S0952523807070204. [DOI] [PubMed] [Google Scholar]
- 56.Curcio CA, et al. Aging of the human photoreceptor mosaic: evidence for selective vulnerability of rods in central retina. Invest Ophthalmol Vis Sci. 1993;34(12):3278–96. [PubMed] [Google Scholar]
- 57.Gresh J, et al. Structure-function analysis of rods and cones in juvenile, adult, and aged C57bl/6 and Balb/c mice. Vis Neurosci. 2003;20(2):211–20. doi: 10.1017/s0952523803202108. [DOI] [PubMed] [Google Scholar]
- 58.Williams GA, Jacobs GH. Cone-based vision in the aging mouse. Vision Res. 2007;47(15):2037–46. doi: 10.1016/j.visres.2007.03.023. [DOI] [PMC free article] [PubMed] [Google Scholar]
- 59.Cunea A, Powner MB, Jeffery G. Death by color: differential cone loss in the aging mouse retina. Neurobiol Aging. 2014;35(11):2584–91. doi: 10.1016/j.neurobiolaging.2014.05.012. [DOI] [PubMed] [Google Scholar]
- 60.Perkins GA, Ellisman MH, Fox DA. Three-dimensional analysis of mouse rod and cone mitochondrial cristae architecture: bioenergetic and functional implications. Mol Vis. 2003;9:60–73. [PubMed] [Google Scholar]
- 61.Canet-Aviles RM, et al. The Parkinson’s disease protein DJ-1 is neuroprotective due to cysteine-sulfinic acid-driven mitochondrial localization. Proc Natl Acad Sci U S A. 2004;101(24):9103–8. doi: 10.1073/pnas.0402959101. [DOI] [PMC free article] [PubMed] [Google Scholar]
- 62.Junn E, et al. Mitochondrial localization of DJ-1 leads to enhanced neuroprotection. J Neurosci Res. 2009;87(1):123–9. doi: 10.1002/jnr.21831. [DOI] [PMC free article] [PubMed] [Google Scholar]
- 63.Ambati J, et al. An animal model of age-related macular degeneration in senescent Ccl-2- or Ccr-2-deficient mice. Nat Med. 2003;9(11):1390–7. doi: 10.1038/nm950. [DOI] [PubMed] [Google Scholar]
- 64.Fu L, et al. The R345W mutation in EFEMP1 is pathogenic and causes AMD-like deposits in mice. Hum Mol Genet. 2007;16(20):2411–22. doi: 10.1093/hmg/ddm198. [DOI] [PubMed] [Google Scholar]
- 65.Justilien V, et al. SOD2 knockdown mouse model of early AMD. Invest Ophthalmol Vis Sci. 2007;48(10):4407–20. doi: 10.1167/iovs.07-0432. [DOI] [PMC free article] [PubMed] [Google Scholar]
- 66.Marmorstein LY, et al. Formation and progression of sub-retinal pigment epithelium deposits in Efemp1 mutation knock-in mice: a model for the early pathogenic course of macular degeneration. Hum Mol Genet. 2007;16(20):2423–32. doi: 10.1093/hmg/ddm199. [DOI] [PubMed] [Google Scholar]
- 67.Zhao Z, et al. Age-related retinopathy in NRF2-deficient mice. PLoS One. 2011;6(4):e19456. doi: 10.1371/journal.pone.0019456. [DOI] [PMC free article] [PubMed] [Google Scholar]
- 68.Perusek L, et al. Di-retinoid-pyridinium-ethanolamine (A2E) Accumulation and the Maintenance of the Visual Cycle Are Independent of Atg7-mediated Autophagy in the Retinal Pigmented Epithelium. J Biol Chem. 2015;290(48):29035–44. doi: 10.1074/jbc.M115.682310. [DOI] [PMC free article] [PubMed] [Google Scholar]
- 69.Lyzogubov VV, et al. The Complement Regulatory Protein CD46 Deficient Mouse Spontaneously Develops Dry-Type Age-Related Macular Degeneration-Like Phenotype. Am J Pathol. 2016;186(8):2088–104. doi: 10.1016/j.ajpath.2016.03.021. [DOI] [PMC free article] [PubMed] [Google Scholar]
- 70.Malek G, et al. Apolipoprotein E allele-dependent pathogenesis: a model for age-related retinal degeneration. Proc Natl Acad Sci U S A. 2005;102(33):11900–5. doi: 10.1073/pnas.0503015102. [DOI] [PMC free article] [PubMed] [Google Scholar]
- 71.Hollyfield JG, et al. Oxidative damage-induced inflammation initiates age-related macular degeneration. Nat Med. 2008;14(2):194–8. doi: 10.1038/nm1709. [DOI] [PMC free article] [PubMed] [Google Scholar]
- 72.Wang L, et al. Essential roles of the PI3 kinase/Akt pathway in regulating Nrf2-dependent antioxidant functions in the RPE. Invest Ophthalmol Vis Sci. 2008;49(4):1671–8. doi: 10.1167/iovs.07-1099. [DOI] [PMC free article] [PubMed] [Google Scholar]
- 73.Ha KN, et al. Increased glutathione synthesis through an ARE-Nrf2-dependent pathway by zinc in the RPE: implication for protection against oxidative stress. Invest Ophthalmol Vis Sci. 2006;47(6):2709–15. doi: 10.1167/iovs.05-1322. [DOI] [PubMed] [Google Scholar]
- 74.Stadtman ER. Protein oxidation in aging and age-related diseases. Ann N Y Acad Sci. 2001;928:22–38. doi: 10.1111/j.1749-6632.2001.tb05632.x. [DOI] [PubMed] [Google Scholar]
- 75.Baraibar MA, et al. Protein oxidative damage at the crossroads of cellular senescence, aging, and age-related diseases. Oxid Med Cell Longev. 2012;2012:919832. doi: 10.1155/2012/919832. [DOI] [PMC free article] [PubMed] [Google Scholar]
- 76.Baraibar MA, Ladouce R, Friguet B. Proteomic quantification and identification of carbonylated proteins upon oxidative stress and during cellular aging. J Proteomics. 2013;92:63–70. doi: 10.1016/j.jprot.2013.05.008. [DOI] [PubMed] [Google Scholar]
- 77.Chiou GC. Review: effects of nitric oxide on eye diseases and their treatment. J Ocul Pharmacol Ther. 2001;17(2):189–98. doi: 10.1089/10807680151125555. [DOI] [PubMed] [Google Scholar]
- 78.Toda N, Nakanishi-Toda M. Nitric oxide: ocular blood flow, glaucoma, and diabetic retinopathy. Prog Retin Eye Res. 2007;26(3):205–38. doi: 10.1016/j.preteyeres.2007.01.004. [DOI] [PubMed] [Google Scholar]
- 79.Piehl L, et al. Nitric oxide increases in the rat retina after continuous illumination. Brain Res. 2007;1156:112–9. doi: 10.1016/j.brainres.2007.04.030. [DOI] [PubMed] [Google Scholar]
- 80.Carmo A, et al. Nitric oxide synthase activity in retinas from non-insulin-dependent diabetic Goto-Kakizaki rats: correlation with blood-retinal barrier permeability. Nitric Oxide. 2000;4(6):590–6. doi: 10.1006/niox.2000.0312. [DOI] [PubMed] [Google Scholar]
- 81.Du Y, et al. Diabetes-induced nitrative stress in the retina, and correction by aminoguanidine. J Neurochem. 2002;80(5):771–9. doi: 10.1046/j.0022-3042.2001.00737.x. [DOI] [PubMed] [Google Scholar]
- 82.Leal EC, et al. Inducible nitric oxide synthase isoform is a key mediator of leukostasis and blood-retinal barrier breakdown in diabetic retinopathy. Invest Ophthalmol Vis Sci. 2007;48(11):5257–65. doi: 10.1167/iovs.07-0112. [DOI] [PubMed] [Google Scholar]
Associated Data
This section collects any data citations, data availability statements, or supplementary materials included in this article.