

Abstract
Background
Current exposure assessment research does not sufficiently address multi-pollutant exposure and their correlations in human media. Understanding the extent of chemical exposure in reproductive-aged women is of particular concern due to the potential for in utero exposure and fetal susceptibility.
Objectives
The objectives of this study were to characterize concentrations of chemical biomarkers during preconception and examine correlations between and within chemical classes.
Methods
We examined concentrations of 135 biomarkers from 16 chemical classes in blood and urine from 73 women aged 18–40 enrolled in Snart Foraeldre/Milieu, a prospective cohort study of pregnancy planners in Denmark (2011–2014). We compared biomarker concentrations with United States similarly-aged, non-pregnant women who participated in the National Health and Nutrition Environmental Survey (NHANES) and with other international biomonitoring studies. We performed principal component analysis to examine biomarker correlations.
Results
The mean number of biomarkers detected in the population was 92 (range: 60–108). The most commonly detected chemical classes were phthalates, metals, phytoestrogens and polycyclic aromatic hydrocarbons. Except blood mercury, urinary barium and enterolactone, geometric means were higher in women from NHANES. Chemical classes measured in urine generally did not load on a single component, suggesting high between-class correlation among urinary biomarkers, while there is high within-class correlation for biomarkers measured in serum and blood.
Conclusions
We identified ubiquitous exposure to multiple chemical classes in reproductive-aged Danish women, supporting the need for more research on chemical mixtures during preconception and early pregnancy. Inter- and intra-class correlation between measured biomarkers may reflect common exposure sources, specific lifestyle factors or shared metabolism pathways.
Keywords: Environmental exposures, NHANES, Biomonitoring, Principal component analysis, Pregnancy, Preconception
1. Introduction
In addition to evaluating the impact of exposure to individual chemicals on human health, new studies are beginning to jointly assess the effects of chemical mixtures (Braun et al., 2016; National Institute of Environmental Health Sciences [NIEHS], 2015a; Rider et al., 2013; Wild, 2005). Biomarkers of exposure assessed by biomonitoring (i.e. parent compounds and/or metabolites measured in biological media such as blood or urine) are typically considered one of the best measures to characterize the total amount of a chemical absorbed via multiple routes. However, the feasibility of collecting biomonitoring data on multiple chemicals within an individual is limited by the high cost of analysis and by statistical complexity of analyzing and interpreting results. Thus, most investigations are limited to either individual biomarkers or multiple biomarkers within the same class, such as metals, polychlorinated biphenyls (PCBs) or per- and polyfluoroalkyl substances (PFAS) (Cupul-Uicab et al., 2013; García-Esquinas et al., 2011; May et al., 2015; Sanders et al., 2015).
In an effort to characterize the exposome, or the totality of non-genetic exposures that a person experiences from conception until death along with the associated biological response, assessing biomarkers of exposure among women of childbearing age can help quantify a mother's contribution to their child's exposome during sensitive developmental periods (National Institute of Environmental Health Sciences [NIEHS], 2015b; Robinson and Vrijheid, 2015; Wild, 2005). Many chemical analytes within the same usage or chemical class are densely correlated (Rappaport, 2012; Robinson et al., 2015; Sun et al., 2013). The extent to which women of childbearing age are exposed to multiple chemicals and how these biomarkers of exposure correlate with each other is currently an active area of research (Agay-Shay et al., 2015; Patel and Ioannidis, 2014; Robinson et al., 2015; Woodruff et al., 2011). Analyzing correlations between biomarkers among women of childbearing age has several advantages: allow future investigators to focus on shared exposure sources, identify chemicals that may travel together in the body and observe which chemicals are likely to co-occur in order to direct research towards mixtures to which women of childbearing age are actually exposed.
Investigators have suggested some statistical approaches to quantify correlations between measured biomarkers of exposure. Most of these methods contain a data reduction component, whereby the magnitude of correlation between biomarkers identifies a new set of independent comparisons that is less than the number of biomarkers assessed. Principal Component Analysis (PCA) is one such method used to quantify correlations between exposures in the exposure assessment literature (Allen et al., 2008; Herrick et al., 2007; Robinson et al., 2015). PCA identifies the maximum amount of mutual correlation between groups of variables that explain latent variables, or components, that cannot be directly observed (Burstyn, 2004). Biomarkers are categorized under a given component based on their “loading,” which represents correlations between the biomarker and the underlying, latent factor, or component. Because the components are orthogonal, or statistically independent, biomarkers loaded within one component are said to have a low correlation with biomarkers loaded on all other components. The extent to which chemicals load to the final components may indicate common exposure sources within that component, such as chemicals that are found together in diet, consumer products or traffic pollution. Loading patterns may also suggest chemical biomarkers that are found at consistently high or consistently low concentrations among participants. PCA results can serve as a guide to confounder/co-exposure adjustment in statistical modelling for investigators evaluating associations between health outcomes and one or many chemical classes. PCA results may also identify the extent to which chemical exposures share common sources and pathways or jointly contribute to disease. While PCA has been commonly used in the occupational health literature, few investigators have used PCA in exposure assessment in women of childbearing age (Robinson and Vrijheid, 2015).
In the current study, we assessed preconception levels of 135 chemicals and/or their metabolites in the blood, serum and urine of 73 Danish women aged 18–40 participating in a prospective cohort study of pregnancy planners (2011–2014). These included metals, persistent chemicals, such as organochlorines, and non-persistent chemicals, such as phthalates, phytoestrogens and pesticides. We compared their concentrations with those of U.S. women of child-bearing age who participated in NHANES 2005–2012 and with other international biomonitoring studies (Cerna et al., 2012; Den Hond et al., 2015; Fréry et al., 2012; Haines and Murray, 2012; Kolossa-Gehring et al., 2012; Mørck et al., 2015b; Perez-Gomez et al., 2013; Schoeters et al., 2012). We used PCA to quantify the correlation of biomarkers between and within chemical classes. Unlike previous biomonitoring studies that only report on one or a few chemical classes, we measured concentrations of several chemical classes within the same individuals. We also reported on correlation patterns to gain a more thorough understanding of common co-exposures and the “pregnancy exposome.”
2. Methods
2.1. Study design
The current biomonitoring study, Snart Foraeldre/Milieu, English translation-‘Soon Parents/Environment’, is a sub-study of Snart Foraeldre (SF). SF is a prospective cohort study of Danish women from the general population who stopped using contraception because they wished to become pregnant (Huybrechts et al., 2010; Mikkelsen et al., 2009). All study recruitment and follow-up in the parent study, SF, is conducted via the Internet (www.snartforaeldre.dk). Participants for the study were recruited through advertisement on a popular Danish health-related website (www.netdoktor.dk), social media (e.g. Facebook), blogs and word of mouth. SF is a continuation of a previous study, Snart Gravid, for which study methods have been described in detail previously (Hatch et al., 2016; Huybrechts et al., 2010; Mikkelsen et al., in press, 2009; Wise et al., 2009).
Briefly, women eligible for SF are Danish residents, aged 18–40 years, in a stable relationship with a male partner, and not currently using any form of contraception or fertility drugs. Eligibility is assessed via an online screening questionnaire and participants complete an online consent form before enrollment. To enroll, women are required to provide a valid Civil Registration Number (CPR) and e-mail address. Informed consent was obtained by each participant over the Internet. The CPR number is used for linkage to Danish registries, such as the Danish Medical Birth Registry and the Danish National Registry of Patients. After completing an extensive baseline questionnaire, participants are followed via short bimonthly questionnaires until pregnancy is reported or for up to one year. A total of 3500 women have enrolled in SF since August 2011.
To enroll in the biomonitoring sub-study, SF/Milieu, women had to meet the above eligibility requirements and also live within the city limits of Aalborg, located in Northern Jutland. A total of 223 women from Aalborg enrolled in SF between November 2011 (when SF/Milieu study began) and December 2014. After completing the baseline questionnaire, they were invited to participate in the Milieu study. A total of 129 women (58%) agreed to participate in SF/Milieu. Women who enrolled in the study visited the clinical research laboratory at Aalborg University Hospital for blood and urine collection during the preconception period, and if pregnancy occurred, during the 1st (∼10 weeks) and 2nd (∼20 weeks) trimesters.
For the purposes of this study, we were interested in measuring chemical concentrations in women only during the preconception time period. At the time of this study, we collected biospecimen samples from 73 women in the first preconception visit. Of those 73, results from 16 urine samples were not reported due to improper aliquot mixing in the field. Therefore, the number of participants included in the analysis varied, with a total of 56 urine and 73 serum samples.
The SF/Milieu study was approved by the Danish Data Protection Board (2006-41-6864), the North Denmark Region Committee on Health Research Ethics (N-20100087) and the Institutional Review Board at Boston University. The analysis of blinded specimens by the Centers for Disease Control and Prevention (CDC) laboratory was determined not to constitute engagement in human subjects' research.
2.2. Biospecimen collection
Blood and urine specimens were collected using materials provided by the CDC, in accordance with protocols used for biomonitoring in NHANES (Centers for Disease Control and Prevention [CDC], 2014). We collected samples within one month of filling out the baseline questionnaire. After signing a written informed consent for blood and urine collection, participants reported time of last meal and date of last menstrual period. A trained phlebotomist first drew 3 mL aliquots of whole blood, which was immediately frozen for future quantification of metals. The remaining blood was collected in three 10 mL tubes (approximately 9 mL each) and allowed to clot for 2 h. After centrifuging, 4–5 mL of serum were transferred to 10 mL glass vials for measurement of brominated flame retardants (BFRs). Additional centrifuging was performed as necessary if red blood cells mixed with serum, and the remaining serum was transferred to Simport cryovials and frozen at −80 °C to be shipped to the CDC.
Polypropylene collection cups were provided to the participant for urine collection. Soon after receipt of the urine specimen, a trained technician prepared one aliquot for speciated arsenic and the remaining urine was frozen in the collection cup. Urine samples were frozen at −20 °C until shipped to the CDC where they were divided into eight more aliquots for analysis of the remaining chemical classes to be measured in urine.
2.3. Chemical analysis
Blood, serum and urine specimens were analyzed at the National Center for Environmental Health (NCEH) laboratories (CDC, Atlanta, GA). We chose chemicals for analysis if they were currently being measured as part of NHANES. Biomarkers measured in urine included: fifteen heavy and trace metals, seven arsenic species, ten polycyclic aromatic hydrocarbon (PAHs) metabolites, five phenols, four parabens, twelve phthalate metabolites, five diakylphosphate (DAP) metabolites, two herbicides, six organophosphate and pyrethroid insecticides metabolites, N,N-diethyl-meta-toluamide (DEET) and three metabolites, six phytoestrogens and perchlorate. Biomarkers measured in serum include: eleven BFRs, eight organochlorine pesticides, twenty-four PCBs, eight PFAS, and cotinine. We also measured five metals in whole blood.
We measured cadmium, lead and manganese in both blood and urine to maintain consistency with the NHANES panel and to provide flexibility for future epidemiological studies that wish to examine relationships between metals and outcomes with long or short latency periods. For instance, blood cadmium has been shown to reflect recent exposure, whereas urinary cadmium more accurately reflects long-term exposure (Adams and Newcomb, 2014). In addition, metals concentrations in different media have been shown to be differentially mediated by age and sex (Adams and Newcomb, 2014). Metals detected in both blood and urine are reported as independent due to their uncorrelated nature in both media (Adams and Newcomb, 2014; Gulson et al., 1998; Moreira and Neves, 2008). Similarly, total arsenic and arsenic metabolites are reported as independently detected because arsenic metabolites were not consistently detected in study participants, and to maintain consistency with the NHANES panel.
A total of 135 biomarkers were measured in blood, serum or urine. Table 1 summarizes the number of biomarkers measured in each media and the laboratory protocols used for each chemical class. The biomarkers measured in this study broadly overlapped with those currently measured in NHANES. CDC NHANES Laboratory Method Manuals may be found on the CDC website (http://wwwn.cdc.gov/nchs/nhanes/search/DataPage.aspx?Component=Laboratory), which includes information about analysis procedures and use of laboratory blanks during sample analysis.
Table 1.
Number of analytes measured in media and lab analytic methods.
| Chemical Class | Blood | Serum | Urine | Total | Method | Ref. |
|---|---|---|---|---|---|---|
| Cotinine | 1 | 1 | HPLC-APCI Tandem Mass Spectrometry | (Centers for Disease Control CDC, 2008) | ||
| Metals | 5 | 16 | 21 | ICP-DRC-MS, HPLE- ICP-DRS-MS (total arsenic) | (Centers for Disease Control CDC 2012a, 2012b) | |
| Arsenic Metabolites | 7 | 7 | HPLE-ICP-DRC-MS | (Centers for Disease Control CDC 2011a) | ||
| Polycylic Aromatic Hydrocarbons | 10 | 10 | GC-MS/MS | (Li et al., 2006) | ||
| Brominated Flame Retardants | 11 | 11 | GC-IDHRMS | (Jones et al. 2012) | ||
| Herbicides and Insecticides | 8 | 8 | RPHPLC and tandem mass spectrometry with isotope dilution quantitation | (Davis et al., 2013) | ||
| PCBs | 24 | 24 | GC-IDHRMS | (Jones et al., 2012) | ||
| Persistent Pesticides | 8 | 8 | GC-IDHRMS | (Jones et al., 2012) | ||
| Perchlorate | 1 | 1 | IC-MS/MS | (Centers for Disease Control CDC 2011b) | ||
| Phenols | 5 | 5 | HPLC-MS/MS | (Ye et al., 2005) | ||
| Parabens | 4 | 4 | HPLC-MS/MS | (Ye et al., 2005) | ||
| Phthalates | 12 | 12 | (HPLC)-electrospray ionization-tandem mass spectrometry | (Silva et al., 2007) | ||
| Phytoestrogens | 6 | 6 | LC-APPI-MS/MS NBB 4066 | (Centers for Disease Control CDC, 2010) | ||
| Per- and polyfluoroalkyl substances | 8 | 8 | extraction–HPLC–isotope dilution–tandem mass spectrometry | (Kato et al., 2011) | ||
| Dialkylphosphate Metabolites | 5 | 5 | HPLC- electrospray ionization-tandem mass spectrometry | (Odetokun et al., 2010) | ||
| DEET Metabolites | 4 | 4 | HPLC-MS/MS | (Kuklenyik et al., 2013) | ||
| TOTAL | 135 |
2.4. Statistical analysis
We compared descriptive statistics for biomarkers in SF/Milieu and NHANES populations. Publicly available data from NHANES are released in two-year cycles and include demographic characteristics and laboratory measurements for select biomarkers in blood, serum and urine. The list of select biomarkers changes with each data release. Therefore, we analyzed data from NHANES 2005–2006, 2007–2008, 2009–2010, and 2011–2012, to cover the complete set of biomarkers measured in SF/Milieu. We restricted the NHANES analysis to non-pregnant women between the ages of 18 and 40 to match the Danish study population characteristics. Data for organochlorine pesticides were only available in weighted serum samples prepared from one-third of the NHANES 2007–2008 population, pooled by gender (male, female), race and ethnicity (non-Hispanic white, non-Hispanic black, Mexican American) and age groups (12–19, 20–39, 40–59, and 60 years of age and older). Therefore, organochlorine pesticide data were restricted to women 20–39 years old. To account for the NHANES complex sample design, we used PROC SURVEY in SAS to calculate descriptive statistics (Centers for Disease Control and Prevention CDC, 2013).
We replaced concentrations below the limit of detect (LOD) with the LOD divided by the square root of two (Hornung and Reed, 1990). For most chemicals, the LOD is constant across samples. However, for polybrominated diphenyl ethers (PBDEs), PCBs, and organochlorine pesticides, each individual sample has its own LOD based on sample volume analyzed. For these chemicals, we reported the maximum LOD. We present descriptive statistics (range, geometric mean, detection frequency) for biomarkers that were detected in over 60% of the SF/Milieu samples.
We then performed principal component analysis (PCA) using PROC FACTOR (SAS version 9.3) in the SF/Milieu population to identify correlated biomarkers. After omitting the 16 participants with compromised urine samples, 1.5% of additional biomarker values were marked as missing due to insufficient sample volume. Because PCA omits individuals with any missing variables, we imputed missing values using multiple imputation by the Markov Chain Monte Carlo multivariate normal model (Schafer, 1997). Data were log-transformed within the imputation procedure to fulfill the normality assumption. We assessed the missing at random assumption by examining missing data patterns. This approach is appropriate for models that assume arbitrary missing, continuous data, such as PCA (van Ginkel and Kroonenberg, 2014). We imputed 15 datasets as recommended by Graham et al. (2007). Variables included as predictors of missing observations can be found in Supplemental Files. Imputed negative values were replaced with the biomarker LOD divided by the square root of 2.
We performed PCA on concentrations of creatinine-adjusted biomarkers measured in urine, volume-based blood metals and PFAS, and lipid-adjusted PBDEs, PCBs and persistent pesticides. We created three models for the PCA: all biomarkers combined (Model 1), urinary biomarkers only (Model 2) and serum and whole blood biomarkers only (Model 3). We restricted the analysis to biomarkers that were detected in 75% of the study population to enhance reliability in the PCA estimates. We used two methods to determine the optimal number of principal components to output for each model. These included visually examining the scree plot, an output of PCA analysis, which displays the component numbers on the x-axis and the eigenvalues, or the amount of variability explained by each component, on the y-axis and examining the proportion of variability in the data explained by each component. Additionally, we found that after three components for Model 1, and two components for Models 2 and 3, the proportion of variance explained by each additional component was due primarily to only one or a few biomarkers. Based on these considerations, we restricted Model 1 to three principal components and Models 2 and 3 to two components. We considered factor loadings greater than 0.25 to indicate a high loading.
We performed PCA separately on each imputed dataset and then averaged eigenvalues (a measure of the amount of variance explained by each biomarker along a given principal component) and component scores to determine analyte loadings on each component. We applied a varimax rotation due to the uncorrelated nature of the factor patterns. This step maximizes the sum of squared correlations between each biomarker and component, which simplifies the interpretation of each component. Using the PCA results, we examined biomarker correlations within each extracted component.
To examine if the loading patterns differed between imputed and non-imputed datasets, we performed PCA in 1) all 15 imputed datasets 2) one of the 15 imputed datasets 3) the original, unimputed data. We performed all statistical analyses in SAS (version 9.3; SAS Institute Inc., Cary, NC).
3. Results
Table 2 presents study population characteristics. The majority of the study population (n=73) was highly educated and either employed or a student (88%), with a median age of 28 years, (IQR 25–30.5). Participants were asked if they were regularly (daily or almost every day) exposed to pesticides, metal particulates, solvents, engine exhaust or cosmetic chemicals during work or home activities. A total of 13% of women reported being exposed to chemicals through their occupation, and 26% reported exposure to engine exhaust. About half of the population made below 39,999 Danish Krone per month ($5826 USD). Over half the women in the population were nulliparous, and most women had been trying to conceive between 1 and 3 months at enrollment. The population characteristics outlined in Table 2 are similar between the parent (SF) and this sub-study (Milieu) populations (data not shown). For example, both populations are highly educated, where 33% and 39% of the full SF and SF/Milieu populations, respectively, have advanced degrees. Similarities can also be found in employment status. In both the parent SF and Milieu population, greater than 50% are working and less than 10% are unemployed. Similarly, in the parent SF population, 27% are student and 34% are students in the Milieu population. Average age and BMI are almost identical in the two populations. A slightly higher percentage of participants (54%) have a monthly income greater than 39,999 DKK in the parent SF study compared Milieu participants (47%).
Table 2.
Characteristics of Snart Foraeldre/Milieu study population (n=73).
| n (%) | |
|---|---|
| Education | |
| Basic Schooling (9 years) | 3 (4.11) |
| Basic Schooling (> 9 years) | 64 (87.67) |
| Other schooling | 6 (8.22) |
| Additional Education | |
| None or Missing | 2 (2.74) |
| Short, < 3 years (e.g. carpenter, electrician, nurse and dental assistants) | 3 (4.11) |
| Medium, 3–4 years (e.g. teacher, RN nurse, B.A.) | 39 (53.42) |
| Long, > 4 years (e.g. Master degree or Ph.D.) | 29 (39.73) |
| Employment Status | |
| Work or apprenticeship | 39 (53.42) |
| Unemployed or unemployed in job training | 7 (9.59) |
| Student | 25 (34.25) |
| Other | 2 (2.74) |
| Household Income per Month | |
| Danish Krone < =39,999 | 35 (47.95) |
| Danish Krone >39,999 | 34 (46.58) |
| Refused or Don't Know | 4 (5.48) |
| Parity | |
| 0 | 51 (69.86) |
| 1 | 17 (23.29) |
| 2 | 5 (6.85) |
| Number Months Trying to Conceive | |
| Missing | 1 (1.37) |
| 0 | 14 (19.18) |
| 1–3 | 33 (45.21) |
| 4–7 | 15 (20.55) |
| 8–12 | 5 (6.85) |
| > 12 | 5 (6.85) |
| Smoking | |
| Ever smoker | 20 (27.40) |
| Never smoker | 53 (72.60) |
| Daily Exposure to: | |
| Agricultural pesticides | 1 (1.37) |
| Metal particulates or fumes | 1 (1.37) |
| Solvents, oil-based paints, or cleaning compounds | 5 (6.85) |
| Environments with temperatures above 25° | 3 (4.11) |
| Engine exhaust | 19 (26.03) |
| Mean ± SD | |
| Age | 28.1 ± 4.3 |
| BMI | 23.9 ± 4.6 |
Fig. 1 presents the number of chemical biomarkers detected in the 56 participants who had the complete set of chemical biomarkers measured in blood, serum or urine. Out of 135 measured biomarkers, the highest number detected in any individual was 108, and the lowest number was 60. The mean number of chemicals detected was 92 and the median was 95. Because lead, manganese and cadmium were measured in both blood and urine, Fig. S2 in the Supplemental Material presents the number of chemical biomarkers detected, with urinary lead, urinary manganese and blood cadmium omitted. By omitting these measures, the mean, minimum and maximum number of chemicals detected is 89, 58 and 105 respectively. Seven participants had cadmium detected in blood, but not in urine, one participant had lead detected in urine but not blood, and zero participants had cadmium detected in urine but not blood.
Fig. 1.
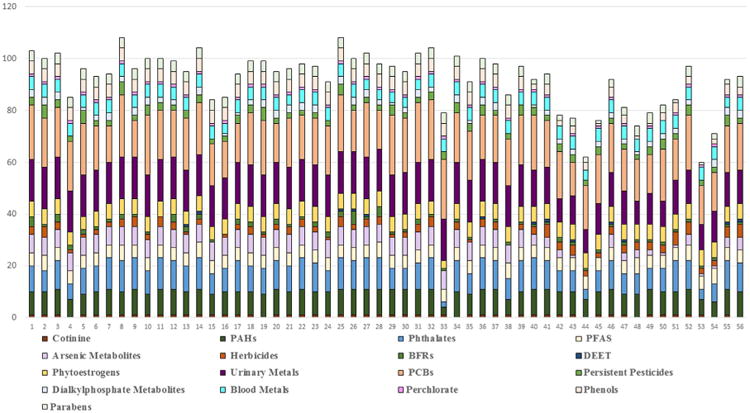
Number of biomarkers detected in each study participant (n=56). Each bar represents one individual. *Includes only those study participants with both urine and blood samples.
The following biomarkers were detected in 100% of participants: phytoestrogens (enterodiol, enterolactone, genistein), PCBs (PCB74, PCB 138–158, PCB 153, PCB180, PCB187), hexachlorobenzene (a persistent pesticide), perchlorate, PFAS (perfluorodecanoate, perfluorohexane sulfonate, perfluorononanoate, perfluorooctoanoate, perfluorooctane sulfonate), urinary metals (total arsenic, barium, thallium, strontium, molybdenum, cesium, cobalt), blood metals (manganese, lead, and selenium), and PAH metabolites (9-hydroxyfluorene, 2-hydroxynaphthalene and 2-hydroxyfluorene). With the exception of PBDE153, PBDEs were detected in less than 20% of the participants. Of the nine measured phenols, only bisphenol A (BPA), benzophenone-3, methyl paraben and propyl paraben had high detection frequencies (95%, 86%, 96% and 86% respectively). Triclosan was detected in only 52% of the population. Less than 30% of participants had detectable levels of most types of pyrethroids, DEET metabolites, and organophosphate (OP) pesticide metabolites. Among the pyrethroids, DEET and OP classes, only diethylphosphate and dimethylthiophosphate (DAP metabolites), 3-phenoxybenzoic acid (a non-specific pyrethroid metabolite) and para-nitrophenol (a metabolite of OP insecticides) were commonly detected (> 90%).
Table 3 presents concentrations of biomarkers in the Danish and NHANES populations that were detected in > 60% of the Danish population. Results are reported as volume-based (not creatinine- or lipid-adjusted). Table S1 in the Supplemental Files presents creatinine and lipid adjusted concentrations of chemicals presented in Table 3.
Table 3.
Chemical Analyte Descriptive Statistics in Snart Foraeldre/Milieu Population and NHANES Population.a,b
| Snart Foraeldre/Milieu | NHANESc | ||||||||||
|---|---|---|---|---|---|---|---|---|---|---|---|
|
|
|
||||||||||
| N | GM | 10th Pctl | 95th Pctl | % >LOD | Nc | GM | 10th Pctl | 95th Pctl | % >LOD | NHANES Year | |
| Cotinine (ng/mL) | |||||||||||
| Cotinine | 73 | 0.09 | 0.01 | 120 | 86 | 1216 | 36.58 | 0.011 | 258 | 100 | 11–12 |
| Metals_Blood (ng/mL except lead which is μg/dL) | |||||||||||
| Blood cadmium | 73 | 0.2 | 0.071 | 0.76 | 88 | 1234 | 0.46 | 0.11 | 1.57 | 84.12 | 11–12 |
| Blood manganese | 73 | 10.52 | 7.66 | 17.65 | 100 | 1234 | 10.95 | 6.84 | 18.69 | 100 | 11–12 |
| Blood lead | 73 | 0.81 | 0.53 | 1.58 | 100 | 1234 | 0.72 | 0.32 | 1.54 | 97.57 | 11–12 |
| Blood selenium | 73 | 115.02 | 98.52 | 140 | 100 | 1234 | 192.0 | 162.88 | 234.96 | 100 | 11–12 |
| Blood mercury, total | 73 | 1.59 | 0.69 | 5.2 | 97 | 1234 | 1.14 | 0.21 | 3.79 | 96.84 | 11–12 |
| Metals (ng/mL) | |||||||||||
| Barium | 50 | 0.68 | 0.17 | 2.7 | 100 | 410 | 1.57 | 0.29 | 4.34 | 98.54 | 11–12 |
| Cadmium | 50 | 0.1 | 0.03 | 0.52 | 80 | 410 | 0.19 | 0.04 | 0.63 | 80.73 | 11–12 |
| Cobalt | 50 | 0.28 | 0.07 | 1.06 | 100 | 410 | 0.55 | 0.10 | 1.58 | 98.78 | 11–12 |
| Cesium | 50 | 2.97 | 0.95 | 10.6 | 100 | 410 | 4.39 | 1.13 | 10.8 | 100 | 11–12 |
| Molybdenum | 50 | 25.98 | 5.54 | 134 | 100 | 410 | 47.01 | 9.04 | 121 | 100 | 11–12 |
| Lead | 50 | 0.24 | 0.08 | 0.88 | 98 | 410 | 0.35 | 0.06 | 1.58 | 91.22 | 11–12 |
| Antimony | 50 | 0.04 | 0.02 | 0.15 | 72 | 410 | 0.06 | 0.03 | 0.15 | 54.39 | 11–12 |
| Tin | 46 | 0.16 | 0.06 | 0.63 | 65 | 410 | 1.00 | 0.16 | 4.04 | 79.02 | 11–12 |
| Strontium | 50 | 79.69 | 22.06 | 333.39 | 100 | 410 | 107.94 | 20.04 | 282.98 | 100 | 11–12 |
| Thallium | 50 | 0.15 | 0.04 | 0.46 | 100 | 410 | 0.18 | 0.05 | 0.44 | 99.27 | 11–12 |
| Tungsten | 50 | 0.05 | 0.01 | 0.28 | 78 | 409 | 0.18 | 0.02 | 0.44 | 80.44 | 11–12 |
| Uranium | 50 | 0 | 0 | 0.02 | 68 | 410 | 0.01 | 0.002 | 0.02 | 64.88 | 11–12 |
| Arsenic, total | 57 | 9.25 | 1.9 | 48.34 | 100 | 410 | 14.77 | 1.83 | 54.90 | 94.15 | 11–12 |
| Arsenic Metabolites (ng/mL) | |||||||||||
| Arsenobetaine | 57 | 5.51 | 0.82 | 53.8 | 78 | 412 | 8.49 | 0.84 | 36.90 | 49.03 | 11–12 |
| Dimethylarsonic acid | 57 | 2.93 | 1.35 | 7.46 | 69 | 412 | 4.53 | 1.27 | 11.40 | 76.7 | 11–12 |
| Monomethylarsonic acid | 57 | 0.43 | 0.14 | 1.64 | 69 | 412 | 0.79 | 0.63 | 1.51 | 24.03 | 11–12 |
| PAH Biomarkers (ng/L) | |||||||||||
| 1-hydroxynaphthalene | 56 | 309.32 | 72.81 | 5907.16 | 98 | 410 | 3806.53 | 248 | 19,250 | 100 | 11–12 |
| 1-hydroxyphenanthrene | 56 | 67.92 | 23.26 | 589.83 | 98 | 410 | 178.78 | 36 | 540 | 99.76 | 11–12 |
| 1-hydroxypyrene | 56 | 58.96 | 20.00 | 458.60 | 98 | 410 | 212.64 | 34 | 671 | 99.27 | 11–12 |
| 2-hydroxyfluorene | 56 | 95.32 | 24.68 | 865.00 | 100 | 410 | 512.62 | 49 | 2394 | 100 | 11–12 |
| 2-hydroxynaphthalene | 56 | 1158.68 | 237.54 | 15,869.08 | 100 | 410 | 9464.10 | 854 | 30,078 | 100 | 11–12 |
| 2-hydroxyphenanthrene | 56 | 30.94 | 7.07 | 230.47 | 88 | 410 | 86.93 | 17 | 246 | 96.83 | 11–12 |
| 3-hydroxyfluorene | 56 | 39.49 | 10.61 | 499.19 | 91 | 409 | 244.84 | 16 | 1257 | 97.07 | 11–12 |
| 3-hydroxyphenanthrene | 56 | 30.68 | 7.07 | 278.56 | 84 | 410 | 91.71 | 15 | 295 | 94.39 | 11–12 |
| 4-hydroxyphenanthrene | 56 | 13.73 | 7.07 | 99.37 | 46 | 409 | 30.17 | 7.1 | 96 | 75.79 | 11–12 |
| 9-hydroxyfluorene | 56 | 113.1 | 28.81 | 1178.22 | 100 | 410 | 409.88 | 47 | 1216 | 100 | 11–12 |
| Brominated Flame Retardants (pg/g) | |||||||||||
| PBDE153 | 73 | 6.43 | 3.6 | 14.2 | 95 | 363 | 66.47 | 8.6 | 319.1 | 92.56 | 03–04 |
| PCBs (ng/g) | |||||||||||
| PCB99 | 73 | 0.02 | 0.01 | 0.04 | 99 | 326 | 0.02 | 0.01 | 0.06 | 100 | 03–04 |
| PCB138 & 158 | 73 | 0.11 | 0.05 | 0.28 | 100 | 332 | 0.07 | 0.02 | 0.18 | 100 | 03–04 |
| PCB146 | 73 | 0.02 | 0.01 | 0.06 | 99 | 331 | 0.01 | 0 | 0.02 | 98.49 | 03–04 |
| PCB153 | 73 | 0.16 | 0.07 | 0.39 | 100 | 331 | 0.08 | 0.02 | 0.22 | 100 | 03–04 |
| PCB170 | 73 | 0.04 | 0.02 | 0.12 | 99 | 332 | 0.02 | 0.01 | 0.05 | 97.69 | 03–04 |
| PCB178 | 73 | 0.01 | 0 | 0.03 | 82 | 331 | 0 | 0 | 0.01 | 71.3 | 03–04 |
| PCB180 | 73 | 0.10 | 0.04 | 0.28 | 100 | 332 | 0.06 | 0.01 | 0.16 | 100 | 03–04 |
| PCB183 | 73 | 0.01 | 0.01 | 0.03 | 96 | 332 | 0.01 | 0 | 0.02 | 87.95 | 03–04 |
| PCB187 | 72 | 0.03 | 0.01 | 0.09 | 100 | 332 | 0.02 | 0 | 0.04 | 98.8 | 03–04 |
| PCB194 | 73 | 0.01 | 0.01 | 0.04 | 25 | 322 | 0.01 | 0 | 0.04 | 78.26 | 03–04 |
| PCB199 | 73 | 0.01 | 0.00 | 0.04 | 86 | 330 | 0.01 | 0 | 0.03 | 85.76 | 03–04 |
| Persistent Pesticides (ng/g) | |||||||||||
| Hexachlorobenzene | 73 | 0.06 | 0.04 | 0.1 | 100 | 36 | 0.05 | 0.04 | 0.07 | 100 | 07–08 |
| p,p′-DDE | 73 | 0.18 | 0.09 | 0.62 | 99 | 36 | 1.14 | 0.41 | 2.63 | 100 | 07–08 |
| Perchlorate (ng/mL) | |||||||||||
| Perchlorate | 56 | 2.14 | 0.53 | 18.9 | 100 | 401 | 3.56 | 0.75 | 11.1 | 100 | 11–12 |
| Phenols (ng/mL) | |||||||||||
| Butyl Paraben | 56 | 0.29 | 0.53 | 1.58 | 63 | 409 | 3.31 | 0.14 | 16.2 | 46.21 | 11–12 |
| benzophenone-3 | 56 | 3.64 | 0.14 | 211 | 86 | 409 | 462.61 | 10.4 | 2230 | 99.76 | 11–12 |
| bisphenol A | 56 | 0.99 | 0.2 | 6.7 | 95 | 409 | 2.91 | 0.28 | 10.60 | 88.51 | 11–12 |
| Methyl Paraben | 56 | 18.16 | 2.2 | 475 | 96 | 409 | 264.89 | 7.30 | 1120.0 | 100 | 11–12 |
| Propyl Paraben | 56 | 1.67 | 0.07 | 228 | 86 | 409 | 80.65 | 1.20 | 309.0 | 99.27 | 11–12 |
| Phthalates (ng/mL) | |||||||||||
| Mono-n-butyl phthalate | 56 | 5.41 | 1.1 | 37.2 | 95 | 409 | 19.37 | 0.5 | 46.8 | 91.69 | 11–12 |
| Mono-benzyl phthalate | 56 | 1.37 | 0.21 | 10.2 | 82 | 409 | 10.11 | 0.50 | 37.3 | 97.56 | 11–12 |
| Mono(carboxynonyl) phthalate | 56 | 0.37 | 0.14 | 1.8 | 66 | 409 | 3.83 | 0.7 | 11.4 | 98.53 | 11–12 |
| Mono(carboxyoctyl) phthalate | 56 | 2.3 | 0.5 | 20.2 | 96 | 409 | 59.67 | 4 | 248.9 | 100 | 11–12 |
| Mono-(3-carboxypropyl) phthalate | 56 | 0.47 | 0.14 | 2.6 | 63 | 409 | 9.31 | 0.5 | 30.0 | 97.8 | 11–12 |
| Mono–2-ethyl–5-carboxypentyl phthalate | 56 | 4.72 | 1.1 | 31.6 | 98 | 409 | 25.08 | 3.1 | 76.8 | 99.76 | 11–12 |
| Mono–2-ethyl–5-hydroxyhexyl phthalate | 56 | 2.83 | 0.8 | 14.7 | 96 | 409 | 15.99 | 1.1 | 49.5 | 99.76 | 11–12 |
| Mono–2-ethylhexyl phthalate | 56 | 0.75 | 0.35 | 4.1 | 95 | 409 | 3.87 | 0.35 | 9.7 | 75.06 | 11–12 |
| Mono–2-ethyl–5-oxohexyl phthalate | 56 | 1.91 | 0.4 | 11.5 | 95 | 409 | 10.58 | 1.2 | 31.9 | 99.27 | 11–12 |
| Monoethyl phthalate | 56 | 12.53 | 2.1 | 163 | 98 | 409 | 138.24 | 12.5 | 388.0 | 99.76 | 11–12 |
| Mono-isobutyl phthalate | 56 | 11.72 | 1.8 | 138 | 100 | 409 | 11.71 | 1.2 | 35.1 | 98.53 | 11–12 |
| Phytoestrogens (ng/mL) | |||||||||||
| Daidzein | 56 | 34.75 | 2.6 | 791 | 98 | 497 | 462.34 | 6.5 | 1980 | 100 | 09–10 |
| O-Desmethylangolensin | 56 | 0.99 | 0.14 | 35.3 | 88 | 497 | 121.86 | 0.3 | 597 | 94.16 | 09–10 |
| Equol | 56 | 15.87 | 3.01 | 194 | 100 | 497 | 115.99 | 2.84 | 81.3 | 100 | 09–10 |
| Enterodiol | 56 | 82.11 | 8.2 | 1440 | 100 | 497 | 157.17 | 5.17 | 553 | 99.4 | 09–10 |
| Enterolactone | 56 | 836.79 | 141 | 8360 | 100 | 497 | 669.63 | 16.3 | 2610 | 100 | 09–10 |
| Genistein | 56 | 6.96 | 0.5 | 245 | 98 | 497 | 217.07 | 3.2 | 545 | 100 | 09–10 |
| Diakylphosphate Metabolites (ng/mL) | |||||||||||
| Diethylphosphate | 55 | 0.55 | 0.07 | 5.67 | 75 | 425 | 3.53 | 3.53 | 14.7 | 31.06 | 07–08 |
| Dimethylthiophosphate | 56 | 0.5 | 0.07 | 4.97 | 77 | 426 | 7.26 | 7.26 | 36.8 | 73.94 | 07–08 |
| Organophosphates (ng/mL) | |||||||||||
| 3,5,6-trichloropyridinol | 56 | 0.66 | 0.07 | 5.59 | 88 | 482 | 1.34 | 0.07 | 4.02 | 80.71 | 09–10 |
| Para-nitrophenol | 55 | 0.32 | 0.07 | 2.86 | 78 | 482 | 0.79 | 0.07 | 2.65 | 78.01 | 09–10 |
| PFAS (ng/mL) | |||||||||||
| Perfluorodecanoic acid | 73 | 0.27 | 0.2 | 0.5 | 100 | 375 | 0.24 | 0.07 | 0.64 | 80 | 11–12 |
| Perfluorohexane sulfonic acid | 73 | 0.31 | 0.2 | 0.7 | 100 | 375 | 1.21 | 0.33 | 4.28 | 97.87 | 11–12 |
| Perfluorononanoic acid | 73 | 0.58 | 0.3 | 1.1 | 100 | 375 | 0.93 | 0.37 | 2.07 | 99.73 | 11–12 |
| Perfluorooctanoic acid | 73 | 1.55 | 0.7 | 3.9 | 100 | 375 | 1.88 | 0.75 | 3.15 | 100 | 11–12 |
| Perfluorooctane sulfonic acid | 73 | 5.55 | 2.6 | 11.7 | 100 | 375 | 5.36 | 1.76 | 12.50 | 0 | 11–12 |
Biomarkers chosen for inclusion and if detected in over 60% of the population.
Results presented in volumetric concentrations.
The number of NHANES women included in analysis varied because of missing data, whether the biomarker was measured in a pooled subsample of the NHANES population and by sampling year. As a result, between 36 and 1234 women were included to obtain the NHANES concentrations for each biomarker. In the Danish study population, the number of women included in descriptive statistics analyses varied due to missing data.
In general, concentrations of chemicals were of the same order of magnitude in the two populations, although geometric means and 95th percentiles tended to be higher in NHANES. Only blood mercury, urinary barium and enterolactone, a phytoestrogen, had higher concentrations in the Danish study population. The most pronounced contrasts between the two populations were for PAHs, PBDE153, benzophenone-3, and phthalate metabolites, which had, on average, concentrations two, three, five, and two times higher, respectively, in NHANES.
Results of the PCA analysis are shown in Table 4, and component loadings are displayed in the Supplemental material, Tables S2A–S2C. To further identify commonalities between and within biomarker classes, we examined biomarker correlations within components. Below we discuss strong and moderate positive correlations. Heat maps displaying the correlations within each of the 7 components can be found in the Supplemental material, Figs. S1A–S1G.
Table 4.
Summary of correlations among 135 analytes measured in urine and blood among Snart Foraeldre/Milieu women (n=56). Includes only biomarkers detected in greater than 75% of the study population.a
| Component 1 | Component 2 | Component 3 | |
|---|---|---|---|
| Model 1: Blood and Urine | Blood Metals: manganese, Total Hg | Blood Metals: cadmium, lead |
PFAS: PFDeA, PFNA, PFOA |
|
Urinary Metals: cobalt, lead |
PCB28 | ||
| PFAS: PFHxS, PFOS | PBDE153 | ||
| Cotinine | PAHs: 1-hydroxyphenanthrene | ||
| Persistent Pesticides: hexachlorobenzene, pp′-DDE | PAHs | Urinary Metals: total arsenic, arsenobetaine | |
| PCBs | Perchlorate | Phthalates | |
|
Phthalate: Monoethyl phthalate Parabens: methyl-paraben, propyl-paraben |
Pesticides: para-Nitrophenol, 3,5,6-Trichloro-2-pyridinol, diethylphosphate | ||
| Proportion Variance Explained | 23% | 16% | 8.1% |
| Model 2: Urine Only | PAHs | Arsenic and Arsenic Metabolites | N/A |
| Phthalate: Monoethyl phthalate | Phthalates | ||
| Parabens: methyl-paraben, propyl-paraben | Pesticides: para-Nitrophenol, 3,5,6-Trichloro-2-pyridinol, diethylphosphate | ||
| Phytoestrogen: Equol | |||
| Urinary Metals: lead | Urinary Metals: strontium | ||
| Proportion Variance Explained | 24% | 14.9% | |
| Model 3: Serum and Whole Blood Only | Blood Metals: manganese, Total Hg | All PFAS biomarkers | N/A |
| Persistent Pesticides: hexachlorobenzene, pp′-DDE | Blood Metals: cadmium, lead | ||
| PCBs | Cotinine | ||
| PBDE153 | PCB28 | ||
| Proportion Variance Explained | 24% | 15.3% |
Biomarkers with loadings < 0.25 are not listed.
Model 1 includes biomarkers measured in blood, serum and urine from 56 women. The proportion of variance explained by the three components described is 47.1%. Persistent pesticides, PCBs and total mercury loaded on Component 1. Within Component 1, PCBs had high intra-class correlation, ranging from 0.33 to 0.98. Omitting PCB74 and PCB105, which were not correlated with other PCBs, intra-class correlation ranged from 0.50 to 0.98. Both hexachlorobenzene and 2,2-bis(4-chlorophenyl)-1,1-dichloroethene (pp′-DDE) were moderately correlated with PCBs (0.39–0.88). Although blood manganese and mercury loaded high on this component, they were not correlated with other biomarkers. PAHs, parabens, urinary metals and cotinine primarily comprised Component 2. We found that PAHs had high intra-class correlations (0.62–0.96), and were only highly correlated with perchlorate. PFAS biomarkers loaded separately on Components 2 and 3. Within Component 2, PFAS exhibited high intra- but not inter-class correlation. Phthalate metabolites, the primary chemical class loading on Component 3 of Model 1, also had high intra-class correlation, but only moderate correlations with PFAS and organophosphate metabolites. Of the 9 urinary trace and heavy metals detected in greater than 75% of the population, only cobalt and lead exhibited loadings greater than 0.25, the cutoff used for inclusion in any component. Phytoestrogens also did not load high on any components.
Among biomarkers measured only in urine, Model 2, two components explained 38.9% of the proportion total variance, and 11 components explained 100% of the variance (data not shown). In this model, PAHs, monoethyl phthalate and parabens loaded high on Component 1. Here, PAHs were moderately correlated with monoethyl phthalate. Arsenic and arsenic metabolites, all other phthalates and non-persistent pesticide metabolites largely explained Component 2. Here, total arsenic and arsenic metabolites had strong intraclass correlation and were moderately correlated with urinary strontium. Diethylphosphate, a nonspecific metabolite of OP pesticides, was also moderately correlated with 3,5,6-trichloro-2-pyridinol, a specific metabolite of the OP pesticide chlorpyrifos. With the exception of strontium and equol, all other urinary metals and phytoestrogens had component loadings less than 0.25.
For variables measured in blood and serum in Model 3, 39.3% of proportion of variance was explained by two components. Blood manganese, total mercury, PCBs and persistent pesticides loaded on Component 1. PFAS biomarkers, blood metals, cotinine and PCB28 explained Component 2. Biomarkers measured in blood and serum, exhibited fewer strong inter-class correlations than biomarkers measured in urine. The strongest correlations in this Model were PCBs 99, 238-158, 146, 153, 183 and 187 with pp′-DDE (Component 1). Blood metals had low intra- and inter-class correlation, while PFAS had high intra-class correlation (Component 2). Cotinine and blood cadmium in Model 3, Component 2 were moderately correlated (0.58).
We conducted sensitivity analyses to assess the potential effects of pregnancy status, batch analyses, and detection frequency on our results. Four of the 73 women included in the study were in their first trimester of pregnancy when they enrolled. We compared descriptive statistics between pregnant and non-pregnant women, finding that values within chemical classes and spread of the data were generally the same between the two groups. We performed a batch analysis to compare concentrations between the first and second round of samples. Using bivariate regression, we examined the percent variability in biomarker concentration explained by an indicator variable for batch. We found that batch did not explain enough variability in concentration to warrant stratification by batch. Finally, we compared PCA results between the original data, the variance-covariance matrix of the imputed data, one of the imputed datasets and all of the imputed datasets. We found that loading patterns, and variance explained by the four factors, were similar across datasets.
4. Discussion
We found extensive exposure to persistent and non-persistent chemicals in this population of 73 Danish women of reproductive age. To our knowledge, no previous studies have measured over 130 different chemical biomarkers or analyzed correlations between a large number of exposure biomarkers in samples collected from the same person in a Danish population. With the ability to measure a wide array of known chemical biomarkers, we were further able employ PCA to examine correlations.
On average, 91 different chemicals were detected in the Danish women who participated in our study, with a minimum of 60 and a maximum of 108 of the 135 chemicals that were detectable. Chemical classes that were detected at the highest frequency (with all LODs being in the trace level range) included metals, metabolites of PAHs and phthalates, phytoestrogens and PFAS. Because few participants reported being occupationally exposed to the target chemicals, the results likely reflect general exposures among this group of Danish women. The generalizability of these results is further supported by recent large biomonitoring studies in reproductive-age Danish women that report similar biomarker concentrations of PCBs, PFAS biomarkers and metals to those reported in our study (de Renzy-Martin et al., 2014; Frederiksen et al., 2014; Jensen et al., 2015; Mørck et al., 2015b).
Biomarker concentrations were not markedly different between the SF/Milieu and NHANES populations, with the exception of PBDEs, benzophenone-3, PAHs and phthalate metabolites which were higher among NHANES women. All but three PBDEs measured in NHANES were detected in at least 60% of the population, while in Denmark only PBDE153 was commonly detected. Higher PAH and phthalate levels found in the NHANES population may be attributed to stricter regulations in Denmark, including a 2010 ban on the import, sale and use of PAHs in extender oils, and restriction of the use of PAHs in a wide range of consumer products in 2014 by the European Union. In 2012 the Danish Environmental Protection Agency also proposed a ban of phthalates in consumer and personal care products, bringing the potential reproductive effects of phthalate exposure into the public eye (European Chemical Agency, 2015; The Danish Environmental Protection Agency, 2013). The United States only restricts phthalates in children's products and does not regulate PAHs in consumer products.
In addition to NHANES, several large biomonitoring programs have been conducted in European and North American countries over the last decade (Cerna et al., 2012; Den Hond et al., 2015; Fréry et al., 2012; Haines and Murray, 2012; Kolossa-Gehring et al., 2012; Mørck et al., 2015b; Perez-Gomez et al., 2013; Schoeters et al., 2012). Large-scale birth cohorts are also increasingly publishing biomonitoring results from their study populations (Guxens et al., 2012; Kawamoto et al., 2014). However, most of these studies only measure a few chemical classes or specific biomarkers simultaneously.
The Consortium to Perform Human Biomonitoring on a European Scale (COPHES) harmonized biomonitoring results of mercury, cadmium, cotinine and phthalate metabolites in mothers and children from 17 European countries. Geometric mean urinary cadmium concentration was lower in our study (0.167 μg/L) than the Danish study that contributed data to COPHES (0.219 μg/L), but higher than the full COPHES study (0.115 μg/L) (Mørck et al., 2015b; Smolders et al., 2015). Geometric mean blood cadmium and lead concentrations were slightly lower in our study population than among women participating in the BioMadrid Project and in the Canadian Health Measures Survey (CHMS) (García-esquinas et al., 2013; Haines and Murray, 2012). However, total mercury concentrations were higher in our study than in CHMS.
Non-persistent organic chemicals, such as phthalates, phenols, and parabens are synthetic chemicals used in a variety of consumer products. Participants in SF/Milieu had lower BPA concentrations (1.87 μg/L) than NHANES (2.79 μg/L), but higher concentrations than participants in the Swedish cohort contributing to COPHES (1.31 μg/L), and a separate Danish pregnancy cohort (1.17 μg/L) (de Renzy-Martin et al., 2014; K. Larsson et al., 2014). Triclosan was detected in less than 52% of our study population, which is contrary to the United States and other European studies that detect triclosan in greater than 70% of the population (Calafat et al., 2008; Frederiksen et al., 2014; de Renzy-Martin et al., 2014). Methyl paraben and propyl paraben concentrations were slightly lower in the current study than in the Danish COPHES study, and were two orders of magnitude lower compared to women in Spain and in France (Casas et al., 2011; Philippat et al., 2012). Phthalate metabolite concentrations were also lower in this study than in COPHES and Swedish women, but mono-isobutyl phthalate, monoethyl phthalate, and monobenzyl phthalate had higher concentrations than in another Danish pregnancy cohort (Den Hond et al., 2015; Frederiksen et al., 2014; S.C. Larsson et al., 2014). Phthalate metabolite concentrations in this population were also similar to a biomonitoring study of pregnant women in Peru (Irvin et al., 2010).
The major exposure pathway to pesticides is through residues commonly found on produce (Lu et al., 2006). However, ambient exposure to pesticides through air or dust may account for some variation in exposure (McKone et al., 2007). Notably, all classes of pesticides were detected at higher frequencies in NHANES than in Denmark. The wider concentration ranges among the NHANES participants than among the Danish study population may be attributed to the large geographic variability of exposure or lifestyle characteristics in the United States. State-specific policies, around flame retardants for example, modulate individual exposure to select chemicals, whereas all participants in SF/Milieu were drawn from one city, Aalborg. Pesticides may have been more frequently detected among NHANES women because of the higher presence of pesticides in food in the United States as compared to Denmark. In Denmark, overall residues above the maximum residue limit were detected in only 2.6% of produce (Petersen et al., 2013), while a recent report by the U.S. Food and Drug Administration found that 21% of imported food contained residues that exceeded the Environmental Protection Agency tolerance residues (U.S. Food and Drug Administration, 2012). OP pesticides were also lower in our study than in women in the CHMS (Haines and Murray, 2012).
Persistent organic pollutants, including PCBs, BFRs, and organochlorine insecticides are lipophilic and distribute in fatty portions of tissues and breast milk in lactating women. They have a long half-life in the body and may distribute into fetal tissue (Barr et al., 2005). Despite banned use of organochlorine pesticides, they persist in the environment and may result in human exposure through diet. Flame retardants are not normally used in textiles produced in Denmark. The principal exposure to BFRs in the Danish population is likely through imported furniture, which explains PBDE153, a primary component of the pentaBDE mixture used in flame retardants, as the only detectable PBDE in the Danish participants (Lacasse and Baumann, 2004). Concentrations in the current study were lower than Danish mothers participating in a separate, small pregnancy cohort (Vested et al., 2014). PFAS concentrations were similar to the general Danish population but lower than concentrations found in the U.S. and other European countries (Mørck et al., 2015a). The discrepancy in Danish concentrations compared to other countries may be attributed to the voluntary phase out of PFAS chemicals by the industry beginning in 2000 (Mørck et al., 2015a).
Only a few other studies have evaluated correlations among a large number of exposure biomarkers (Agay-Shay et al., 2015; Patel and Ioannidis, 2014; Robinson et al., 2015). Agay-shay et al. (2015) performed PCA on 27 endocrine disrupting compounds in the INfanciay Medio Ambiente (INMA) birth cohort in Sabadell, Spain, as an approach to examine multi-pollutant exposure in association with child weight. Similar to our study, arsenic metabolites and PBDE153 loaded separately from their chemical classes, and persistent pesticides and phthalate metabolites had high intra-class correlation, suggesting similar exposure or metabolism patterns in these two populations. In contrast to our results, they found detectable levels of many PBDEs. Robinson et al. (2015) used PCA to explore correlation patterns between 81 chemical and non-chemical exposures, such as information about the home environment, the built environment, noise and surface temperature, in the same Spanish cohort. They found that correlations within chemical classes were greater than between classes.
Like the results in Robinson et al. (2015), higher within- than between-class correlations may reflect that chemical classes derive from disparate sources. Many of the component loadings reflect shared lifestyle patterns in this study population. The highly-loaded chemical biomarkers in this study are primarily found in consumer products and as industrial byproducts. For instance, monoethyl phthalate, a breakdown product of diethyl phthalate and parabens loaded high on the same components. Both are commonly used in cosmetic products, such as hair and nail products, fragrances, make-up, and soaps, and in food packaging. Increasing levels of phthalates have been have been associated with both food and use in packaging (Mervish, 2014). PAHs and perchlorate were also found to be strongly correlated, which may be explained by the fact that they are both released by combustion processes. The correlations found between phthalates and PAH biomarkers with other chemicals classes may be attributed to their cooccurrence in indoor settings, where they have been extensively measured and detected in dust from Danish homes and internationally (Langer et al., 2010).
PFAS chemicals are primarily used as stain and grease repellants in cookware and furniture, and have been commonly detected in drinking water, with PFOS and PFOA being the most ubiquitous. Previous studies have found that PFAS are not correlated with other chemical classes, but exhibit high intra-class correlation, supporting the results of this study (Fisher et al., 2016; Gump et al., 2011; Mørck et al., 2015a). The observed high intra-class and low inter-class PFAS correlations explain Model 3, Component 2, where high exposure to one PFAS may be related to exposure to other PFAS biomarkers.
Cotinine is frequently used as a surrogate of cigarette consumption in epidemiological studies, and a positive association between levels of cadmium and smoking has been well established in both Danish populations and populations worldwide (Elinder et al., 1983; O'Connor et al., 1994; Richter et al., 2009). Here, we observed cadmium and cotinine loading on the same component, indicating that smoking status may contribute to a proportion of the variance explained by Component 2 in Models 1 and 3. In these two models, we also found that total mercury loaded with PCB congeners that are commonly found in food (138, 153, 180). In a study examining persistent chemical concentrations in the general Danish population, living in an urban area and consumption of saltwater fish were the most predictive factor of mercury in hair and PCB concentrations (Mørck et al., 2014). Saltwater fish consumption is higher in Denmark compared to other countries, which may directly explain PCBs and mercury loading on the same components in this study (Den Hond et al., 2015). The same study found that living in an urban area is also associated with higher pp′-DDE concentrations, which loaded with PCBs in both models.
We also observed that PCB 28 loaded separately from other PCB congeners. While most PCBs detected in this study population are typically found in food, PCB 28 is easily volatilized due to its low degree of chlorination and high vapor pressure. PCB 28 was primarily used in building sealants between the 1950s and 1970s, during which approximately 30% of the building stock in Denmark was constructed (Frederiksen et al., 2012; Kohler et al., 2002). We can therefore infer that PCB 28 loads separately from other PCBs due to exposure via inhalation versus ingestion from different exposure sources. Mørck et al. (2014) also found that PCB 28 displayed different exposure patterns than other PCB congeners in Danish women and children (Mørck et al., 2014). Together these findings suggest that observed correlations and factor loadings may be related to lifestyle patterns.
While most biomarkers with high detection frequencies explained enough variability in the data to load high on a component, neither urinary metals nor phytoestrogens appeared in the PCA components, despite their high detection frequencies. Low correlations between urinary metals and phytoestrogens with other chemical classes, explain their failure to load high on any of the components. These results suggest that metals and phytoestrogens are not derived from the same set of sources as biomarkers that explained the highest proportion of variation in the data. For instance, phytoestrogens are almost exclusively found the diet, specifically fruits, vegetables, soy products and cereal products. Metals are released into the environment from a diverse set of sources, including the natural geography and industry. The highly loaded chemical biomarkers in this study tend to be persistent, primarily found in consumer products, or as combustion byproducts.
A growing number of studies are using a multi-pollutant approach to relate exposures to health outcomes and refine exposure assumptions (Braun et al., 2014; Patel et al., 2010; Patel and Manrai, 2015). Several statistical and conceptual challenges exist in multi-pollutant epidemiological studies (DeBord et al., 2016). For instance, while some studies attempt to examine separate univariate associations with each predictive variable, the multitude of comparisons may result in type 1 errors. The univariate approach also assumes that each chemical acts independently, and overlooks potentially complex relationships within chemical mixtures (DeBord et al., 2016). Confounding by correlation and identifying valid confounders in multi-pollutant students can also challenge the ability to disentangle the true associations and result in erroneous conclusions.
Here, we used PCA to examine correlation patterns between 16 chemical classes. PCA is a useful method to address some of the methodological and conceptual challenges presented in mixture studies. The results of PCA summarize the data into latent constructs that explain variance in the data. If the patterns and correlations are clear enough, the outputted latent variables can be used as surrogates to the measured biomarkers. In statistical analysis, outputted component scored can be used as a method to avoid multi-pollutant confounding. PCA is also useful as a data visualization tool to understand the underlying data structure, which can be used for hypothesis generating and to highlight clusters of exposure (Pleil et al., 2011).
The results presented here can be used to identify shared exposure sources and as a means of focusing future epidemiology studies. Policymakers can also use these findings to focus regulation that addresses exposure patterns specific to this population. Further, these results add to the growing body of literature that monitor trends in environmental exposures, and can serve as an indicator of a shifting external environmental while trends change over time (Pleil et al., 2012).
4.1. Limitations
Our study has several limitations. Measurements taken in both the Denmark and NHANES populations were from single spot blood and urine samples taken at one point in time. For non-persistent chemicals, there is concern that spot urine measurements are subject to within-individual variability over time. Studies have found significant temporal variations of phthalate, phenol and organophosphate metabolites in urine samples (Bradman et al., 2007; Cox et al., 2016; Engel et al., 2014; Meeker et al., 2013). Concentrations measured in this study likely provide imprecise estimates of long-term exposure (Calafat et al., 2015). In addition, some of the discrepancy in detected concentrations between this study and levels found in other countries may be attributed to higher limits of detection in the older NHANES rounds and in some of the older studies to which we compare our results.
We performed PCA with a small sample size and a high dimension, which has potential to yield unstable estimates. Previous studies have argued that good factor recovery may still be achieved despite small numbers (de Winter et al., 2009; Preacher and Maccallum, 2002). For instance, PCA has been used in genetic studies with small sample sizes (Reich et al., 2008).
Some authors have suggested that selection bias may be of concern in prospective cohort studies that employ internet-based recruitment (Keiding and Slama, 2015). Using Danish birth registry data, Hatch et al. (2016) found that six well-known perinatal associations were similar in the Snart Gravid study, a precursor to the SF study, and the general population. For example, the risk for low birth weight among women who smoked over 10 cigarettes in pregnancy compared with none was very similar in both populations (RR=2.7 in Snart Gravid and 2.9 in all of Denmark). Similar results in both populations were also found for maternal obesity and birth weight and parity in relation to risk of preeclampsia, suggesting that selection bias may not be a concern (Hatch et al., 2016). The four women in the current study who had positive pregnancy tests in their first visit may have biased descriptive statistics and PCA results. We performed sensitivity analysis to determine if concentrations between these pregnant and non-pregnant study participants was significantly different, but found no notable difference in biomarker concentrations between the two populations.
5. Conclusions
Studying the totality of environmental exposure is complex. By reporting on a wide array of chemical classes at once and identifying common co-exposures, the present study expands our understanding of the “pregnancy exposome,” and underscores the importance of considering exposure to several chemical classes (Wang et al., 2016). We found widespread exposure to over 100 chemical biomarkers. Several chemical classes were highly correlated which may be indicative of common exposure sources, specific lifestyle factors or shared metabolic pathways (Patel and Manrai, 2015; de Renzy-Martin et al., 2014). Further studies using reported biomonitoring data and correlations can help identify shared sources and pathways for common exposures and may help elucidate the intricate chemical interactions that lead to disease pathogenesis.
Supplementary Material
Acknowledgments
We particularly thank all the cohort participants for their collaboration and Howard Cabral for biostatistics input. We would also like to thank the many investigators at the CDC for their technical assistance in analyzing blood and urine samples including Andreas Sjodin, Benjamin Blount, Christine Pfeiffer, Connie Sosnoff, Kathleen Caldwell, Lanqing Wang, Liza Valentin, Maria Morel-Espinosa, Michael Rybak, Richard Jones, Robert Jones, and Xiaoyun Ye.
Funding: Payment for the analysis of the first 50 biospecimens was supported by the US National Toxicology Program through and interagency agreement with CDC. Additional support was provided by the Oak Foundation (OUSA 09-054). The National Institute of Child Health and Human Development (R01 HD060680) supports the overall Snart Foraeldre parent study.
This work was also supported by the National Institutes of Environmental Health Sciences [T32ES014562].
Footnotes
Ethics approval: The SF/Milieu study was approved by the Danish Data Protection Board (2006-41-6864), the North Denmark Region Committee on Health Research Ethics (N-20100087) and the Institutional Review Board at Boston University. The analysis of blinded specimens by the Centers for Disease Control and Prevention (CDC) laboratory was determined not to constitute engagement in human subjects' research.
Competing financial interests: There are no competing conflicts of interest, financial or other.
Disclaimer: The findings and conclusions in this report are those of the authors and do not necessarily represent the official position of the Centers for Disease Control and Prevention.
Appendix A. Supporting information: Supplementary data associated with this article can be found in the online version at doi:10.1016/j.envres.2016.12.011.
References
- Adams SV, Newcomb PA. Cadmium blood and urine concentrations as measures of exposure: NHANES 1999-2010. J Expo Sci Environ Epidemiol. 2014;24:163–170. doi: 10.1038/jes.2013.55. http://dx.doi.org/10.1038/jes.2013.55. [DOI] [PMC free article] [PubMed] [Google Scholar]
- Agay-Shay K, Martinez D, Valvi D, Garcia-Esteban R, Basagaña X, Robinson O, Casas M, Sunyer J, Vrijheid M. Exposure to endocrine-disrupting chemicals during pregnancy and weight at 7 years of age: a multi-pollutant approach. Environ Health Perspect. 2015;123:1030–1037. doi: 10.1289/ehp.1409049. http://dx.doi.org/10.1289/ehp.1409049. [DOI] [PMC free article] [PubMed] [Google Scholar]
- Allen JG, Mcclean MD, Stapleton HM, Webster TF. Critical factors in assessing exposure to PBDEs via house dust. Environ Int. 2008;34:1085–1091. doi: 10.1016/j.envint.2008.03.006. http://dx.doi.org/10.1016/j.envint.2008.03.006. [DOI] [PubMed] [Google Scholar]
- Barr DB, Wang RY, Needham LL. Biologic monitoring of exposure to environmental chemicals throughout the life stages: requirements and issues for consideration for the national children's study. Environ Health Perspect. 2005;113:1083–1091. doi: 10.1289/ehp.7617. http://dx.doi.org/10.1289/ehp.76l7. [DOI] [PMC free article] [PubMed] [Google Scholar]
- Bradman A, Schwartz JM, Fenster L, Barr DB, Holland NT, Eskenazi B. Factors predicting organochlorine pesticide levels in pregnant Latina women living in a United States agricultural area. J Expo Sci Environ Epidemiol. 2007;17:388–399. doi: 10.1038/sj.jes.7500525. http://dx.doi.org/10.1038/sj.jes.7500525. [DOI] [PMC free article] [PubMed] [Google Scholar]
- Braun JM, Gennings C, Hauser R, Webster TF. What can epidemiological studies tell us about the impact of chemical mixtures on human health? Environ Health Perspect. 2016;124:A6–A9. doi: 10.1289/ehp.1510569. http://dx.doi.org/10.1289/ehp.1510569. [DOI] [PMC free article] [PubMed] [Google Scholar]
- Braun JM, Kalkbrenner AE, Just AC, Yolton K, Calafat AM, Sjödin A, Hauser R, Webster GM, Chen A, Lanphear BP. Gestational exposure to endocrine-disrupting chemicals and reciprocal social, repetitive, and stereotypic behaviors in 4- and 5-year-old: the HOME study. Environ Health Perspect. 2014 doi: 10.1289/ehp.1307261. http://dx.doi.org/10.1289/ehp.1307261. [DOI] [PMC free article] [PubMed]
- Burstyn I. Principal component analysis is a powerful instrument in occupational hygiene inquiries. Ann Occup Hyg. 2004;48:655–661. doi: 10.1093/annhyg/meh075. http://dx.doi.org/10.1093/annhyg/meh075. [DOI] [PubMed] [Google Scholar]
- Calafat AM, Longnecker MP, Koch HM, Swan SH, Hauser R, Goldman LR, Lanphear BP, Rudel RA, Engel SM, Teitelbaum SL, Whyatt RM, Wolff MS. Optimal exposure biomarkers for nonpersistent chemicals in environmental epidemiology. Environ Health Perspect. 2015;123:A166–A168. doi: 10.1289/ehp.1510041. http://dx.doi.org/10.1289/ehp.1510041. [DOI] [PMC free article] [PubMed] [Google Scholar]
- Calafat AM, Ye X, Wong L, Reidy JA, Needham LL. Urinary concentrations of triclosan in the U.S. population: 2003–2004. Environ Health Perspect. 2008;116:303–307. doi: 10.1289/ehp.10768. http://dx.doi.org/10.1289/ehp.10768. [DOI] [PMC free article] [PubMed] [Google Scholar]
- Casas L, Fernández MF, Llop S, Guxens M, Ballester F, Olea N, Irurzun MB, Rodríguez LSM, Riaño I, Tardón A, Vrijheid M, Calafat AM, Sunyer J. Urinary concentrations of phthalates and phenols in a population of Spanish pregnant women and children. Environ Int. 2011;37:858–866. doi: 10.1016/j.envint.2011.02.012. http://dx.doi.org/10.1016/j.envint.2011.02.012. [DOI] [PubMed] [Google Scholar]
- Centers for Disease Control and Prevention [CDC] Laboratory Procedure Manual: Cadmium, Lead, Manganese, and Selenium. 2012a. Method No: DLS 3016.8. [Google Scholar]
- Centers for Disease Control and Prevention [CDC] Laboratory Procedure Manual: Antimony, Arsenic, Barium, Beryllium, Cadmium, Cesium, Cobalt, Lead, Manganese, Molybdenum, Platinum, Strontium, Thallium, Tin, Tungsten and Uranium. Hyattsville, MD: 2012b. Method No. 3018.3 and 3018A.2. [Google Scholar]
- Centers for Disease Control and Prevention [CDC] Laboratory Procedure Manual: Urine arsenic speciation. 2011a. method no.3000.11. [Google Scholar]
- Centers for Disease Control and Prevention [CDC] Laboratory Procedure Manual: Perchlorate, Nitrate and Thiocyanate. Hyattsville, MD: 2011b. [Google Scholar]
- Centers for Disease Control and Prevention [CDC] Laboratory Procedure Manual: Phytoestrogens. Hyat; 2010. Method No.4066.04. [Google Scholar]
- Centers for Disease Control and Prevention [CDC] Laboratory Procedure Manual: Cotinine, HPLC-APCI Tandem Mass Spectrometry. Hyattsville, MD: 2008. [Google Scholar]
- Centers for Disease Control and Prevention [CDC] NHANES EnvironmentalData Tutorial – Overview of NHANES Survey Design and Weights. [accessed 5.10.16];2013 [WWW Document]. URL〈 http://www.cdc.gov/nchs/tutorials/environmental/orientation/sample_design/〉.
- Cerna M, Krskova A, Cejchanova M, Spevackova V. Human biomonitoring in the Czech Republic: an overview. Int J Hyg Environ Health. 2012;215:109–119. doi: 10.1016/j.ijheh.2011.09.007. http://dx.doi.org/10.1016/j.ijheh.2011.09.007. [DOI] [PubMed] [Google Scholar]
- Cox KJ, Porucznik CA, Anderson DJ, Brozek EM, Szczotka KM, Bailey NM, Wilkins DG, Stanford JB. Exposure classification and temporal variability in urinary bisphenol a concentrations among couples in Utah-The HOPE study. Environ Health Perspect. 2016;124:498–506. doi: 10.1289/ehp.1509752. http://dx.doi.org/10.1289/ehp.1509752. [DOI] [PMC free article] [PubMed] [Google Scholar]
- Cupul-Uicab LA, Klebanoff MA, Brock JW, Longnecker MP. Prenatal exposure to persistent organochlorines and childhood obesity in the U.S. collaborative perinatal project. Environ Health Perspect. 2013;121:1103–1109. doi: 10.1289/ehp.1205901. http://dx.doi.org/10.1289/ehp.1205901. [DOI] [PMC free article] [PubMed] [Google Scholar]
- Davis MD, Wade EL, Restrepo PR, Roman-Esteva W, Bravo R, Kuklenyik P, Calafat AM. Semi-automated solid phase extraction method for the mass spectrometric quantification of 12 specific metabolites of organophosphorus pesticides, synthetic pyrethroids, and select herbicides in human urine. J Chromatogr B. 2013;929:18–26. doi: 10.1016/j.jchromb.2013.04.005. http://dx.doi.org/10.1016/j.jchromb.2013.04.005. [DOI] [PubMed] [Google Scholar]
- de Renzy-Martin KT, Frederiksen H, Christensen JS, Kyhl HB, Andersson AM, Husby S, Barington T, Main KM, Jensen TK. Current exposure of 200 pregnant Danish women to phthalates, parabens and phenols. Reproduction. 2014;147:443–453. doi: 10.1530/REP-13-0461. http://dx.doi.org/10.1530/REP-13-0461. [DOI] [PubMed] [Google Scholar]
- de Winter JCF, Dodou D, Wieringa PA. Exploratory factor analysis with small sample sizes with small sample sizes. Multivar Behav Res. 2009;44:147–181. doi: 10.1080/00273170902794206. http://dx.doi.org/10.1080/00273170902794206. [DOI] [PubMed] [Google Scholar]
- DeBord DG, Carreon T, Lentz TJ, Middendorf PJ, Hoover MD, Schulte PA. Use of the “exposome” in the practice of epidemiology: a primer on -Omic Technologies. Am J Epidemiol. 2016;184:302–314. doi: 10.1093/aje/kwv325. http://dx.doi.org/10.1093/aje/kwv325. [DOI] [PMC free article] [PubMed] [Google Scholar]
- Den Hond E, Govarts E, Willems H, Smolders R, Casteleyn L, Kolossa-Gehring M, Schwedler G, Seiwert M, Fiddicke U, Castano A, Esteban M, Angerer J, Koch HM, Schindler BK, Sepai O, Exley K, Bloemen L, Horvat M, Knudsen LE, Joas A, Joas R, Biot P, Aerts D, Koppen G, Katsonouri A, Hadjipanayis A, Krskova A, Maly M, Morck TA, Rudnai P, Kozepesy S, Mulcahy M, Mannion R, Gutleb AC, Fischer ME, Ligocka D, Jakubowski M, Fatima Reis M, Namorado S, Gurzau AE, Lupsa IR, Halzlova K, Jajcaj M, Mazej D, Tratnik JS, Lopez A, Lopez E, Berglund M, Larsson K, Lehmann A, Crettaz P, Schoeters G. First steps toward harmonized human biomonitoring in Europe: demonstration project to perform human biomonitoring on a European scale. Environ Health Perspect. 2015;123:255–263. doi: 10.1289/ehp.1408616. http://dx.doi.org/10.1289/ehp.1408616. [DOI] [PMC free article] [PubMed] [Google Scholar]
- Elinder CG, Kjellström T, Lind B, Linnman L, Piscator M, Sundstedt K. Cadmium exposure from smoking cigarettes: variations with time and country where purchased. Environ Res. 1983;32:220–227. doi: 10.1016/0013-9351(83)90209-8. http://dx.doi.org/10.1016/0013-9351(83)90209-8. [DOI] [PubMed] [Google Scholar]
- Engel LS, Buckley JP, Yang G, Liao LM, Satagopan J, Calafat AM, Matthews CE, Cai Q, Ji BT, Cai H, Engel SM, Wolff MS, Rothman N, Zheng W, Xiang YB, Shu XO, Gao YT, Chow WH. Predictors and variability of repeat measurements of urinary phenols and parabens in a cohort of Shanghai women and men. Environ Health Perspect. 2014;122:733–740. doi: 10.1289/ehp.1306830. http://dx.doi.org/10.1289/ehp.1306830. [DOI] [PMC free article] [PubMed] [Google Scholar]
- European Chemical Agency. ANNEX XVII TO REACH – Conditions of restriction Restrictions on the manufacture, placing on the market and use of certain dangerous substances, mixtures and articles 2015 [Google Scholar]
- Fisher M, Arbuckle TE, Liang CL, LeBlanc A, Gaudreau E, Foster WG, Haines D, Davis K, Fraser WD. Concentrations of persistent organic pollutants in maternal and cord blood from the maternal-infant research on environmental chemicals (MIREC) cohort study. Environ Health. 2016;15 doi: 10.1186/s12940-016-0143-y. http://dx.doi.org/10.1186/s12940-016-0143-y. [DOI] [PMC free article] [PubMed] [Google Scholar]
- Frederiksen H, Jensen TK, Jørgensen N, Kyhl HB, Husby S, Skakkebæk NE, Main KM, Juul A, Andersson AM. Human urinary excretion of non-persistent environmental chemicals: an overview of Danish data collected between 2006 and 2012. Reproduction. 2014;147:555–565. doi: 10.1530/REP-13-0522. http://dx.doi.org/10.1530/REP-13-0522. [DOI] [PubMed] [Google Scholar]
- Frederiksen M, Meyer HW, Ebbehøj NE, Gunnarsen L. Polychlorinated biphenyls (PCBs) in indoor air originating from sealants in contaminated and uncontaminated apartments within the same housing estate. Chemosphere. 2012;89:473–479. doi: 10.1016/j.chemosphere.2012.05.103. http://dx.doi.org/10.1016/j.chemosphere.2012.05.103. [DOI] [PubMed] [Google Scholar]
- Fréry N, Vandentorren S, Etchevers A, Fillol C. Highlights of recent studies and future plans for the French human biomonitoring (HBM) programme. Int J Hyg Environ Health. 2012;215:127–132. doi: 10.1016/j.ijheh.2011.08.008. http://dx.doi.org/10.1016/j.ijheh.2011.08.008. [DOI] [PubMed] [Google Scholar]
- García-esquinas E, Pérez-gómez B, Fernández-navarro P, Fernández MA, De Paz C, Pérezmeixeira AM, Gil E, Iriso A, Sanz JC, Astray J, Cisneros M, De Santos A, Asensio Á, García-sagredo JM, García JF, Vioque J, López-abente G, Pollán M, González MJ, Martínez M. Lead, mercury and cadmium in umbilical cord blood and its association with parental epidemiological variables and birth factors. BMC Public Health. 2013;13:1–11. doi: 10.1186/1471-2458-13-841. http://dx.doi.org/10.1186/1471-2458-13-841. [DOI] [PMC free article] [PubMed] [Google Scholar]
- García-Esquinas E, Pérez-Gómez B, Fernández MA, Pérez-Meixeira AM, Gil E, de Paz C, Iriso A, Sanz JC, Astray J, Cisneros M, de Santos A, Asensio A, García-Sagredo JM, García JF, Vioque J, Pollán M, López-Abente G, González MJ, Martínez M, Bohigas PA, Pastor R, Aragonés N. Mercury, lead and cadmium in human milk in relation to diet, lifestyle habits and sociodemographic variables in Madrid (Spain) Chemosphere. 2011;85:268–276. doi: 10.1016/j.chemosphere.2011.05.029. http://dx.doi.org/10.1016/j.chemosphere.2011.05.029. [DOI] [PubMed] [Google Scholar]
- Graham JW, Olchowski AE, Gilreath TD. How many imputations are really needed? Some practical clarifications of multiple imputation theory. Prev Sci. 2007;8:206–213. doi: 10.1007/s11121-007-0070-9. http://dx.doi.org/10.1007/s11121-007-0070-9. [DOI] [PubMed] [Google Scholar]
- Gulson BL, Cameron MA, Smith AJ, Mizon KJ, Korsch MJ, Vimpani G, McMichael AJ, Pisaniello D, Jameson CW, Mahaffey KR. Blood lead-urine lead relationships in adults and children. Environ Res. 1998;78:152–160. doi: 10.1006/enrs.1997.3810. http://dx.doi.org/10.1006/enrs.1997.3810. [DOI] [PubMed] [Google Scholar]
- Gump BB, Wu Q, Dumas AK, Kannan K. Perfluorochemical (PFC) exposure in. Environ Sci Technol. 2011;45:8151–8159. doi: 10.1021/es103712g. http://dx.doi.org/10.1021/es103712g. [DOI] [PMC free article] [PubMed] [Google Scholar]
- Guxens M, Ballester F, Espada M, Fernandez MF, Grimalt JO, Ibarluzea J, Olea N, Rebagliato M, Tardon A, Torrent M, Vioque J, Vrijheid M, Sunyer J. Cohort profile: the INMA-INfancia y Medio Ambiente-(environment and childhood) Project. Int J Epidemiol. 2012;41:930–940. doi: 10.1093/ije/dyr054. http://dx.doi.org/10.1093/ije/dyr054. [DOI] [PubMed] [Google Scholar]
- Haines DA, Murray J. Human biomonitoring of environmental chemicals – Early results of the 2007-2009 Canadian Health Measures Survey for males and females. Int J Hyg Environ Health. 2012;215:133–137. doi: 10.1016/j.ijheh.2011.09.008. http://dx.doi.org/10.1016/j.ijheh.2011.09.008. [DOI] [PubMed] [Google Scholar]
- Hatch EE, Hahn KA, Wise LA, Mikkelsen EM, Kumar R, Fox MP, Brooks DR, Riis AH, Sorensen HT, Rothman KJ. Evaluation of selection bias in an internet-based study of pregnancy planners. Epidemiology. 2016;27:98–104. doi: 10.1097/EDE.0000000000000400. http://dx.doi.org/10.1097/EDE.0000000000000400. [DOI] [PMC free article] [PubMed] [Google Scholar]
- Herrick RF, Mcclean MD, Meeker JD, Zwack L, Hanley K. Physical and chemical characterization of asphalt (Bitumen) paving exposures. J Occup Environ Hyg. 2007;4:209–216. doi: 10.1080/15459620701334806. http://dx.doi.org/10.1080/15459620701334806. [DOI] [PubMed] [Google Scholar]
- Hornung RW, Reed LD. Estimation of average concentration in the presence of nondetectable values. Appl Occup Environ Hyg. 1990;5:46–51. http://dx.doi.org/10.1080/1047322X.1990.10389587. [Google Scholar]
- Huybrechts KF, Mikkelsen EM, Christensen T, Riis AH, Hatch EE, Wise LA, Sørensen HT, Rothman KJ. A successful implementation of e-epidemiology: the Danish pregnancy planning study “Snart-gravid”. Eur J Epidemiol. 2010;25:297–304. doi: 10.1007/s10654-010-9431-y. http://dx.doi.org/10.1007/s10654-010-9431-y. [DOI] [PMC free article] [PubMed] [Google Scholar]
- Irvin EA, Calafat AM, Silva MJ, Aguilar-Villalobos M, Needham LL, Hall DB, Cassidy B, Naeher LP. An estimate of phthalate exposure among pregnant women living in Trujillo, Peru. Chemosphere. 2010;80:1301–1307. doi: 10.1016/j.chemosphere.2010.06.048. http://dx.doi.org/10.1016/j.chemosphere.2010.06.048. [DOI] [PubMed] [Google Scholar]
- Jensen TK, Andersen LB, Kyhl HB, Nielsen F, Christesen HT, Grandjean P. Association between perfluorinated compound exposure and miscarriage in Danish pregnant women. PLoS One. 2015;10:1–8. doi: 10.1371/journal.pone.0123496. http://dx.doi.org/10.1371/journal.pone.0123496. [DOI] [PMC free article] [PubMed] [Google Scholar]
- Jones R, Edenfield E, Anderson S, Zhang Y, Sjodin A. Semi-automated extraction and cleanup method for measuring persisten organic pollutants in human serum. Organohalogen Compd. 2012;74:97–98. [Google Scholar]
- Kato K, Basden BJ, Needham LL, Calafat AM. Improved selectivity for the analysis of maternal serum and cord serum for polyfluoroalkyl chemicals. J Chromatogr A. 2011;1218:2133–2137. doi: 10.1016/j.chroma.2010.10.051. http://dx.doi.org/10.1016/j.chroma.2010.10.051. [DOI] [PubMed] [Google Scholar]
- Kawamoto T, Nitta H, Murata K, Toda E, Tsukamoto N, Hasegawa M, Yamagata Z, Kayama F, Kishi R, Ohya Y, Saito H, Sago H, Okuyama M, Ogata T, Yokoya S, Koresawa Y, Shibata Y, Nakayama S, Michikawa T, Takeuchi A, Satoh H. Rationale and study design of the Japan environment and children's study (JECS) BMC Public Health. 2014;14:25. doi: 10.1186/1471-2458-14-25. http://dx.doi.org/10.1186/1471-2458-14-25. [DOI] [PMC free article] [PubMed] [Google Scholar]
- Keiding N, Slama R. Commentary: time-to-pregnancy in the real world. Epidemiology. 2015;26:119–121. doi: 10.1097/EDE.0000000000000215. http://dx.doi.org/10.1097/EDE.0000000000000215. [DOI] [PubMed] [Google Scholar]
- Kohler M, Zennegg M, Waeber R. Coplanar polychlorinated biphenyls (PCB) in indoor air. Environ Sci Technol. 2002;36:4735–4740. doi: 10.1021/es025622u. http://dx.doi.org/10.1021/es025622u. [DOI] [PubMed] [Google Scholar]
- Kolossa-Gehring M, Becker K, Conrad A, Schröter-Kermani C, Schulz C, Seiwert M. Environmental surveys, specimen bank and health related environmental monitoring in Germany. Int J Hyg Environ Health. 2012;215:120–126. doi: 10.1016/j.ijheh.2011.10.013. http://dx.doi.org/10.1016/j.ijheh.2011.10.013. [DOI] [PubMed] [Google Scholar]
- Kuklenyik P, Baker SE, Bishop AM, Morales-A P, Calafat AM. On-line solid phase extraction-high performance liquid chromatography-isotope dilution-tandem mass spectrometry approach to quantify N,N-diethyl-m-toluamide and oxidative metabolites in urine. Anal Chim Acta. 2013;787:267–273. doi: 10.1016/j.aca.2013.05.055. http://dx.doi.org/10.1016/j.ygyno.2014.12.035.Pharmacologic. [DOI] [PMC free article] [PubMed] [Google Scholar]
- Lacasse K, Baumann W. Textile Chemicals: Environmental Data and Facts. 1st. Springer Science & Business Media; Berlin: 2004. [Google Scholar]
- Langer S, Weschler CJ, Fischer A, Bekö G, Toftum J, Clausen G. Phthalate and PAH concentrations in dust collected from Danish homes and daycare centers. Atmos Environ. 2010;44:2294–2301. http://dx.doi.org/10.1016/j.atmosenv.2010.04.001. [Google Scholar]
- Larsson K, Ljung Bjorklund K, Palm B, Wennberg M, Kaj L, Lindh CH, Jonsson BAG, Berglund M. Exposure determinants of phthalates, parabens, bisphenol A and triclosan in Swedish mothers and their children. Environ Int. 2014a;73:323–333. doi: 10.1016/j.envint.2014.08.014. http://dx.doi.org/10.1016/j.envint.2014.08.014. [DOI] [PMC free article] [PubMed] [Google Scholar]
- Larsson SC, Drca N, Jensen-Urstad M, Wolk A. Incidence of atrial fibrillation in relation to birth weight and preterm birth. Int J Cardiol. 2014b;178C:149–152. doi: 10.1016/j.ijcard.2014.10.138. http://dx.doi.org/10.1016/j.ijcard.2014.10.138. [DOI] [PubMed] [Google Scholar]
- Li Z, Romanoff LC, Trinidad DA, Hussain N, Jones RS, Porter EN, Patterson DG, Jr, Sjodin A. Measurement of urinary monohydroxy polycyclic aromatic hydrocarbons using automated liquid-liquid extraction and gas chromatography/isotope dilution high-resolution mass spectrometry. Anal Chem. 2006;78:5744–5751. doi: 10.1021/ac0606094. [DOI] [PubMed] [Google Scholar]
- Lu C, Toepel K, Irish R, Fenske RA, Barr DB, Bravo R. Organic diets significantly lower children's dietary exposure to organophosphorus pesticides. Environ Health Perspect. 2006;114:260–263. doi: 10.1289/ehp.8418. [DOI] [PMC free article] [PubMed] [Google Scholar]
- May X, Bennett DH, Calafat AM, Kato K, Strynar M, Andersen E, Moran RE, Tancredi DJ, Tulve NS. Serum concentrations of perfluorinated compounds (PFC) among selected populations of children and Adults in California. Environ Res. 2015;136:264–273. doi: 10.1016/j.envres.2014.09.026. http://dx.doi.org/10.1016/j.envres.2014.09.026. [DOI] [PMC free article] [PubMed] [Google Scholar]
- McKone T, Castorina R, Harnly M, Kuwabara Y, Eskenazi B, Bradman A. Merging models and biomonitoring data to characterize sources and pathways of human exposure to organophosphorous pesticides in the salinas Valley of California. Environ Sci Technol. 2007;41:3233–3240. doi: 10.1021/es0618447. http://dx.doi.org/10.1021/es0618447. [DOI] [PubMed] [Google Scholar]
- Meeker JD, Cantonwine DE, Rivera-Gonzalez LO, Ferguson KK, Mukherjee B, Calafat AM, Ye X, Anzalota Del Toro LV, Crespo N, Jimenez-Velez B, Alshawabkeh AN, Cordero JF. Distribution, variability, and predictors of urinary concentrations of phenols and parabens among pregnant women in puerto rico. Environ Sci Technol. 2013;47:3439–3447. doi: 10.1021/es400510g. http://dx.doi.org/10.1021/es400510g. [DOI] [PMC free article] [PubMed] [Google Scholar]
- Mervish N, McGovern KJ, Tetelbaum SL, Pinney SM, Windham GC, Biro FM, Lawrence HK, Silva MJ, Xiaoyun Y, Calafat AM, Wolff MS. Dietary predictors of urinary environmental biomarkers of young girls, BCERP, 2004-7. Environ Res. 2014;133:12–19. doi: 10.1016/j.envres.2014.04.040. http://dx.doi.org/10.1016/j.envres.2014.04.040. [DOI] [PMC free article] [PubMed] [Google Scholar]
- Mikkelsen EM, Hatch EE, Wise LA, Rothman KJ, Riis AH, Sorensen HT. Cohort profile: the Danish. Int J Epidemiol. 2009;38:938–943. doi: 10.1093/ije/dyn191. http://dx.doi.org/10.1093/ije/dyn191. [DOI] [PMC free article] [PubMed] [Google Scholar]
- Mikkelsen EM, Riis AH, Wise LA, Hatch EE, Rothman KJ, Cueto HT, Sørensen HT. Alcohol consumption and fecundability: a prospective Danish Cohort Study. Br Med J. 2016;354 doi: 10.1136/bmj.i4262. http://dx.doi.org/10.1136/bmj.i4262. [DOI] [PMC free article] [PubMed] [Google Scholar]
- Mørck TA, Erdmann SE, Long M, Mathiesen L, Nielsen F, Siersma VD, Bonefeld-Jørgensen EC, Knudsen LE. PCB concentrations and dioxin-like activity in blood samples from Danish school children and their mothers living in urban and rural areas. Basic Clin Pharmacol Toxicol. 2014;115:134–144. doi: 10.1111/bcpt.12214. http://dx.doi.org/10.1111/bcpt.12214. [DOI] [PubMed] [Google Scholar]
- Mørck TA, Nielsen F, Nielsen JK, Siersma VD, Grandjean P, Knudsen LE. PFAS concentrations in plasma samples from Danish school children and their mothers. Chemosphere. 2015a;129:203–209. doi: 10.1016/j.chemosphere.2014.07.018. http://dx.doi.org/10.1016/j.chemosphere.2014.07.018. [DOI] [PubMed] [Google Scholar]
- Mørck TA, Nielsen F, Nielsen JKS, Jensen JF, Hansen PW, Hansen AK, Christoffersen LN, Siersma VD, Larsen IH, Hohlmann LK, Skaanild MT, Frederiksen H, Biot P, Casteleyn L, Kolossa-Gehring M, Schwedler G, Castano A, Angerer J, Koch HM, Esteban M, Schoeters G, Den Hond E, Exley K, Sepai O, Bloemen L, Joas R, Joas A, Fiddicke U, Lopez A, Canas A, Aerts D, Knudsen LE. The Danish contribution to the European DEMOCOPHES project: a description of cadmium, cotinine and mercury levels in Danish mother-child pairs and the perspectives of supplementary sampling and measurements. Environ Res. 2015b;141:96–105. doi: 10.1016/j.envres.2014.07.028. http://dx.doi.org/10.1016/j.envres.2014.07.028. [DOI] [PubMed] [Google Scholar]
- Moreira MdeFR, Neves EB. Uso do chumbo em urina como indicador de exposição e sua relação com chumbo no sangue. Cad Saude Publica. 2008;24:2151–2159. doi: 10.1590/s0102-311x2008000900021. http://dx.doi.org/10.1590/S0102-311X2008000900021. [DOI] [PubMed] [Google Scholar]
- National Institute of Environmental Health Sciences [NIEHS] Statistical Approaches for Assessing Health Effects of Environmental Chemical Mixtures in Epidemiology Studies. ResearchTriangle Park; North Carolina: 2015a. [Google Scholar]
- National Institute of Environmental Health Sciences [NIEHS] Exposure Biology and the Exposome. [accessed 6.28.16];2015b [WWW Document]. URL 〈 http://www.niehs.nih.gov/research/supported/exposure/bio/〉.
- O'Connor TZ, Holford TR, Leaderer BP, Hammond SK, Bracken MB. Measurement of exposure to environmental tobacco smoke in pregnant women. Am J Epidemiol. 1994;142:1315–1321. doi: 10.1093/oxfordjournals.aje.a117599. [DOI] [PubMed] [Google Scholar]
- Odetokun MS, Montesano MA, Weerasekera G, Whitehead RD, Needham LL, Barr DB. Quantification of dialkylphosphate metabolites of organophosphorus insecticides in human urine using 96-well plate sample preparation and high-performance liquid chromatography-electrospray ionization-tandem mass spectrometry. J Chromatogr B: Anal Technol Biomed Life Sci. 2010;878:2567–2574. doi: 10.1016/j.jchromb.2010.04.027. http://dx.doi.org/10.1016/j.jchromb.2010.04.027. [DOI] [PubMed] [Google Scholar]
- Patel CJ, Bhattacharya J, Butte AJ. An Environment-Wide Association Study (EWAS)EWAS) on Type 2 Diabetes Mellitus. PLoS One. 2010;5:e10746. doi: 10.1371/journal.pone.0010746. http://dx.doi.org/10.1371/journal.pone.0010746. [DOI] [PMC free article] [PubMed] [Google Scholar]
- Patel CJ, Ioannidis JPA. Placing epidemiological results in the context of multiplicity and typical correlations of exposures. J Epidemiol Community Health. 2014;68:1096–1100. doi: 10.1136/jech-2014-204195. http://dx.doi.org/10.1136/jech-2014-204195. [DOI] [PMC free article] [PubMed] [Google Scholar]
- Patel CJ, Manrai AK. Development of exposome correlation globes to map out environment-wide associations. Pac Symp Biocomput. 2015;20:231–242. http://dx.doi.org/10.1142/9789814644730_0023. [PMC free article] [PubMed] [Google Scholar]
- Perez-Gomez B, Pastor-Barriuso R, Cervantes-Amat M, Esteban M, Ruiz-Moraga M, Aragones N, Pollan M, Navarro C, Calvo E, Roman J, Lopez-Abente G, Castano A. BIOAMBIENT.ES study protocol: rationale and design of a cross-sectional human biomonitoring survey in Spain. Environ Sci Pollut Res. 2013;20:1193–1202. doi: 10.1007/s11356-012-1320-3. http://dx.doi.org/10.1007/s11356-012-1320-3. [DOI] [PubMed] [Google Scholar]
- Petersen A, Jensen B, Andersen J, Poulsen ME, Christensen T, Nielsen E. Pesticide Residues: Results From the Period 2004–2011. National Food Institute, Technical University of Denmark; Soborg, Denmark: 2013. [Google Scholar]
- Philippat C, Mortamais M, Chevrier C, Petit C, Calafat AM, Ye X, Silva MJ, Brambilla C, Pin I, Charles MA, Cordier S, Slama R. Exposure to phthalates and phenols during pregnancy and offspring size at birth. Environ Health Perspect. 2012;120:464–470. doi: 10.1289/ehp.1103634. http://dx.doi.org/10.1289/ehp.1103634. [DOI] [PMC free article] [PubMed] [Google Scholar]
- Pleil JD, Sheldon L, Kormos T, Madden M, Edwards S. Categorizing biomarkers of the human exposome and developing metrics for assessing environmental sustainability. J Toxicol Environ Health Part B. 2012;15:264–280. doi: 10.1080/10937404.2012.672148. http://dx.doi.org/10.1080/10937404.2012.672148. [DOI] [PubMed] [Google Scholar]
- Pleil JD, Stiegel MA, Madden MC, Sobus JR. Heat map visualization of complex environmental and biomarker measurements. Chemosphere. 2011;84:716–723. doi: 10.1016/j.chemosphere.2011.03.017. http://dx.doi.org/10.1016/j.chemosphere.2011.03.017. [DOI] [PubMed] [Google Scholar]
- Preacher KJ, Maccallum RC. Exploratory factor analysis in behavior genetics research: factor recovery with small sample sizes. Behav Genet. 2002;32:153–161. doi: 10.1023/a:1015210025234. [DOI] [PubMed] [Google Scholar]
- Rappaport SM. Biomarkers intersect with the exposome. Biomarkers. 2012;17:483–489. doi: 10.3109/1354750X.2012.691553. http://dx.doi.org/10.1007/978-1-4614-5915-6. [DOI] [PMC free article] [PubMed] [Google Scholar]
- Reich D, Price AL, Patterson N. Principal component analysis of genetic data. Nat Genet. 2008;40:491–492. doi: 10.1038/ng0508-491. http://dx.doi.org/10.1038/ng0508-491. [DOI] [PubMed] [Google Scholar]
- Richter PA, Bishop EE, Wang J, Swahn MH. Tobacco smoke exposure and levels of urinary metals in the U.S. youth and adult population: the National Health and Nutrition Examination Survey (NHANES) 1999–2004. Int J Environ Res Public Health. 2009;6:1930–1946. doi: 10.3390/ijerph6071930. http://dx.doi.org/10.3390/ijerph6071930. [DOI] [PMC free article] [PubMed] [Google Scholar]
- Rider CV, Carlin DJ, Devito MJ, Thompson CL, Walker NJ. Mixtures research at NIEHS: an evolving program. Toxicology. 2013;313:94–102. doi: 10.1016/j.tox.2012.10.017. http://dx.doi.org/10.1016/j.tox.2012.10.017. [DOI] [PMC free article] [PubMed] [Google Scholar]
- Robinson O, Basagana X, Agier L, De Castro M, Hernandez-Ferrer C, Gonzalez JR, Grimalt JO, Nieuwenhuijsen MJ, Sunyer J, Slama R, Vrijheid M. The pregnancy exposome: multiple environmental exposures in the INMA-Sabadell Birth Cohort. Environ Sci Technol. 2015 doi: 10.1021/acs.est.5b01782. http://dx.doi.org/10.1021/acs.est.5b01782. [DOI] [PubMed]
- Robinson O, Vrijheid M. The pregnancy exposome. Curr Environ Health Rep. 2015;2:204–213. doi: 10.1007/s40572-015-0043-2. http://dx.doi.org/10.1007/s40572-015-0043-2. [DOI] [PubMed] [Google Scholar]
- Sanders AP, Claus Henn B, Wright RO. Perinatal and childhood exposure to cadmium, manganese, and metal mixtures and effects on cognition and behavior: a review of recent literature. Curr Environ Heal Rep. 2015;2:284–294. doi: 10.1007/s40572-015-0058-8. http://dx.doi.org/10.1007/s40572-015-0058-8. [DOI] [PMC free article] [PubMed] [Google Scholar]
- Schafer JL. Analysis of Incomplete Multivariate Data. Chapman and Hall; New York, NY: 1997. [Google Scholar]
- Schoeters G, Den Hond E, Colles A, Loots I, Morrens B, Keune H, Bruckers L, Nawrot T, Sioen I, DeCoster S, Van Larebeke N, Nelen V, Van de Mieroop E, Vrijens J, Croes K, Goeyens K, Baeyens W. Concept of the Flemish human biomonitoring programme. Int J Hyg Environ Health. 2012;215:102–108. doi: 10.1016/j.ijheh.2011.11.006. http://dx.doi.org/10.1016/j.ijheh.2011.11.006. [DOI] [PubMed] [Google Scholar]
- Silva MJ, Samandar E, Preau JLJ, Reidy JA, Needham LL, Calafat AM. Quantification of 22 phthalate metabolites in human urine. J Chromatogr B. 2007;860:106–112. doi: 10.1016/j.jchromb.2007.10.023. http://dx.doi.org/10.1016/j.jchromb.2007.10.023. [DOI] [PubMed] [Google Scholar]
- Smolders R, Den Hond E, Koppen G, Govarts E, Willems H, Casteleyn L, Kolossa-Gehring M, Fiddicke U, Castaño A, Koch HM, Angerer J, Esteban M, Sepai O, Exley K, Bloemen L, Horvat M, Knudsen LE, Joas A, Joas R, Biot P, Aerts D, Katsonouri A, Hadjipanayis A, Cerna M, Krskova A, Schwedler G, Seiwert M, Nielsen JKS, Rudnai P, Közepesy S, Evans DS, Ryan MP, Gutleb AC, Fischer ME, Ligocka D, Jakubowski M, Reis M, Namorado S, Lupsa IR, Gurzau AE, Halzlova K, Fabianova E, Mazej D, Tratnik JS, Gomez S, González S, Berglund M, Larsson K, Lehmann A, Crettaz P, Schoeters G. Interpreting biomarker data from the COPHES/DEMOCOPHES twin projects: using external exposure data to understand biomarker differences among countries. Environ Res. 2015;141:86–95. doi: 10.1016/j.envres.2014.08.016. http://dx.doi.org/10.1016/j.envres.2014.08.016. [DOI] [PubMed] [Google Scholar]
- Sun Z, Tao Y, Li S, Ferguson KK, Meeker JD, Park SK, Batterman SA, Mukherjee B. Statistical strategies for constructing health risk models with multiple pollutants and their interactions: possible choices and comparisons. Environ Health. 2013;12:85. doi: 10.1186/1476-069X-12-85. http://dx.doi.org/10.1186/1476-069X-12-85. [DOI] [PMC free article] [PubMed] [Google Scholar]
- The Danish Environmental Protection Agency. Phthalate Strategy: Environmental Project No 1488. Vol. 2013. Copenhagen: 2013. [Google Scholar]
- U.S. Food and Drug Administration. Pesticide Monitoring Program Fiscal Year 2012 Pesticide Report 2012 [Google Scholar]
- van Ginkel JR, Kroonenberg PM. Using generalized procrustes analysis for multiple imputation in principal component analysis. J Classif. 2014;31:242–269. http://dx.doi.org/10.1016/j.cogdev.2014.02.004. [Google Scholar]
- Vested A, Ramlau-Hansen CH, Olsen SF, Bonde JP, Stovring H, Kristensen SL, Halldorsson TI, Rantakokko P, Kiviranta H, Ernst EH, Toft G. In utero exposure to persistent organochlorine pollutants and reproductive health in the human male. Reproduction. 2014;148:635–646. doi: 10.1530/REP-13-0488. http://dx.doi.org/10.1530/REP-13-0488. [DOI] [PMC free article] [PubMed] [Google Scholar]
- Wang A, Padula A, Sirota M, Woodruff TJ. Environmental influences on reproductive health: the importance of chemical exposures. Fertil Steril. 2016 doi: 10.1016/j.fertnstert.2016.07.1076. http://dx.doi.org/10.1016/j.fertnstert.2016.07.1076. [DOI] [PMC free article] [PubMed]
- Wild CP. Complementing the genome with an “exposome”: the outstanding challenge of environmental exposure measurement in molecular epidemiology. Cancer Epidemiol Biomark Prev. 2005;14:1847–1850. doi: 10.1158/1055-9965.EPI-05-0456. http://dx.doi.org/10.1158/1055-9965.EPI-05-0456. [DOI] [PubMed] [Google Scholar]
- Wise LA, Rothman KJ, Mikkelsen EM, Sorensen HT, Riis AH, Hatch EE. An internet-based prospective study of body size and time-to-pregnancy. Hum Reprod. 2009;25:253–264. doi: 10.1093/humrep/dep360. http://dx.doi.org/10.1093/humrep/dep360. [DOI] [PMC free article] [PubMed] [Google Scholar]
- Woodruff TJ, Zota AR, Schwartz JM. Environmental chemicals in pregnant women in the United States: NHANES 2003–2004. Environ Health Perspect. 2011;878:878–885. doi: 10.1289/ehp.1002727. http://dx.doi.org/10.1289/ehp.1002727. [DOI] [PMC free article] [PubMed] [Google Scholar]
- Ye X, Kuklenyik Z, Needham LL, Calafat AM. Automated on-line column-switching HPLC-MS/MS method with peak focusing for the determination of nine environmental phenols in urine. Anal Chem. 2005;77:5407–5413. doi: 10.1021/ac050390d. http://dx.doi.org/10.1021/ac050390d. [DOI] [PubMed] [Google Scholar]
Associated Data
This section collects any data citations, data availability statements, or supplementary materials included in this article.