Abstract
Vitamin E refers to a group of saturated tocopherol (T) isomers and the biologically more active unsaturated tocotrienol (T3) isomers. PEGylated α-tocopherol, commercially known as Vitamin E TPGS, has been used as an emulsifier and therapeutic agent for children with vitamin E deficiency. Limited information, however, is available about the PEG conjugates of the tocotrienol isomers of vitamin E. The current work was therefore undertaken to synthesize and characterize the water soluble polyethylene glycol (PEG 350 and 1000) derivatives of T and T3. Yield and the identity of the synthesized products were confirmed by 1H NMR, mass spectroscopy, HPLC, and thermal analysis. The self-assembly of the PEGylated vitamin E isomers in water at critical micelle concentrations (CMC) was further confirmed by size, zeta, and Cryo-TEM image analysis. While stable at pH 7.4, PEG conjugates were found to rapidly hydrolyze at pH 1.2. Our data showed that PEGylated T3 isomers were significantly more active as inhibitors for P-glycoprotein than PEGylated T. The in vitro cytotoxicity of the conjugates was also tested against a large panel of normal and tumorigenic cells. Of the conjugates, γ-T3PGS 1000 and δ-T3PGS 1000 were found to have the least toxicity against non-tumorigenic breast and pancreatic cell lines, which may be advantageous for its use as functional excipients in drug delivery. The results from the current work have demonstrated the feasibility of synthesizing PEGylated conjugates of vitamin E isomers and highlighted the potential use of these conjugates in drug delivery as functional and safer excipients especially for γ-T3PGS 1000 and δ-T3PGS 1000 conjugate.
Keywords: Vitamin E, Vitamin E TPGS, Tocopherol, Tocotrienols, PEGylation, Characterization, Functional excipient, Anti-tumor activity
1. Introduction
Vitamin E represents a family of eight related isomers that are classified into tocopherols and tocotrienols. Each subgroup consists of an α, β, γ and δ isomer that differ in the methyl substitution on the chroman ring and the degree of conjugation in their phytyl side chain (Sylvester et al., 2010). α-Tocopherol, which was the first isomer to be identified in the 1920s was used as an antioxidant (Evans and Bishop, 1922; Evans, 1962). Due to it its poor aqueous solubility, the Eastman chemical company introduced a water soluble derivative in the 1950s by chemically conjugating α-tocopherol with poly ethylene glycol (PEG 1000) using a succinate linker, which became commercially known as “Vitamin E TPGS” or simply TPGS (Guo et al., 2013). TPGS was shown to be effective in reversing or preventing vitamin E deficiency during chronic childhood cholestasis when given orally and was therefore used in the treatment of children with vitamin E deficiency (Sokol et al., 1993). TPGS has also been used as an emulsifier and solubilizer in pharmaceutical products such as Agenerase® (Zhang et al., 2012; Highleyman, 1999) where TPGS increased the solubility of amprenavir in water from 36 μg/mL to 720 μg/mL (Yu et al., 1999). TPGS and the free α-tocopherol isomer were also used to reformulate paclitaxel into an injectable emulsion (TOCOSOL™).
While TPGS has been primarily used as an excipient, it was shown to have an anticancer activity against the MCF-7 and MDA-MB-231 breast cancer cell lines (Neophytou et al., 2014). It was postulated that TPGS can induce apoptosis by inhibiting phospho-AKT and downregulating the anti-apoptotic proteins survivin and Bcl-2 G1/S, and to induce cell cycle arrest by up-regulating P21 and P27Kip1 proteins (Neophytou et al., 2014). TPGS has also been shown to inhibit the function of the efflux-pump P-glycoprotein (P-gp), which mediates multi-drug resistance (MDR) to cancer cells by lowering intracellular drug accumulation. TPGS acts on P-gp, in part, by rigidifying lipid bilayers of cell membrane and primarily by inhibiting P-gp ATPase activity (Duhem et al., 2014).
Although extensive research has been reported on the tocopherol isomers of vitamin E including their PEG derivative (TPGS), the tocotrienol isomers (T3) of vitamin E were only discovered in the 1960s (Whittle et al., 1966; Pennock et al., 1964) and it was not until the 1990s that the anticancer activity of this class of molecules was identified (Pennock et al., 1964). Since then, numerous studies have been reported on the formulation and testing of the tocotrienol isomers against tumor cells in vitro and in animal models (Aggarwal and Nesaretnam, 2012; Sen et al., 2006). Tocotrienols display potent anti-proliferative, apoptotic and autophagic effects against breast cancer cells. The anti-cancer effect of tocotrienols were found to be associated with suppression in growth factor receptor mitogenic signaling pathway and inhibition of epithelial-to-mesenchymal transition in cancer cell lines (Ahmed et al., 2016). The ability of tocotrienols to inhibit the activation and signaling of a wide variety of membrane bound receptors was recently explained (Alawin et al., 2016). It was found that γ-tocotrienol accumulate in and disrupt the integrity of the lipid raft domain within the plasma membrane of breast cancer cells, and this disruption of lipid raft integrity was associated with a reduction in receptor activation and signaling (Ahmed et al., 2016). Based on the plethora of data on the antitumor activity of the free tocotrienol isomers of vitamin E, it was our hypothesis that substituting the α-tocopherol isomer of vitamin E in TPGS with tocotrienols would have a higher pharmacological or antitumor activity, especially against breast and pancreatic cancer, in addition to serving as a solubilizer. Therefore, the overall aim of this study was to compare and contrast between the PEGylated α-tocopherol and PEGylated tocotrienol isomers of vitamin E. More specifically, the objectives of the current study were to (1) design and synthesize PEG conjugates of four vitamin E isomers; α-tocopherol (α-T), α-tocotrienol (α-T3), γ-tocotrienol (γ-T3) and δ-tocotrienol (δ-T3), that have been isolated from Tocotrol™ L50P, a palm oil fraction that contains approximately 43% tocotrienols. Two molecular weight variants of mPEG were used to accomplish this goal; mPEG 350 and mPEG 1000; (2) characterize the PEG conjugates by HPLC, 1H NMR, mass spectroscopy, and thermal analysis; and to analyze the self-assembled micelles of the PEGylated isomers in water for particle size, zeta potential, critical micelle concentration, and by Cryo-TEM microscopy; (3) test the inhibitory effect of the PEGylated vitamin E isomers on P-glycoprotein ATPase activity; and (4) evaluate the in-vitro anticancer activity of the conjugates against the following panel of cell lines: breast cancer (MCF-7 and MDA-MB-231), pancreatic cancer (AsPC-1, BxPC-3, MIA-PaCa-2 and PANC-1), human epithelial mammary gland (hTERT-HME), human pancreatic duct (hTERT-HPNE-1), and the non-tumorigenic human mammary gland (MCF-10). To the best of our knowledge this work, along with our previous study (Abu-Fayyad et al., 2015), mark the first report on the full characterization and in-vitro cytotoxicity evaluation of PEGylated tocopherol and tocotrienol isomers of vitamin E.
2. Materials and methods
2.1. Materials
Vitamin E isomers for the current work were isolated from Tocotrol™ L50P, a viscous tocotrienol-rich fraction of palm fruit oil, that contains approximately 43% tocotrienol isomers (Fuji Health Science Inc., Burlington, NJ). Silica Gel with a 230–400 mesh size, which is suitable for flash (low pressure) chromatography, was from Natland International Corporation (Research Triangle Park, NC). 10 cm d × 60 cm L LG-0000 chromatography column with a fritted disc/PTFE stopcock was custom made by Wilmad-LabGlass Inc. (Vineland, NJ). Ethyl Acetate (EtOAc) from Pharmco-AAPER (Shelbyville, KY). Methoxy polyethylene glycols (mPEG 1000 and 350) were from INEOS Oxide (Antwerp, Belgium). Triethylamine and succinic anhydride were from Alfa Aesar (Ward Hill, MA). Toluene and Chloroform-d (CDCL3) were from Acros (Bridgewater, NJ). Hexanes, AR®, p-Toluenesulfonic acid monohydrate (p-TsOH), sodium sulfate anhydrous (Na2SO4) and sodium bicarbonate (NaHCO3) were from Avantor (Center Valley,PA). Acetonitrile and dichloromethane were from EMD Millipore (Temecula, CA). All chemicals and solvents were of reagent grade or higher and were used as supplied without further modification.
2.2. Extraction of vitamin E isomers from Tocotrol™ L50P
The individual tocopherol and tocotrienol isomers of vitamin E were extracted from Tocotrol™ L50P as follows. Approximately 500 gm of Tocotrol™ was first chromatographed on open column containing 1.5 kg silica gel. The column was flushed initially with approximately 70 L n-hexane to remove non-vitamin E lipid fractions. The column was then eluted with a gradient solvent system composed of n-hexane and an increasing concentration of ethyl acetate (0–12%). Fractions with pure hexane contained primarily α-T. Increasing the EtOAc to 1% allowed for the elution of pure α-T3. Increasing EtOAc to 2% allowed for the separation of pure γ-T3. The δ-T3 isomer appeared in fractions with >3 and up to 12% EtOAc. Thin-layer chromatography (TLC) was performed on silica gel 60 F254 pre-coated aluminum ALUGRAM® sheets (Macherey-Nagel Inc., Bethlehem, PA). After immersion in samples, sheets were sprayed with 4-anisaldehyde reagent and observed under UV light (254 and 366 nm) using UVGL-15 compact UV lamp (UVP LLC, Upland, CA). Fractions rich in α-T, α-T3, γ-T3 and δ-T3 were concentrated using a Heidolph Laborota 4000 rotary evaporator (Elk Grove Village, IL) to give yellow to orange (α-T) and orange viscous oils (α-T3, γ-T3 and δ-T3). High performance liquid chromatography (HPLC), mass spectroscopy (MS), and proton nuclear magnetic resonance (1H NMR) were performed to confirm the identity of the extracts as discussed in subsequent subsections.
2.3. Synthesis of the succinate derivatives of α-T, α-T3, γ-T3 and δ-T3
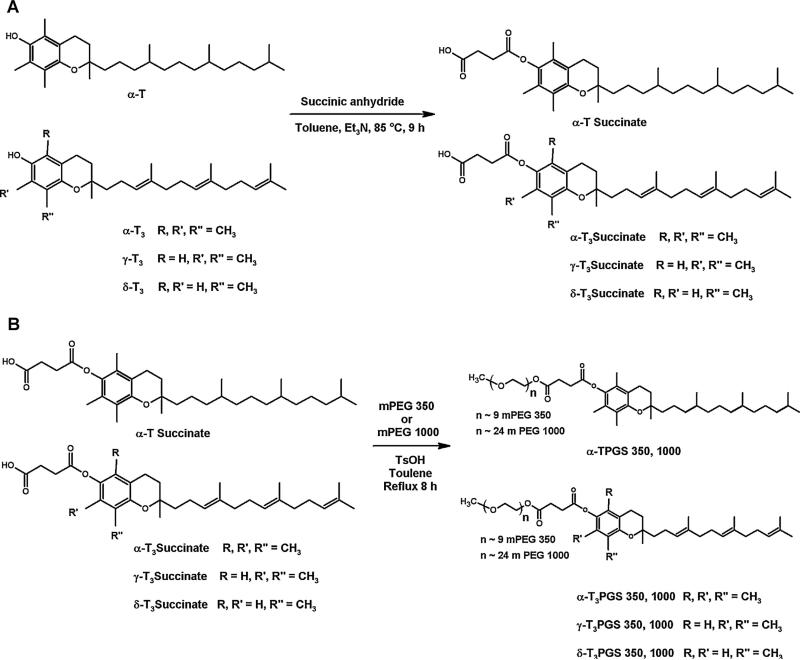
The method for the synthesis of α-T succinate, α-T3 succinate, γ-T3 succinate and δ-T3 succinate was adapted from our previous work (Abu-Fayyad et al., 2015). The general reaction scheme is outlined in Fig. 1A. The individual α-T, α-T3, γ-T3 and δ-T3 isomers (1.2 g) were first dissolved in 6 mL toluene. Equimolar amounts of succinic anhydride were then mixed with the isomer solutions. The mixtures were then stirred at 85 °C in a paraffin oil bath. The temperature was maintained using an IKA® RCT heater supported with an IKA® ETS-D4 fuzzy digital thermometer (IKA® works Inc., Wilmington, NC). The reaction was stopped after 9 h and cooled to room temperature. Water was then added and the reaction mixture was extracted with dichloromethane. The upper oily layer was kept and the lower aqueous phase was further extracted with dichloromethane. The combined oily layers were then washed three times with 1 N HCL (7 mL each) and twice with water (8 mL each). Following extraction, the collected oil layers was dried over anhydrous Na2SO4, filtered, and concentrated with a rotary evaporator. The concentrate was then mixed with Celite® 545 for further purification on column chromatography. After backing the column with a silica gel slurry (230–400 mesh size), the samples were eluted through the column with the aid of a gradient ethyl acetate/hexane solution with an increasing ethyl acetate fraction from 10% to 45%. After concentration, collected fractions afforded approximately 1 g of each succinate derivative: α-T and α-T3 (white solids) and γ-T3 and δ-T3 (yellow viscous liquids).
Fig. 1.
Synthesis scheme of the succinate derivatives (A) and the PEGylated derivatives of the vitamin E isomers (B).
2.4. Synthesis of the α-T, α-T3, γ-T3, and δ-T3 PEG conjugates
The synthesis method was modified from Lipshutz et al. (2011) and Abu-Fayyad et al. (2015) using terminally methylated PEGs with molecular weights of approximately 350 (mPEG 350) and 1000 (mPEG1000). The reaction scheme is outlined in Fig. 1B. mPEG 1000 was selected to be comparable to the commercially available TPGS. mPEG 350 was selected to observe the effect of PEG chain length on the physicochemical characteristics and in vitro cytotoxicity of the conjugates. It was reported that the length of the PEG moiety could affect the therapeutic and physicochemical properties of PEGylated conjugates (Mao et al., 2006).
An equimolar mixture of α-T succinate, α-T3 succinate, γ-T3 succinate, or δ-T3 succinate (~ 400 mg) with mPEG 1000 or mPEG 350 in toluene was refluxed for 8 h using a Dean-Stark trap (Chemglass Life Sciences Inc., Vineland, NJ). The mixture was then left to cool at room temperature. Saturated NaHCO3 was then added and the mixture was extracted with dichloromethane for two times. The combined organic layers were washed with NaHCO3 solution (7 mL) three times and brine (5 mL) for two times, then dried over anhydrous Na2SO2. The final mixture was concentrated using a rotary evaporator to afford approximately 600 mg of each PEGylated isomer (α-TPGS 350, α-TPGS 1000, α-T3PGS 350 and α-T3PGS 1000, γ-T3PGS 350, 1000 γ-T3PGS 1000 δ-T3PGS 350, and δ-T3PGS 1000) as brownish yellow solid for mPEG 1000 and semi-solid materials for mPEG 350.
2.5. 1H NMR analysis of the PEGylated α-T, α-T3, γ-T3, and δ-T3 isomers
1H NMR study was carried out to confirm the PEGylation of the isomers. Conjugates were solubilized in CDCL3 and then 0.7 mL of each solution was transferred to NMR tubes for measurement. High resolution spectra were obtained using a JEOL Eclipse NMR spectrometer and analyzed by the Delta™ NMR Data Processing Software (JEOL USA Inc., Peabody, MA). All spectra were collected at a spinning frequency of 400 MHz at 20 °C with chemical shifts reported in ppm (δ). The collection of spectra was one-dimensional with 64 scans of 16 K points over 20 ppm and a recycle delay of 5s. To confirm the stability of the conjugates, NMR tubes were re-tested after one year of storage in the refrigerator.
2.6. Mass spectroscopic analysis of the PEGylated α-T, α-T3, γ-T3, and δ-T3 isomers
Mass spectroscopic analysis of the PEGylated isomers was carried out using a JEOL AccuTOF™ time-of-flight mass spectrometer (JEOL Ltd., Tokyo, Japan). The AccuTOF analyzer performs mass measurement of compounds of high molecular weight using ion optics and an ADC-based digitizer to deliver a dynamic range exceeding 4 orders of magnitude. The mass spectrometer was equipped with orthogonal spray electrospray ionization (ESI) ion source. Before analysis, the PEGylated isomers were dissolved in HPLC grade methanol. A 50 μL sample was then injected through a Rheodyne 6-port valve injector. The mass spectrometer was operated in positive-ion mode (ESI + ve) with an applied needle voltage of 2000 V. The atmospheric pressure interface potential was set to the following values: orifice 1 = 55 V, ring lens voltage = 5 V, and orifice 2 = 6 V. The detector voltage was set to 1900 V. Orifice 1 temperature was adjusted to 80 °C with dissolving temperature at 250 °C. Nebulizing gas flow was set at 2 L/min rate whereas the desolvation gas (N2) flow was adjusted to 5 L/min rate.
2.7. HPLC analysis of the PEGylated α-T, α-T3, γ-T3, and δ-T3 isomers
The PEGylation of the isomers was further confirmed by HPLC. A SpectraSystem HPLC system fitted with a UV/Visible variable wavelength detector was used for analysis (Thermo Electron Inc., San Jose, CA). Briefly, the PEGylated conjugates (α-TPGS 350, α-TPGS 1000, α-T3PGS 350 and α-T3PGS 1000, γ-T3PGS 350, 1000 γ-T3PGS 1000 δ-T3PGS 350 and δ-T3PGS 1000) were dissolved in the mobile phase, which consisted of 90% v/v acetonitrile and 10% v/v water. 20 μL samples were then injected into Kinetex™ C18 (5 μL, 150 × 4.6 mm) analytical column, pre-heated to 40 °C (Phenomenex Inc., Torrance, CA). The flow rate of the mobile phase was adjusted to 1.5 mL/min. The PEGylated isomers were detected at 285 λmax. Data acquisition and analysis was performed using ChromQuest™ chromatography software version 4.2 (Thermo Electron Corp., San Jose, CA).
2.8. Thermal analysis of the PEGylated α-T, α-T3, γ-T3, and δ-T3 isomers
The thermal analysis of the isomers conjugated to mPEG 1000 was performed using a TA 2920 modulated differential scanning calorimeter (DSC, TA Instruments-Waters LLC, New Castle, DE). Since the mPEG 350 conjugates were semi solid at room temperature they were not subjected to thermal analysis. Accurately weighted samples (3.98 mg α-TPGS 1000, 6.60 mg α-T3PGS 1000, 3.00 mg γ-T3PGS 1000, and 4.73 mg δ-T3PGS 1000) were hermitically sealed in aluminum pans and heated from 0 °C to 80 °C at a rate of 10 °C/min. The onset and peak of the melting endotherms were measured with the aid of the universal analysis 2000 software, V 4.2 (TA Instruments-Waters LLC, New Castle, DE).
2.9. Determination of the critical micellar concentration (CMC) of the PEGylated α-T, α-T3, γ-T3, and δ-T3 isomers
The CMC of the PEGylated isomers in water was determined using pyrene as a fluorescence probe as previously reported (Abu-Fayyad et al., 2015). Before analysis, 0.05 to 0.67 mg/ml stock solutions of α-TPGS 350, α-T3PGS 350, γ-T3PGS 350 and δ-T3PGS 350, and 0.02 to 1.00 mg/ml sock solutions of α-TPGS 1000, α-T3PGS 1000, γ-T3PGS 1000 and δ-T3PGS 1000 were prepared by dissolving the conjugates in water. Before testing, 250 μL of pyrene solubilized in acetone at a concentration of 4.69 μg/ml was added to glass vials and flushed with N2 gas then dried under vacuum. A 2 mL sample of each stock solution of the PEGylated isomer was then added to the pyrene vials. The glass vials were then capped and incubated overnight at room temperature while shaking at 200 rpm. Samples from each vial were then examined by fluorescence spectroscopy using a K2 multi-frequency cross-correlation phase and modulation fluorimeter (ISS, Inc., Champaign, IL). The emission spectra of pyrene were recorded between 360 and 410 nm (Ex = 340 nm). CMC values were estimated from the plot of the fluorescence intensity of samples at 390 nm versus the logarithmic concentration of the PEGylated isomers.
2.10. Particle size and zeta potential analysis of the self-assembled PEGylated α-T, α-T3, γ-T3, and δ-T3 isomers in water
The mean particle size of PEGylated isomers in water was measured at 25 °C and a 90° laser light scattering by photon correlation spectroscopy (PCS) using a Nicomp™ 380 ZLS submicron particle size analyzer (Particle Sizing System, Port Richey, FL). Individual samples were diluted with deionized water (DI) in order to avoid multiple scattering and to achieve a scattering intensity of 300 kHz. The number-weighted mean diameter of the particles was calculated based on Stokes–Einstein law by curve fitting of the correlation function. Zeta-potential of the samples was measured by the same instrument using the zeta option.
2.11. Cryo-Transmission electron microscopy (Cryo-TEM) imaging of the self-assembled PEGylated α-T, α-T3, γ-T3, and δ-T3 isomers in water
Cryo-TEM imaging of the PEGylated isomers was carried out in order to visualize the structure of the self-assemblies in water. 3 μL sample of each PEGylated isomer dissolved in water at a concentration above CMC (> 170 μg/ml) was applied to glow-discharged 200 mesh Quantifoil R2/1 grids (Electron Microscopy Sciences, Hatfield, PA), which were previously washed with chloroform and ethanol. The grids were then blotted and plunged into liquid ethane. The frozen grids were then transferred to a Gatan 622 cryo-holder and observed in an FEI Tecnai F20 electron microscope operated at 200 kV with magnifications from 29,000 × to 80,000 × and defocus settings of 4–6 Lm (FEI Company, Hillsboro, OR). Images were collected under low-dose conditions on a Gatan Ultrascan 4000 CCD camera.
2.12. In-vitro hydrolysis study of the PEGylated α-T, αT3, γ-T3, and δ-T3 isomers
Stability against hydrolysis is critical for applications requiring the use of the PEGylated isomers in aqueous media. Since the T and T3 isomers were conjugated to the PEG moiety via an ester linkage, PEGylated products were expected to undergo hydrolysis on exposure to acidic or alkaline aqueous conditions. The stability of the conjugates was therefore tested in different buffer solutions. Briefly, the conjugates were dissolved in HCl (pH 1.2), phosphate buffer (pH 7.4) and boric acid buffer (pH 10) to a final concentration of 2 mg/ml. These pH values were intended to mimic the conditions that were used for testing the stability of the commercial vitamin E TPGS Vitamin E TPGS (2015). Samples were incubated for 20 h in an oven at 37 °C while continuously shaking at 100 RPM. At specific time points throughout the incubation period, 100 mL samples were withdrawn and diluted to 1 μL with the mobile phase and analyzed by HPLC as described earlier. The percentage of the conjugate hydrolyzed was calculated by taking the ratio of the AUC of the free isomers to the free isomer standards.
2.13. Evaluation of the P-glycoprotein (P-gp) ATPase inhibitory activity
P-gp is an ATP-dependent drug efflux pump that plays an important role in multi-drug resistance and drug bioavailability. The effect of the PEGylated vitamin E isomers on the P-gp ATPase activity was carried out by the Pgp-Glo™ assay (Promega Corporation, Madison, WI). The Pgp-Glo™ assay detects the effects of compounds on recombinant human P-gp in a cell membrane fraction. The assay relies on the ATP-dependent light-generating reaction of firefly luciferase where an increase in luminescence is indicative of the inhibitory effect of compounds on the P-gp ATPase enzyme. PEGylated vitamin E isomers at a final concentration of 10 to 100 μM in assay buffer were added to the wells of a white 96-well plate containing 20 μL (0.5 mM) verapamil, which was required to activate P-gp ATPase (Collnot et al., 2007). The reaction was initiated by adding Mg ATP (25 mM) to each well. The plate was placed on a shaker for 5 min and then incubated for 40 min at 37 °C. The reaction was stopped by adding 50 μL of the ATP detection reagent. After addition, the plate was left at room temperature for 20 min to allow for the luminescent signal to develop. Luminescence was measured using a Synergy 2 Multi-Mode BioTek plate reader (BioTek Instruments, Inc. Winooski, VT).
2.14. In vitro cytotoxicity of the PEGylated α-T, αT3, γ-T3, and δ-T3 isomers
The in vitro cytotoxicity of the PEGylated isomers was evaluated against MCF-7 and MDA-MB-231 (breast cancer) and AsPC-1, BxPC-3, MIA-PaCa-2 and PANC-1 (pancreatic cancer) cell lines. Conjugates were also tested against two immortalized cell lines; human epithelial mammary gland (hTERT-HME) and human pancreatic duct (hTERT-HPNE-1), and on non-tumorigenic human mammary gland (MCF-10) cells. Cell lines were purchased from ATCC™ (Manassas, VA). MCF-7, MDA-MB-231, MIA-PaCa-2, and PANC-1 cells were maintained in DMEM medium (Invitrogen, Carlsbad, CA). AsPC-1 and BxPC-3 cells were maintained in 1640-GlutaMAX™ RPMI medium (Life Technologies, Carlsbad, CA). TERT-HME and MCF-10A cells were maintained in MEGM™ Mammary Epithelial Cell Growth Medium (Lonza Inc., Allendale, NJ). hTERT-HPNE cells were maintained in a 75% DMEM/25% M3 Base medium (Incell Corporation LLC, San Antonio, TX) supplemented with 5% fetal bovine serum, 10 ng/ml human recombinant EGF, 5.5 mM D-glucose (1 g/L), and 750 ng/ml puromycin. All other media were supplemented with 10% fetal bovine serum, 1% insulin, and 1% penicillin–streptomycin (Invitrogen, Carlsbad, CA). For all cell lines, 5000 cells/well were seeded into 96-well plates and incubated at 37 °C with 5% CO2. After overnight incubation the culture medium was replaced with 50 μL of fresh medium containing the PEGylated isomers at concentrations ranging from 0.5 to 25 μM for breast cancer and human kidney cell lines and 0.028 to 66.7 μM for pancreatic cell lines. After 72 h of incubation the medium was replaced with 20 μL of CellTiter-Blue reagent (Promega Inc. Madison, WI). Plates were allowed to incubate at 37 °C for 1 h and the absorbance at 570 nm was measured using a BioTek Synergy HT multi-mode microplate reader (BioTek, Winooski, VT). Cell viability was calculated as the percentage of cells remaining viable in reference to the untreated cells. The 50% inhibitory concentration (IC50) values were determined by non-linear regression curve fit analysis using GraphPad Prism 5 (GraphPad Software, La Jolla, CA). Statistical significance was determined by one-way ANOVA followed by Tukey post hoc analysis. A difference of P < 0.05 was considered to be statistically significant.
3. Results and discussion
3.1. Extraction TM of vitamin E isomers from Tocotrol™ L50P
The individual vitamin E isomers were isolated in multigram quantities (25 g α-T, 20 g α-T3, 25 g γ-T3, and 15 g δ-T3). The purity of the isolated isomers was >90% as confirmed by TLC and HPLC analysis. The 1H NMR spectra of the free isomers was in agreement with the reported values in the literature.
3.2. Synthesis and characterization of the succinate ester and the PEGylated derivatives of the α-T, α-T3, γ-T3 and δ-T3 isomers
The synthesis scheme of the succinate and PEGylated derivatives of vitamin E isomers is outlined in Fig.1A and B, respectively. The succinate derivatives of vitamin E isomers were first synthesized by ring-opening reflux reaction of succinic anhydride in warm toluene and trimethylamine with the individual isomers. The resulting succinate derivatives were then put through a purification process as described in the methods section to give approximately 1.41 gm products (~98% yield). As shown in Fig. S1A–D in the Supplementary file, the ethanyl protons of succinate appeared at 2.87–2.90 ppm (m, 4H, COCH2CH2CO). The aromatic proton of γ-T3 appeared at 6.55 ppm (Fig. S1C). The two δ-T3 aromatic protons appeared at 6.55 and 6.65 ppm (Fig. S1D). Carbon chain signals of the succinate derivatives of vitamin E isomers were located at 0.85-2.2 ppm (Fig. S1A–D, Supplementary file). Reflexing the succinate derivatives with mPEG 350 and mPEG 1000 in warm toluene with p-TsOH as a catalyst gave the desired PEGylated products: 1.14 gm (~95% yield) of the mPEG 1000 conjugates and 646 mg (~95%) yield of the mPEG 350 conjugates. The purity of the PEGylated vitamin E derivatives was, on average, 96% as determined by HPLC analysis. The 1H NMR of the mPEG 350 and mPEG 1000 conjugates are shown in Figs. S2 and S3 in the Supplementary file, respectively. The appearance of the peak at 4.23 ppm for all products (m, 2H), which is attributed to the ester formation between the hydroxyl group of mPEG and carboxyl group of the succinate, confirm the PEGylation reaction. The chemical shift of the mPEG 350 [m, 24H, (CH2CH2O)6] and mPEG 1000 [m,92H, (CH2CH2O)24] ethoxyl protons were located at 3.5–3.7 ppm for all conjugates as shown in Fig. S2A–D and Fig. S3A–D, respectively. The terminal methoxy groups of the mPEG 350 and mPEG 1000 conjugates were located at 3.36 ppm (3H, OCH3) as shown in Fig. S2A–D and Fig. S3A–D, respectively. The PEGylation of the isomers was further confirmed by time-of-light mass spectroscopy. The average molecular weights of the PEGylated vitamin E isomers with mPEG 350 were observed as peaks at m/z of 874, 870, 872 and 855 for α-TPGS 350, α-T3PGS 350, γ-T3PGS 350 and δ-T3PGS 350, respectively (Fig. S4A–D, Supplementary file). The PEGylated vitamin E isomers with mPEG 1000 showed peaks at m/z of 1492, 1456, 1472 and 1458 for α-TPGS 1000, α-T3PGS 1000, γ-T3PGS 1000 and δ-T3PGS 1000, respectively (Fig. S5A–D, Supplementary file). The average molecular weights of the PEGylated isomers were in agreement with the expected values.
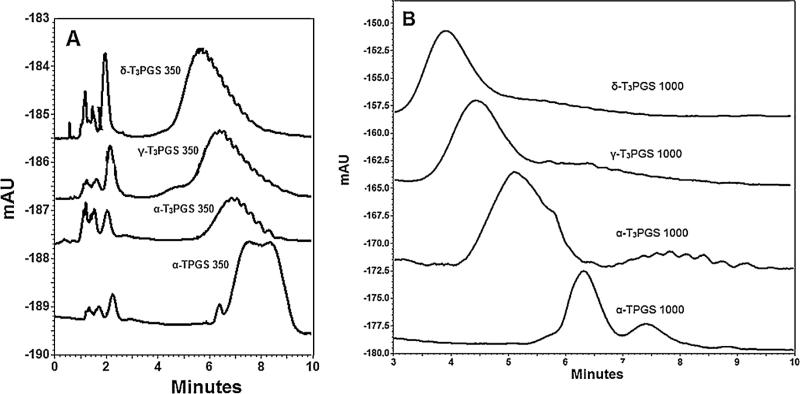
Conjugates were further analyzed by HPLC. Several HPLC methods for analysis of vitamin E TPGS were reported in literature (Kong et al., 2011). In the current work the optimum separation of the mPEG 350 and mPEG1000 conjugates were achieved when the HPLC column was preheated to 40 °C. As expected, PEGylated conjugates showed broad peaks (Fig. 2A and B) due to the broad molecular weight distribution of the ethoxy moieties of PEG chain. However, the PEGylated conjugates peaks were sufficiently separated. As shown in Fig. 2A, the mPEG 350 conjugates with their lower molecular weight were eluted at longer retention times (tR) when compared to the mPEG 1000 conjugates with larger molecular weights (Fig. 2B). Also, conjugates of the more hydrophilic vitamin E isomer (δ-T3) were separated first, followed by the γ-T3, α-T3, and then α-T conjugates.
Fig. 2.
HPLC chromatograms showing the peaks and retention times associated with PEGylated vitamin E derivatives with mPEG 350 for α-TPGS 350, α-T3PGS 350, γ-T3PGS 350 and δ-T3PGS 350 (A), and PEGylated vitamin E derivatives with mPEG 1000 for α-TPGS 1000, α-T3PGS 1000, γ-T3PGS 1000 and δ-T3PGS 1000 (B).
3.3. CMC of the PEGylated α-T, αT3, γ-T3, and δ-T3 isomers
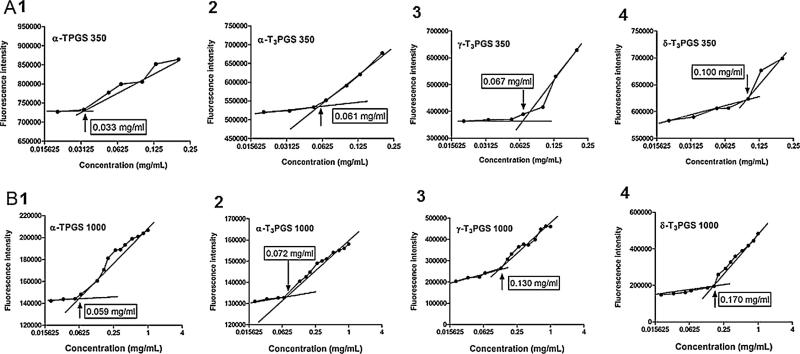
Amphiphilic molecules usually self-assemble above their CMC in dispersion media to form micelles. The micelles-forming property of the PEGylated vitamin E isomers was evaluated by measuring their CMC in water. Pyrene was used as a fluorescent probe since it incorporates into the core of micelles at concentrations above their CMC, which translates into an increase in fluorescence intensity (La et al., 1996). At low conjugate concentrations pyrene remains outside in the aqueous media with low intensity. Fig. 3A and B shows the fluorescence intensity of pyrene as a function of the concentration of the PEGylated conjugates in water. As shown in the figure, the CMCs decreased with a decrease in the hydrophobicity of the isomer. The CMC of the most hydrophobic isomer α-TPGS 350 was 0.033 mg/ml followed by 0.061, 0.067 and 0.100 mg/ml for α-T3PGS 350, γ-T3PGS 350 and δ-T3PGS 350, respectively (Fig. 3A). As shown in Fig. 3B, the CMC values were 0.059, 0.072, 0.130 and 0.170 mg for α-TPGS 1000, α-T3PGS 1000, γ-T3PGS 1000 and δ-T3PGS 1000, respectively. Isomers conjugated with mPEG 350 had lower CMC as compared to isomers conjugated to mPEG 1000. The impact of PEG chain length on CMC was in agreement with data reported for comparable products in the literature (Mukerjee and Mysels, 1972).
Fig. 3.
Critical micelle concentration (CMC) measurements of PEGylated vitamin E derivatives with mPEG 350 for α-TPGS 350, α-T3PGS 350, γ-T3PGS 350 and δ-T3PGS 350 (A), and PEGylated vitamin E derivatives with mPEG 1000 for α-TPGS 1000, α-T3PGS 1000, γ-T3PGS 1000 and δ-T3PGS 1000 (B). This study was carried out using pyrene as a hydrophobic fluorescence probe. The fluorescence intensity of pyrene was collected at the excitation wavelength of 340 nm and the emission was reported at wavelength of 390 nm. The fluorescence intensity was plotted as a function of logarithmic concentration of micelles.
The ability of the PEGylated isomers to self-assemble at low CMC is advantageous for the solubilaztion and emulsification of drugs without the dilution effect after injection in the blood circulation. The CMC of the PEGylated isomers were <170 μg/ml, which is less than the CMC of common surfactants, such as Tween 20 with a CMC around 300 μg/ml (Lo, 2003).
3.4. Physical characterization of PEGylated α-T, αT3, γ-T3, and δ-T3 isomers
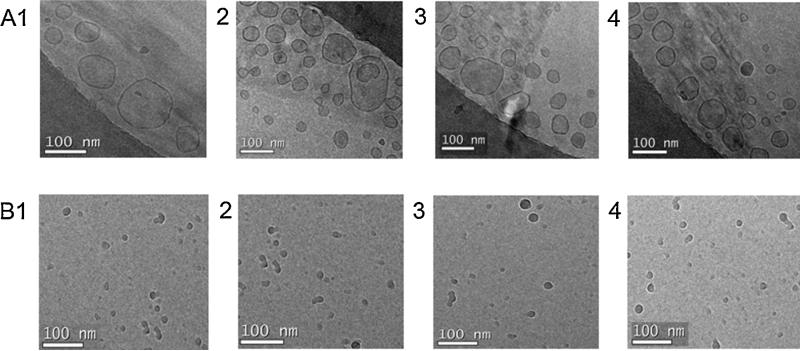
PEGylated vitamin E isomers self-assemble in aqueous media due to their intermolecular interaction to minimize surface free energy. The outermost corona of the PEGylated self-assembled structures consists of PEG moiety whereas the phytyl side chain of the vitamin E isomer form the core. As shown in Table 1, the average sizes of the PEGylated vitamin E isomers with mPEG 350 were 72.3, 68.6, 61.6 and 61.7 nm for α-T3PGS 350, γ-T3PGS 350 and δ-T3PGS 350, respectively. The size of the isomers conjugated with mPEG 1000 were 10.7, 11.2, 10.8 and 10.7 nm for α-TPGS 1000, α-T3PGS 1000, γ-T3PGS 1000 and δ-T3PGS 1000, respectively. The zeta potential of the PEGylated isomers with mPEG 350 was −22.2, − 26.5, −17.9, and −19.6 for α-T3PGS 350, γ-T3PGS 350 and δ-T3PGS 350, respectively. Isomers conjugated with mPEG 1000 had zeta potential of −15, −14.2, −11, and −13 for α-TPGS 1000, α-T3PGS 1000, γ-T3PGS 1000 and δ-T3PGS 1000, respectively. The higher surface charge of the mPEG 350 conjugates could be attributed to the lower shielding effect of the mPEG 350 moiety (Malhotra et al., 2013). Cryo-TEM imaging of the PEGylated isomers confirmed their size and shape. As shown in Fig. 4A, PEGylated isomers with mPEG 350 formed larger micelles (average size 60 nm) whereas PEGylated isomers with mPEG 1000 formed smaller particles (Fig. 4B) with an average size of 10 nm. Larger size for the short mPEG 350 conjugates was expected due the inverse relationship between the particle size and PEG molecular weight (Lipshutz et al., 2011; Fang et al., 2005).
Table 1.
Physical characteristics of PEGylated vitamin E isomers; α-TPGS 350, α-T3PGS 350, γ-T3PGS 350, δ-T3PGS 350, α-TPGS 1000, α-T3PGS 1000, γ-T3PGS 1000 and δ-T3PGS 1000 and their self-assemblies in water.
| Conjugate | Particle Size (nm)a | Zeta potential (ξ)a | CMC (mg/ml) | Melting point (°C) | HPLC tR (min)b |
|---|---|---|---|---|---|
| α-TPGS 350 | 72.3 ± 7.7 | −22.2 ± 0.9 | 0.033 | – | 8 |
| α-TPGS 1000 | 10.7 ± 2.5 | −15.0 ± 1.2 | 0.059 | 39.51 | 6.3 |
| α-T3PGS 350 | 68.6 ± 8.2 | −26.5 ± 2.2 | 0.061 | – | 7 |
| α-T3PGS 1000 | 11.2 ± 1.8 | −14.2 ± 3.2 | 0.095 | 38.48 | 5.1 |
| γ-T3PGS 350 | 61.6 ± 7.3 | −17.9 ± 0.3 | 0.067 | – | 6.4 |
| γ-T3PGS 1000 | 10.8 ± 8.3 | −11.0 ± 0.8 | 0.130 | 36.08 | 4.4 |
| δ-T3PGS 350 | 61.7 ± 9.1 | −19.6 ± 3.2 | 0.100 | – | 5.6 |
| δ-T3PGS 1000 | 10.7 ± 7.5 | −13.0 ± 1.8 | 0.170 | 42.37 | 3.7 |
Each value represents the mean ± SD for triplicate samples.
tR: Retention time.
Fig. 4.
(A) Cryo-TEM images of PEGylated vitamin E derivatives with mPEG 350 for (1) α-TPGS 350, (2) α-T3PGS 350, (3) γ-T3PGS 350 and (4) δ-T3PGS 350 (100 nm scale) and (B) PEGylated vitamin E derivatives with mPEG 1000 for (1) α-TPGS 1000, (2) α-T3PGS 1000, (3) γ-T3PGS 1000 and (4) δ-T3PGS 1000 (100 nm scale).
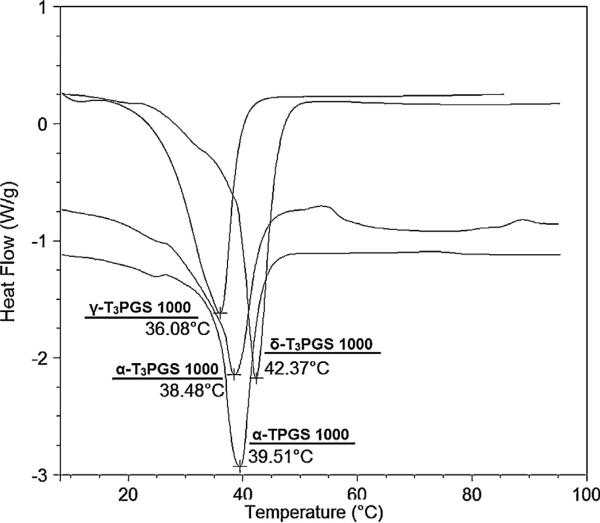
Thermal analysis of the conjugates showed that the melting points of mPEG 1000 conjugates was 39.51 °C, 38.48 °C, 36.08 °C and 42.37 °C for α-TPGS 1000, α-T3PGS 1000, γ-T3PGS 1000 and δ-T3PGS 1000 (Fig. 5), respectively. The melting points of mPEG 1000 conjugates was comparable to the reported melting point of the commercial vitamin E TPGS (41 °C) (Abu-Fayyad et al., 2015) and the melting point of mPEG 1000 (37–40 °C) (I Sciencelab.com, 2005). The mPEG 350 conjugates were liquid/semi-solid at room temperature and therefore their melting point was not measured.
Fig. 5.
DSC thermograms showing the melting endotherms of PEGylated vitamin E derivatives with mPEG 1000 for α-TPGS 1000, α-T3PGS 1000, γ-T3PGS 1000 and δ-T3PGS 1000.
3.5. In-vitro hydrolysis of the PEGylated α-T, αT3, γ-T3, and δ-T3 isomers
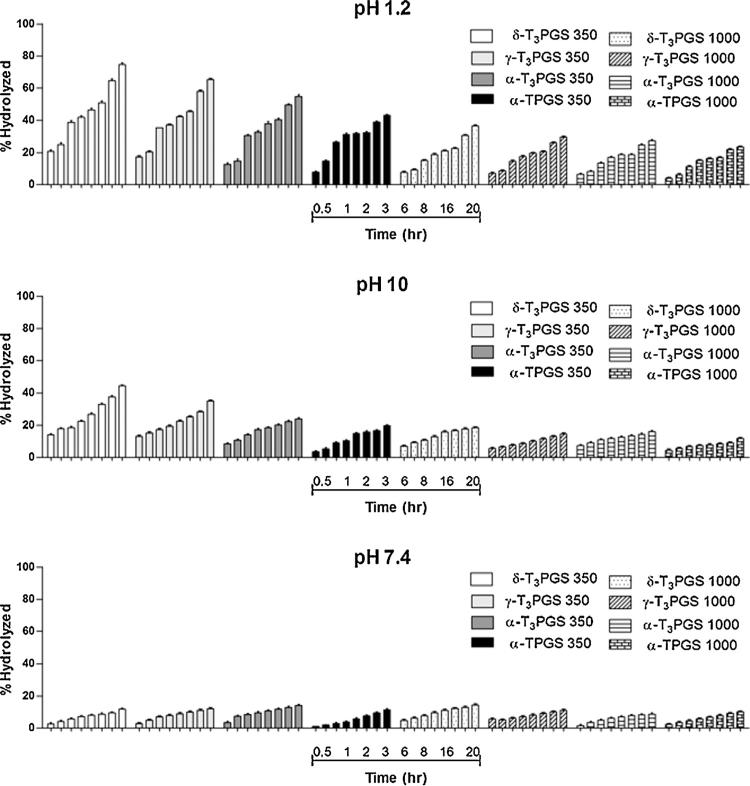
The in vitro hydrolysis study has demonstrated that the conjugates were unstable at pH 1.2 HCl (Fig. 6), Approximately 75% δ-T3PGS 350, 65% γ-T3PGS 350, 55% α-T3PGS 350 and 43% α-TPGS 350 were hydrolyzed after 20 h of incubation (Fig. 6). The larger molecular weight conjugates were less susceptible to hydrolysis at pH 1.2 with 37% δ-T3PGS 1000, 30% γ-T3PGS 1000, 28% α-T3PGS, and 24% α-T3PGS 1000 hydrolyzed after 20 h incubation (Fig. 6). The most hydrophilic δ-T3 conjugates were hydrolyzed first followed by the γ-T3, α-T3 and α-T isomers in the order of their hydrophilicity, which was in agreement with the reported observations that enhanced polarity could improve hydration for the esters (Markovic et al., 2011). Due to their smaller size, however, isomers conjugated to mPEG 1000 had a slower hydrolysis rate. It was reported that an increase in PEG molecular weight will reduce particle size and impede the hydrolysis process (Li et al., 2008).
Fig. 6.
In-vitro hydrolysis of PEGylated vitamin E isomers in HCl solution, pH 1.2 (A), pohosphate buffer, pH 7.4 (B) and boric acid buffer, pH 10 (C). Samples were analyzed by HPLC where% hydrolyzed was calculated from the AUC of the samples against the free isomer standards.
The mPEG 350 conjugates were also sensitive to hydrolysis at pH 10 (Fig. 6) with 45%, 35%, 24% and 20% of δ-T3PGS 350, γ-T3PGS 350, α-T3PGS 350 and α-TPGS 350, hydrolyzing by the end of the incubation period, respectively. The mPEG 1000 conjugates were somewhat stable at pH 10 with less than 19% hydrolysis observed after 20 h incubation (Fig. 6). All conjugates were stable at pH 7.4 with less than 15% hydrolyzed after 20 h (Fig. 6).
3.6. Evaluation of the P-glycoprotein (P-gp) ATPase inhibitory activity
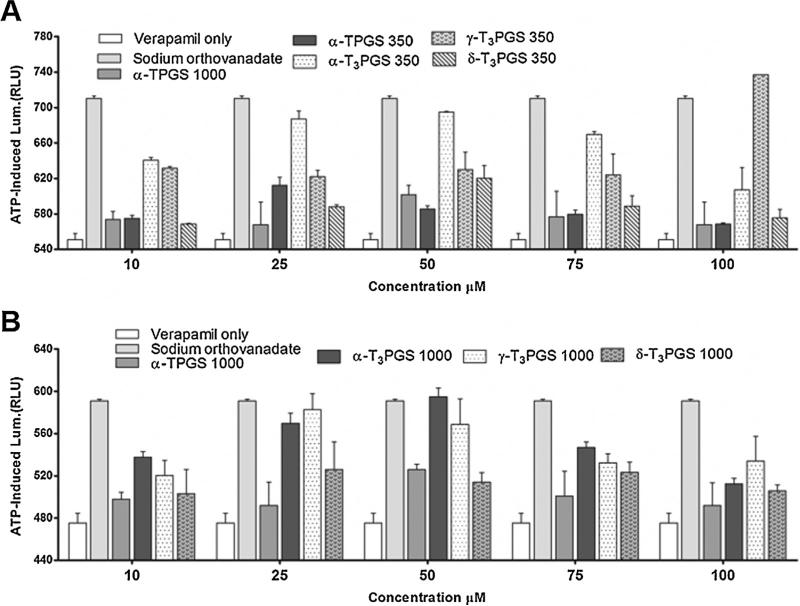
P-gp efflux pump is extensively distributed and expressed in the intestinal epithelium as well as in the renal proximal tubular cells and the epithelial cells of the blood-brain barrier. It plays an important role in conferring resistance to many chemotherapeutic agents and to reduce the oral bioavailability of drugs (Guo et al., 2013). When tested using the Pgp-Glo™ assay (Fig. 7), all PEGylated isomers were found to significantly inhibit P-gp ATPase activity (P-value < 0.05) when compared to verapamil only treated test samples (Fig. 7A and B). Verapamil was added to the test samples as an activator since it was reported that inhibitors would only exert activity on P-gp ATPase when incubated with known activators (Collnot et al., 2010).
Fig. 7.
Inhibitory effects of PEGylated vitamin E derivatives with mPEG 350 (A) and PEGylated vitamin E derivatives with mPEG 1000 (B) in comparison to sodium orthovanadate (Na3VO4) and vitamin E TPGS on verapamil-stimulated P-gp ATPase activity. Test samples contained verapamil (0.2 mM) and PEGylated vitamin E isomers (10–100 μM) or sodium orthovanadate (Na3VO4) (0.25 mM) dissolved in Pgp-Glo™ assay buffer. The reaction was initiated by the addition of MgATP. The plate was mixed for 5 min on plate shaker, then incubated for 40 min at 37 °C. ATP detection reagent was then added and luminescence was measured. Values are reported as the mean ± SD for triplicate samples.
When compared to α-TPGS 1000, PEGylated α-T3 and γ-T3, with either mPEG 350 and 1000 side chain were found to be significantly more active as inhibitors for P-gp ATPase (P value < 0.05, Fig. 7). This effect, however, was dose independent, which was also reported for vitamin E TPGS (Collnot et al., 2010). The inhibition of P-gp ATPase activity by the PEGylated vitamin E isomers may represent a promising approach to overcome chemotherapy resistance due to P-gp-overexpression. For example, it was reported that vitamin E TPGS can increase the cytotoxicity of doxorubicin, vinblastine and paclitaxel due to its P-gp inhibitory activity (Dintaman and Silverman, 1999). It is worth noting that one mechanism by which vitamin E TPGS inhibits P-gp is by rigidifying the cell membrane. A recent study found that the free unmodified γ-T3 mediates its anticancer activity through the localization and disruption of the integrity of the plasma membrane's lipid raft (Alawin et al., 2016), which indicates that PEGylated vitamin E isomers may also localize and disrupt the integrity of lipid rafts.
3.7. In vitro cytotoxicity of the PEGylated α-T, αT3, γ-T3, and δ-T3 isomers
Due to the potential of using the PEGylated isomers of vitamin E as vehicles for drug delivery, the anticancer activity of the conjugates was tested against a wide range of breast and pancreatic cell lines. Overall PEGylation was found to affect the biological activity of the isomers as follows.
3.7.1. Breast cell lines
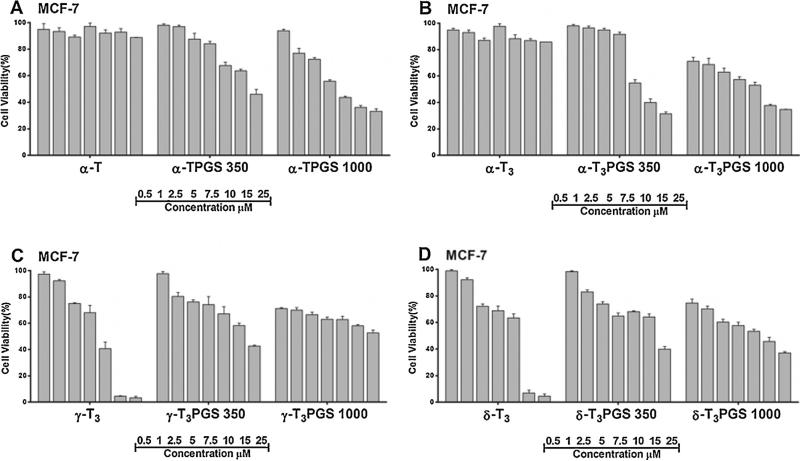
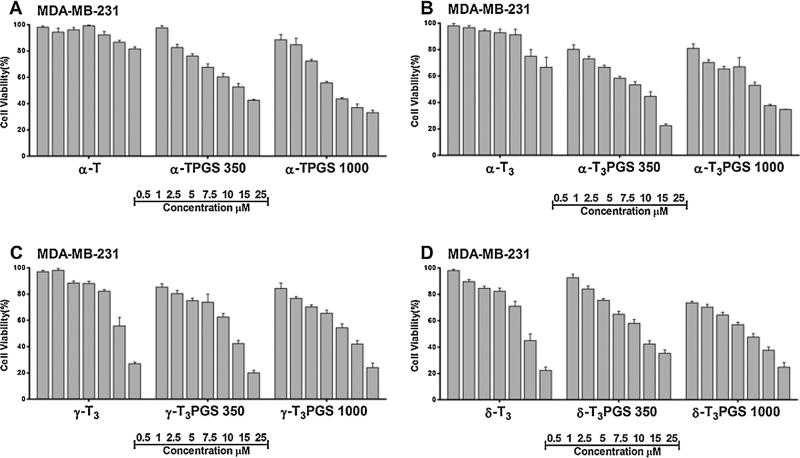
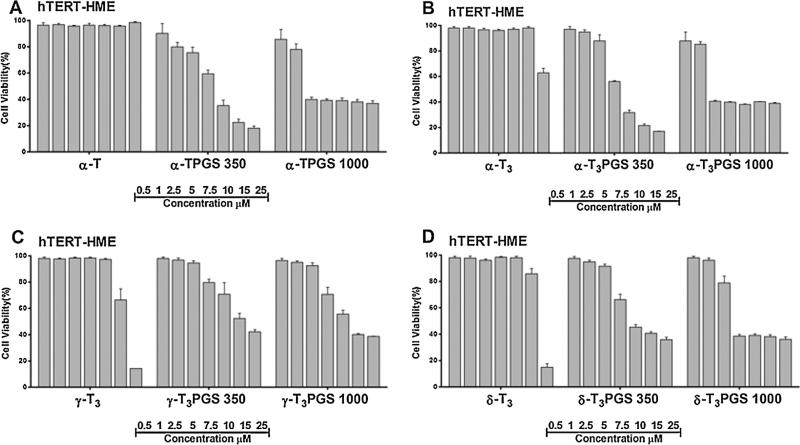
The cytotoxic activity of the conjugates was tested against MCF-7 and MDA-MB-231 breast tumor cells (Figs. 8 and 9). MCF-7 are invasive breast ductal carcinoma cells whereas MDA-MB-231 are triple negative metastatic cells from the plural effusion origin. Both cell lines were found to be sensitive to all conjugates to a different degree as deduced from their IC50 values (Table 2). Of the compounds, the mPEG 1000 conjugates of the a isomers of tocopherol and tocotrienol were found to be statistically more potent (P value < 0.005) than the other conjugates against both cell lines (Figs. 8 and 9, Table 2). It was also observed that isomers conjugated to mPEG 1000 were more potent than those conjugated to mPEG 350 (Figs. 8 and 9, Table 2). To evaluate the safety of the conjugates and to examine whether their activity is specific against tumor cells, conjugates were tested against the MCF-10A cells (Fig. S6, Supplementary file), a non-tumorigenic epithelial cell line, and hTERT-HME cells (Fig. 10), which were derived from a patient undergoing reduction mammoplasty surgery and the cells were immortalized by infection with a retrovirus. Conjugates were found to be less toxic against the MCF-10A (Fig. S6, Supplementary file, Table 2). However, when they were tested against the hTERT-HME cells, the PEG conjugates of the γ-tocotrienol and δ-tocotrienol isomers were found to be the least toxic (Fig. 10, Table 2). Conjugates of the α-tocopherol and α-tocotrienol isomers were highly toxic against the immortalized cells (Fig. 10, Fig. S6, Supplementary file, Table 2). These results indicate that the activity observed by the PEG conjugates of the α isomers might be non-specific, which may limit their potential use in drug delivery. Consequently, PEG conjugates of the γ-tocotrienol isomer, and to less extent the δ-tocotrienol, could be regarded as safer excipients for drug delivery due to their lower activity against tumor cells when compared to the free isomers (Figs. 8 and 9) and their lower cytotoxicity against the normal hTERT-HME cells when compared the PEGylated α isomers of vitamin E (Fig. 10). The IC50 value of γ-T3PGS 1000 against the non-tumorigenic breast hTERT-HME cells was 15.5 μM while the IC50 value of α-TPGS 1000 or α-T3PGS 1000 against the same cell line was less than 6.2 μM (Table 2). While the underlining molecular mechanisms by which PEGylated vitamin E isomers mediate their anti-cancer activity were not investigated in this study, it is probable that PEGylated vitamin E isomers induce G1/S cell cycle arrest and apoptosis as reported for vitamin E TPGS against breast cancer cells (Neophytou et al., 2014).
Fig. 8.
Cell viability following treatment with free unmodified and PEGylated vitamin E isomers against the MCF-7 human breast cancer cell line. Cells were treated for 72 h. Values reported are the mean ± SD for triplicate samples.
Fig. 9.
Cell viability following treatment with free unmodified and PEGylated vitamin E isomers against the MDA-MB-231 human breast cancer cell line. Cells were treated for 72 h. Values reported are the mean ± SD for triplicate samples.
Table 2.
IC50 values of PEGylated vitamin E isomers against a panel of cell lines.
| Cell line | IC50 (μM) |
|||||||
|---|---|---|---|---|---|---|---|---|
| α-TPGS 350 | α-TPGS 1000 | α-T3PGS 350 | α-T3PGS 1000 | γ-T3PGS 350 | γ-T3PGS 1000 | δ-T3PGS 350 | δ-T3PGS 1000 | |
| MCF-7 | 25.4 | 9.3 */a | 17.3/a | 9.1*/a | 19.1 | 16.1a | 18.3a | 10.0*/a |
| MDA-MB-231 | 16.1a | 9.5 */a | 9.6*/a | 10.5*/a | 12.6a | 10.7*/b | 13.0b | 8.2*/a |
| MCF-10A | 27.1**/a | 16.6a | 27.4**/a | 18.1a | 18.8a | 19.4a | 18.7b | 15.7a |
| hTERT-HME | 7.5 | 5.7 | 8.2 | 6.2 | 22.5**/a | 15.5**/b | 13.4**/a | 9.1 |
| AsPC-1 | – | 24.6* | – | 29.6 | – | 35.6** | – | 32.1 |
| BxPC-3 | – | 16.3* | – | 18.6* | – | 45.3 | – | 44.1 |
| MIA-PaCa-2 | – | 15.0* | – | 20.3 | – | 28.2 | – | 22.9 |
| PANC-1 | – | 12.3 | – | 7.9* | – | 27.3 | – | 40.2 |
| hTERT-HPNE | – | 7.9* | – | 14.0 | – | 29.5** | – | 24.0** |
Anti-tumor activity:
significantly more active than the other conjugates against the same cell line (P value < 0.05).
Toxicity per cell line:
significantly lower toxicity against the same cell line than other conjugates (P value < 0.05).
Toxicity per conjugate:
significant difference in cytotoxicity per conjugate when comparing tumorigenic to non-tumorigenic cells (P value < 0.05).
significant difference in cytotoxicity per conjugate when comparing tumorigenic to non-tumorigenic cells (P value < 0.05).
Fig. 10.
Cell viability following treatment with free unmodified and PEGylated vitamin E isomers against the non-tumorigenic hTERT-HME human breast cells. Cells were treated for 72 h. Values reported are the mean ± SD for triplicate samples.
Since the mPEG 350 conjugates were found to be less active than their mPEG 1000 counterparts, they were excluded from subsequent testing against the pancreatic cell lines. It might be worth noting that the concentration range of TPGS that has been used for paclitaxel delivery was between 0.067 and 0.67 μM (Constantinides et al., 2000), which is lower than the IC50 values observed in this study. This indicates that the conjugates may have a tolerable toxicity profile if used for drug delivery within this concentration range.
3.7.2. Pancreatic cell lines
The mPEG 1000 conjugates were tested against several pancreatic cell lines (Figs. S7–S11, Supplementary file, Table 2). AsPC-1, BxPC-3, MIA-PaCa-2, and PANC-1 cell lines have been frequently used due to their resistance to current chemotherapy (Deer et al., 2010). AsPC-1 cells were isolated from metastasized adenocarcinoma of the pancreas head. BxPC-3 cells were derived from non-metastasized adenocarcinoma of the pancreas body. MIA-PaCa-2 cells were derived from the body and tail of the pancreas. PANC-1 pancreatic cells represent a tumor of ductal origin. α-TPGS 1000 was found to be more toxic against these cell lines than the other conjugates (P < 0.05) (Fig. S7–S10, Supplementary file, Table 2). α-TPGS 1000 was also found to be significantly more toxic than the other conjugates against the immortalized pancreatic hTERT-HPNE cells (P < 0.05) (Fig. S11, Supplementary file, Table 2). On the other hand, γ-T3PGS 1000 and δ-T3PGS 1000 were found to be the least toxic conjugate against the pancreatic tumor cells and had lesser toxicity against the hTERT-HPNE cells when compared to the other conjugates (P < 0.05) (Fig. S7–S11, Supplementary file, Table 2). These results confirm what was observed against breast tumorigenic and non-tumorigenic cells, where the γ-T3PGS 1000 and δ-T3PGS 1000 were found to be the least toxic conjugates. The exact mechanism by which the conjugates exert their effect is not fully understood and is beyond the scope of the current study.
4. Conclusion
In the current study, PEGylated tocopherol (T) and tocotrienols (T3) isomers of vitamin E were synthesized and fully characterized. Succination and subsequent PEGylation were confirmed by 1H NMR, HPLC and mass spectroscopy. Due to the differences in the hydrophilicity of the isomers and the differences in the molecular weight of the PEG 350 vs 1000, conjugates were readily identified and isolated. These conjugates were water soluble and were found to assemble into submicron micelles. PEGylated isomers were also shown to have some antitumor activity against both breast and pancreatic tumor cells. mPEG 1000 conjugates were more active against breast cancer cell lines than the mPEG 350 products. Nonetheless, conjugates also exhibited toxicity against normal cells, which may limit their use in drug delivery. Of the conjugates, however, γ-T3PGS 1000 and δ-T3PGS 1000 were found to have the least toxicity against the cell lines, which may be advantageous for their use as functional excipients in drug delivery. The results from the current work have demonstrated the feasibility of synthesizing PEGylated conjugates of vitamin E isomers and highlighted the potential use of these conjugates in drug delivery as functional and safer excipients especially for γ-T3PGS 1000 and δ-T3PGS 1000 conjugates.
Supplementary Material
Acknowledgements
This work was supported by an Institutional Development Award (IDeA) from the National Institute of General Medical Sciences of the National Institutes of Health under grant number P20GM103424. Drs. Jennifer L. Carroll and Ana-Maria Dragoi from LSU Health Sciences Center-Shreveport are acknowledged for their assistance with the in-vitro cell culture studies, and Dr. Robert Cody from JEOL USA, Inc. for his assistance with mass spectrometry analysis. Acknowledgment is also extended to Dr. Terje Dokland and Ms. Cynthia Rodenburg for Cryo-TEM imaging. The EM work was carried out in the Cryo-EM core facility, Department of Microbiology, at the University of Alabama at Birmingham.
Footnotes
Appendix A. Supplementary data
Supplementary data associated with this article can be found, in the online version, at http://dx.doi.org/10.1016/j.ijpharm.2017.01.020.
References
- Abu-Fayyad A, Behery F, Sallam AA, Alqahtani S, Ebrahim H, et al. PEGylated gamma-tocotrienol isomer of vitamin E: Synthesis, characterization, in vitro cytotoxicity, and oral bioavailability. Eur. J. Pharm. Biopharm. 2015;96:185–195. doi: 10.1016/j.ejpb.2015.07.022. [DOI] [PubMed] [Google Scholar]
- Aggarwal B, Nesaretnam K. Vitamin E tocotrienols: life beyond tocopherols. Genes Nutr. 2012;7:011–0234. doi: 10.1007/s12263-011-0234-x. [DOI] [PMC free article] [PubMed] [Google Scholar]
- Ahmed RA, Alawin OA, Sylvester PW. gamma-Tocotrienol reversal of epithelial-to-mesenchymal transition in human breast cancer cells is associated with inhibition of canonical Wnt signalling. Cell Prolif. 2016;49:460–470. doi: 10.1111/cpr.12270. [DOI] [PMC free article] [PubMed] [Google Scholar]
- Alawin OA, Ahmed RA, Ibrahim BA, Briski KP, Sylvester PW. Antiproliferative effects of gamma-tocotrienol are associated with lipid raft disruption in HER2-positive human breast cancer cells. J. Nutr. Biochem. 2016;27:266–277. doi: 10.1016/j.jnutbio.2015.09.018. [DOI] [PubMed] [Google Scholar]
- Collnot EM, Baldes C, Wempe MF, Kappl R, Huttermann J, et al. Mechanism of inhibition of P-glycoprotein mediated efflux by vitamin E TPGS: influence on ATPase activity and membrane fluidity. Mol. Pharm. 2007;4:465–474. doi: 10.1021/mp060121r. [DOI] [PubMed] [Google Scholar]
- Collnot EM, Baldes C, Schaefer UF, Edgar KJ, Wempe MF, Lehr CM. Vitamin E TPGS P-glycoprotein inhibition mechanism: influence on conformational flexibility, intracellular ATP levels, and role of time and site of access. Mol. Pharm. 2010;7:642–651. doi: 10.1021/mp900191s. [DOI] [PubMed] [Google Scholar]
- Constantinides PP, Lambert KJ, Tustian AK, Schneider B, Lalji S, et al. Formulation development and antitumor activity of a filter-sterilizable emulsion of paclitaxel. Pharm. Res. 2000;17:175–182. doi: 10.1023/a:1007565230130. [DOI] [PubMed] [Google Scholar]
- Deer EL, Gonzalez-Hernandez J, Coursen JD, Shea JE, Ngatia J, et al. Phenotype and genotype of pancreatic cancer cell lines. Pancreas. 2010;39:425–435. doi: 10.1097/MPA.0b013e3181c15963. [DOI] [PMC free article] [PubMed] [Google Scholar]
- Dintaman JM, Silverman JA. Inhibition of P-glycoprotein by D-alpha-tocopheryl polyethylene glycol 1000 succinate (TPGS). Pharm. Res. 1999;16:1550–1556. doi: 10.1023/a:1015000503629. [DOI] [PubMed] [Google Scholar]
- Duhem N, Danhier F, Préat V. Vitamin E-based nanomedicines for anti-cancer drug delivery. J. Controlled Release. 2014;182:33–44. doi: 10.1016/j.jconrel.2014.03.009. [DOI] [PubMed] [Google Scholar]
- Evans HM, Bishop KS. On the existence of a hitherto unrecognized dietary factor essential for reproduction. Science. 1922;56:650–651. doi: 10.1126/science.56.1458.650. [DOI] [PubMed] [Google Scholar]
- Evans HM. The pioneer history of vitamin E*. In: IGWGFMRobert Harris S, Kenneth VT, editors. Vitamins & Hormones. Vol. 20. Academic Press; 1962. pp. 379–387. [Google Scholar]
- Fang C, Shi B, Pei YY. Effect of MePEG molecular weight and particle size on in vitro release of tumor necrosis factor-alpha-loaded nanoparticles. Acta Pharmacol. Sin. 2005;26:242–249. doi: 10.1111/j.1745-7254.2005.00537.x. [DOI] [PubMed] [Google Scholar]
- Guo Y, Luo J, Tan S, Otieno BO, Zhang Z. The applications of Vitamin E TPGS in drug delivery. Eur. J. Pharm. Sci. 2013;49:175–186. doi: 10.1016/j.ejps.2013.02.006. [DOI] [PubMed] [Google Scholar]
- Highleyman L. Amprenavir (Agenerase) receives FDA approval. Food Drug Adm. BETA. 1999 Apr;12(2):3. [PubMed] [Google Scholar]
- I Sciencelab.com Material Safety Data Sheet Polyethylene Glycol 1000 MSDS. 2005.
- Kong LY, Su BG, Bao ZB, Xing HB, Yang YW, Ren QL. Direct quantification of mono- and di-D-alpha-tocopherol polyethylene glycol 1000 succinate by high performance liquid chromatography. J. Chromatogr. A. 2011;2:8664–8671. doi: 10.1016/j.chroma.2011.10.020. [DOI] [PubMed] [Google Scholar]
- La SB, Okano T, Kataoka K. Preparation and characterization of the micelle-forming polymeric drug indomethacin-incorporated poly(ethylene oxide)-poly (beta-benzyl L-aspartate) block copolymer micelles. J. Pharm. Sci. 1996;85:85–90. doi: 10.1021/js950204r. [DOI] [PubMed] [Google Scholar]
- Li J, Jiang G, Ding F. The effect of pH on the polymer degradation and drug release from PLGA-mPEG microparticles. J. Appl. Polym. Sci. 2008;109:475–482. [Google Scholar]
- Lipshutz BH, Ghorai S, Abela AR, Moser R, Nishikata T, et al. TPGS-750-M: a second-Generation amphiphile for metal-Catalyzed cross-Couplings in water at room temperature. The Journal of Organic Chemistry. 2011;76:4379–4391. doi: 10.1021/jo101974u. [DOI] [PMC free article] [PubMed] [Google Scholar]
- Lo YL. Relationships between the hydrophilic-lipophilic balance values of pharmaceutical excipients and their multidrug resistance modulating effect in Caco-2 cells and rat intestines. J. Control. Release. 2003;90:37–48. doi: 10.1016/s0168-3659(03)00163-9. [DOI] [PubMed] [Google Scholar]
- Malhotra M, Tomaro-Duchesneau C, Saha S, Kahouli I, Prakash S. Development and characterization of chitosan-PEG-TAT nanoparticles for the intracellular delivery of siRNA. Int. J. Nanomed. 2013;8:2041–2052. doi: 10.2147/IJN.S43683. [DOI] [PMC free article] [PubMed] [Google Scholar]
- Mao S, Neu M, Germershaus O, Merkel O, Sitterberg J, et al. Influence of polyethylene glycol chain length on the physicochemical and biological properties of poly(ethylene imine)-graft-poly(ethylene glycol) block copolymer/SiRNA polyplexes. Bioconjug. Chem. 2006;17:1209–1218. doi: 10.1021/bc060129j. [DOI] [PubMed] [Google Scholar]
- Markovic BD, Dobricic VD, Vladimirov SM, Cudina OA, Savic VM, Karljikovic-Rajic KD. Investigation of solvolysis kinetics of new synthesized fluocinolone acetonide C-21 esters–an in vitro model for prodrug activation. Molecules. 2011;16:2658–2671. doi: 10.3390/molecules16032658. [DOI] [PMC free article] [PubMed] [Google Scholar]
- Mukerjee P, Mysels KJ. Critical Micelle Concentrations of Aqueous Surfactant Systems. (Prepared under contract for the Office of Standard Reference Data, National Bureau of Standards of NSRDS-NBS 36, Washington, DC 20234, 1971 v + 227 pp. 20.5 × 27 cm. Price $3.75. Journal of Pharmaceutical Sciences. 1972;61:319. [Google Scholar]
- Neophytou CM, Constantinou C, Papageorgis P, Constantinou AI. d-alpha-tocopheryl polyethylene glycol succinate (TPGS) induces cell cycle arrest and apoptosis selectively in Survivin-overexpressing breast cancer cells. Biochem. Pharmacol. 2014;89:31–42. doi: 10.1016/j.bcp.2014.02.003. [DOI] [PubMed] [Google Scholar]
- Pennock JF, Hemming FW, Kerr JD. A reassessment of tocopherol in chemistry. Biochem. Biophys. Res. Commun. 1964;17:542–548. doi: 10.1016/0006-291x(64)90062-2. [DOI] [PubMed] [Google Scholar]
- Sen CK, Khanna S, Roy S. Tocotrienols: Vitamin E beyond tocopherols. Life Sci. 2006;78:2088–2098. doi: 10.1016/j.lfs.2005.12.001. [DOI] [PMC free article] [PubMed] [Google Scholar]
- Sokol RJ, Butler-Simon N, Conner C, Heubi JE, Sinatra FR, et al. Multicenter trial of d-alpha-tocopheryl polyethylene glycol 1000 succinate for treatment of vitamin E deficiency in children with chronic cholestasis. Gastroenterology. 1993;104:1727–1735. doi: 10.1016/0016-5085(93)90652-s. [DOI] [PubMed] [Google Scholar]
- Sylvester PW, Kaddoumi A, Nazzal S, El Sayed KA. The value of tocotrienols in the prevention and treatment of cancer. J. Am. Coll. Nutr. 2010;29:324S–333S. doi: 10.1080/07315724.2010.10719847. [DOI] [PubMed] [Google Scholar]
- Vitamin E TPGS Vitamin E TPGS NF and Food Grade. 2015 https://isochem.eu/sites/default/files/documents/ISOCHEM%20TPGS%202015%2008.pdf.
- Whittle KJ, Dunphy PJ, Pennock JF. The isolation and properties of delta-tocotrienol from Hevea latex. Biochem. J. 1966;100:138–145. doi: 10.1042/bj1000138. [DOI] [PMC free article] [PubMed] [Google Scholar]
- Yu L, Bridgers A, Polli J, Vickers A, Long S, et al. Vitamin E-TPGS increases absorption flux of an HIV protease inhibitor by enhancing its solubility and permeability1. Pharm. Res. 1999;16:1812–1817. doi: 10.1023/a:1018939006780. [DOI] [PubMed] [Google Scholar]
- Zhang Z, Tan S, Feng SS. Vitamin E TPGS as a molecular biomaterial for drug delivery. Biomaterials. 2012;33:4889–4906. doi: 10.1016/j.biomaterials.2012.03.046. [DOI] [PubMed] [Google Scholar]
Associated Data
This section collects any data citations, data availability statements, or supplementary materials included in this article.


