

Abstract
The importance of neoantigens for cancer immunity is now well‐acknowledged. However, there are diverse strategies for predicting and prioritizing candidate neoantigens, and thus reported neoantigen loads vary a great deal. To clarify this issue, we compared the numbers of neoantigen candidates predicted by four currently utilized strategies. Whole‐exome sequencing and RNA sequencing (RNA‐Seq) of four non‐small‐cell lung cancer patients was carried out. We identified 361 somatic missense mutations from which 224 candidate neoantigens were predicted using MHC class I binding affinity prediction software (strategy I). Of these, 207 exceeded the set threshold of gene expression (fragments per kilobase of transcript per million fragments mapped ≥1), resulting in 124 candidate neoantigens (strategy II). To verify mutant mRNA expression, sequencing of amplicons from tumor cDNA including each mutation was undertaken; 204 of the 207 mutations were successfully sequenced, yielding 121 mutant mRNA sequences, resulting in 75 candidate neoantigens (strategy III). Sequence information was extracted from RNA‐Seq to confirm the presence of mutated mRNA. Variant allele frequencies ≥0.04 in RNA‐Seq were found for 117 of the 207 mutations and regarded as expressed in the tumor, and finally, 72 candidate neoantigens were predicted (strategy IV). Without additional amplicon sequencing of cDNA, strategy IV was comparable to strategy III. We therefore propose strategy IV as a practical and appropriate strategy to predict candidate neoantigens fully utilizing currently available information. It is of note that different neoantigen loads were deduced from the same tumors depending on the strategies applied.
Keywords: Lung cancer, neoantigen, next‐generation sequencing, RNA‐Seq, whole‐exome sequencing
Somatic mutations accumulate in cancer cells during cancer progression. Recent studies reported that T cells recognize antigens derived from tumor‐specific mutated genes, so‐called neoantigens, and mediate immune responses against tumor cells.1, 2, 3, 4, 5, 6, 7, 8, 9, 10, 11 The widespread use of next‐generation sequencing (NGS) in the clinic now makes possible the identification of neoantigen candidates as potential biomarkers or therapeutic targets for the individual patient. However, reliable practical methods to identify neoantigens are not well‐established; thus, the numbers of neoantigen candidates detected in tumors and the accuracy of predicting their immunogenicity vary a great deal depending on the strategies used. Most commonly, detection of somatic mutations by high‐throughput NGS combined with computational algorithms for MHC–peptide binding affinity prediction is used to identify candidate neoantigens.1, 2, 3, 4, 5, 6, 7, 8, 9, 10, 11, 12 Although confirmation of actual antigenicity eliciting antitumor responses by cytotoxic T cells requires biological assays, an important role of in silico prediction of neoantigen candidates is to narrow down and prioritize those with the highest probability of inducing tumor‐specific T‐cell responses, prior to undertaking labor‐ and cost‐intensive, and time‐consuming, biological assays.
Currently, a standard strategy to identify neoantigen candidates is based on analysis of whole‐exome sequencing (WES) data comparing tumor and normal tissue.1 In addition, gene expression analysis by RNA sequencing (RNA‐Seq) or microarray has been used to predict candidate neoantigens derived from the somatic mutations detected by WES (Fig. 1).7, 8, 13 However, it must be noted that the expression analysis by RNA‐Seq or microarray does not necessarily imply the presence of mutated mRNA actually in the cancer cells. This is because gene expression levels are determined irrespective of the position of the mutations. In addition, the tumor consists of both normal and cancer cells, and the latter may well also contain both mutated and wild‐type sequences, one on each chromosome. Therefore, strictly speaking, target fragments containing each mutation should be amplified from tumor cDNA and sequenced to verify the presence of mutated mRNA sequences within the cancer cells themselves. Inspecting RNA‐Seq data more closely reveals that they encompass both the expression level of gene products as well as the read counts of sequences with or without each mutation. The read counts of mutated sequences identified by RNA‐Seq could be used for the verification of mutant mRNA expression.
Figure 1.
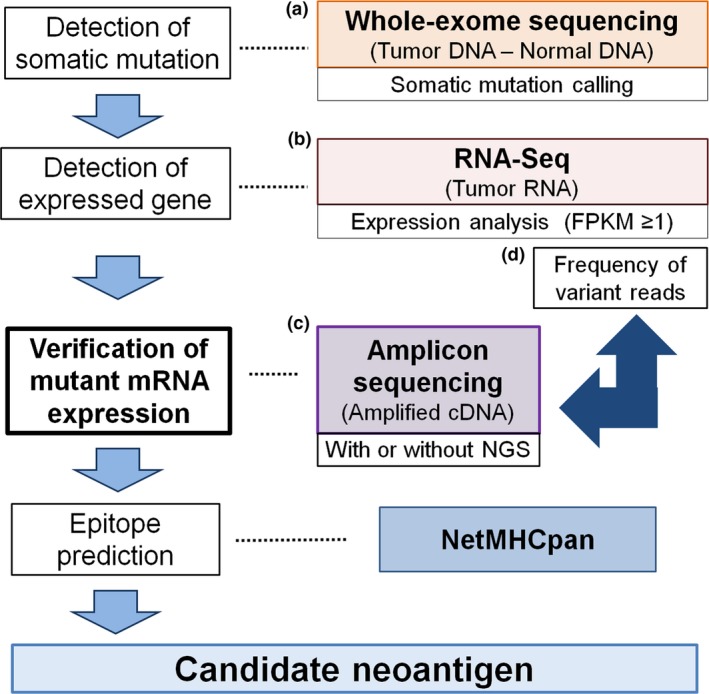
In silico prediction of candidate neoantigens. Tumor‐specific mutations were called from whole‐exome sequencing data (a). Of these, somatic missense mutations were considered as expressed in the tumor on the basis of fragments per kilobase of transcript per million fragments mapped (FPKM) ≥1 by RNA sequencing (RNA‐Seq) (b). The actual expression of mutant mRNAs was confirmed using amplicon sequencing (amplicon‐seq) with Sanger sequencing or next‐generation sequencing (NGS) (c). Frequency of variant reads from RNA‐Seq of the tumor can be used for the determination of mutant mRNA in the tumor (d). List of missense mutations obtained together with individual patient HLA data analyzed by computational algorithms predicting MHC–peptide binding affinity, such as NetMHCpan, to screen for candidate neoantigens.
In the present study, we compared different strategies for predicting and prioritizing candidate neoantigens starting from the same list of identified mutations and patient HLA alleles based on WES. Candidate neoantigens were defined: (strategy I) solely on the basis of missense mutations detected by WES; (strategy II) WES and fragments per kilobase of transcript per million fragments mapped (FPKM) ≥1 of RNA‐Seq taken together; (strategy III) WES, FPKM ≥1 of RNA‐Seq, and detection of mutated sequences by amplicon sequencing of tumor cDNA in addition; and (strategy IV) WES combined with FPKM ≥1 and variant allele frequency (VAF) ≥0.04 of RNA‐Seq. We found that numbers of neoantigen candidates differed substantially depending on which strategy was used and that integration of both expression data and sequence data from RNA‐Seq with WES enabled us to predict and prioritize candidate neoantigens efficiently and appropriately.
Materials and Methods
Patients
Four patients with non‐small‐cell lung cancer who underwent lung resection were included in the study. Two patients had adenocarcinoma and two had squamous cell carcinoma. Median age was 67 years (range, 41–78 years). All four patients were men and had a current‐ or former‐smoker history. Median cigarette consumption was 50 pack‐years (range, 21–71 pack‐years). None of the patients had received any preoperative treatment. The clinical characteristics of the patients are shown in Table 1. The study was approved by the Human Genome, Gene Analysis Research Ethics Committee of the Faculty of Medicine and Graduate School of Medicine of the University of Tokyo, and the University of Tokyo Hospital (G3545) (Tokyo, Japan).
Table 1.
Characteristics of four patients with non‐small‐cell lung carcinoma who participated in this study
| Patient | Age, years | Sex | Pack‐years | Histology | P stage |
|---|---|---|---|---|---|
| LK029 | 78 | M | 60 | SQ | T1bN0M0‐IA |
| LK047 | 41 | M | 21 | AD | T1bN2M0‐IIIA |
| LK070 | 67 | M | 71 | SQ | T3N0M0‐IIB |
| LK073 | 67 | M | 40 | AD | T2aN0M0‐IB |
AD, adenocarcinoma; M, male; SQ, squamous cell carcinoma.
Whole‐exome sequencing and RNA‐Seq
Tumor and adjacent normal lung tissue samples were obtained immediately after lung resection and stored in RNAlater RNA Stabilization Reagent (Qiagen, Hilden, Germany). DNA and RNA samples were prepared using either AllPrep DNA/RNA Mini Kit or AllPrep DNA/RNA/miRNA Universal Kits (Qiagen) according to the manufacturer's instructions. Genomic DNA was converted to DNA libraries for DNA sequencing using the SureSelect XT Kit (Agilent Technologies, Santa Clara, CA, USA). The SureSelect Human All Exon V5 kit (Agilent Technologies) was used to specify targeted regions for hybridization‐based enrichment. Poly‐A‐selected RNA libraries were prepared using the SureSelect Strand‐Specific RNA Library Preparation Kit for Illumina (Agilent Technologies). The sequencing libraries of DNA and RNA were sequenced at 100‐bp paired‐end mode on a HiSeq 1500 (Illumina, San Diego, CA, USA). Exome sequencing reads were mapped on the human genome sequence (GRCh37) using Burrows‐Wheeler Aligner software (version 0.7.12).14 Picard (version 2.1.1) was used to remove duplicate reads. The Genome Analysis Tool kit (version 3.5) was used for realignment of reads around indels.15 Average of total mapped reads in WES was 59.5 M for the tumor samples and 57.7 M for normal samples. Putative somatic variants in tumor DNA were called against DNA taken from normal lung tissue using VarScan2 (version 2.3.7) and/or MuTect (version 1.1.7).16, 17 Default parameters were used for variant calling except for –tumor‐purity 0.1 (somatic) and –min‐tumor‐freq 0.015 (processSomatic) in VarScan2. RNA sequencing reads were aligned using TopHat (version 1.3.2).18 Average sequenced reads and total mapped reads in RNA‐Seq were 76.0 M and 62.6 M, respectively. Expression values were calculated as FPKM using Cufflinks (version 2.0.2).19 The RNA read count at each mutation site was obtained by bam‐readcount (https://github.com/genome/bam-readcount).
Sanger sequencing of amplified tumor cDNA (amplicon‐seq [Sanger])
Tumor RNA samples were reverse‐transcribed with ReverTra Ace qPCR RT Master Mix with gDNA Remover (Toyobo, Osaka, Japan) according to the manufacturer's instructions. Primer3Plus (http://primer3plus.com/) was used to design the primer pairs to amplify the region ranging from 200 to 600 bp in size containing each mutation (Table S1). All primers were synthesized by Sigma‐Aldrich Japan (Tokyo, Japan). TaKaRa Ex Taq Hot Start Version (TaKaRa Bio, Kusatsu, Japan) was used for PCR amplification according to the manufacturer's protocol. The following steps were carried out using a TaKaRa PCR Thermal Cycler Dice (TaKaRa Bio): 94°C for 3 min, 40 cycles of 94°C for 30 s, and 60°C for 30 s and 72°C for 1 min, followed by incubation at 72°C for 3 min. The PCR products were electrophoresed and amplicons of the expected size excised from NuSieve GTG agarose gels (Lonza, Basel, Switzerland), and then purified using High Pure PCR Product Purification Kits (Roche, Basel, Switzerland). Amplicons were Sanger sequenced with the primer used for PCR amplification (FASMAC, Atsugi, Japan).
High‐throughput amplicon sequencing of tumor cDNA (amplicon‐seq [NGS])
Primer pairs were designed to amplify the 200‐ to 300‐bp fragment containing each mutation using Primer3Plus (Table S1). M13FW (5′‐TGTAAAACGACGGCC‐3′) and M13RV (5′‐ GGAAACAGCTATGAC‐3′) were added at the 5′‐end of each forward and reverse primer, respectively. First PCR amplification was carried out in a final volume of 50 μL, with 25 μL of 2× Multiplex PCR Buffer (Mg2+, dNTP plus) (Multiplex PCR Assay Kit version 2; TaKaRa Bio), 0.25 μL Multiplex PCR Enzyme Mix, 0.05 μM each gene‐specific primer pool, and 1 μg template cDNA. The following steps were carried out: 94°C for 1 min, 14 cycles of 94°C for 30 s, and 60°C for 1 min, followed by incubation at 72°C for 10 min. The resultant PCR products were twice purified with AMPureXP beads (Beckman Coulter, Inc. Brea, CA, USA). Secondary PCR amplification was undertaken in a final volume of 50 μL, with 25 μL of 2× Multiplex PCR Buffer, 0.25 μL Multiplex PCR Enzyme Mix, 10 μM each Index primer, and 10 ng purified first‐PCR product. The following steps were carried out: 94°C for 1 min, five cycles of 94°C for 30 s, 55°C for 10 s and 72°C for 30 s, followed by incubation at 72°C for 10 min. After the purified second‐PCR product was quantified, typically equal molarities of PCR product were mixed, applied to MiSeq (Illumina) at 150‐bp paired‐end mode using the MiSeq Reagent kit version 3 600 cycles (Illumina) according to the manufacturer's instructions. Sequencing reads were mapped on each mRNA sequence using the Burrows–Wheeler Aligner.14 Read counts at each mutation site were obtained by bam‐readcount.
Selection of candidate neoantigens by peptide–MHC class I binding prediction algorithms
The MHC class I binding affinity of each peptide to the patients’ individual HLA‐A, ‐B, or ‐C alleles was estimated as previously described.20 In brief, four‐digit‐typed HLA class I alleles of each patient were identified from WES data of their normal lung tissue using Omixon Target HLA Typing (http://www.omixon.com).21 The Immune Epitope Database analysis resource NetMHCpan (version 2.8) was used to predict MHC class I binding of 8–11 mer mutant peptides to the patients’ HLA‐A, ‐B, and ‐C alleles.22, 23 Peptides with an IC50 value ≤500 nM were considered high binders. Tumor‐specific variant proteins containing mutant peptide sequences with an IC50 value ≤500 nM were regarded as candidate neoantigens.
Statistical analysis
Variant allele frequency was calculated by VAF = (ALT‐read count) / depth. All statistical analyses were carried out using R 3.3.0 (http://www.r-project.org).
Results
Detection of somatic mutations by WES
Whole‐exome sequencing was carried out on four pairs of lung cancer and normal tissues; the results were compared to exclude differences due to SNPs and to identify tumor‐specific somatic mutations in each patient. We focused on missense mutations for the detection of neoantigens in this study. Total numbers of missense mutations in these four patients as detected by MuTect and VarScan were 344 and 233, respectively (Table S2). The number of missense mutations called by both detectors was 216, while the sum of those called by either program alone was 361. Detailed information on all detected somatic missense mutations is shown in Table S3.
Mutated gene expression in tumor
Of all tumor‐specific genetic alterations, only the expression of mutated gene products in the tumor itself should be considered for the prediction of neoantigens. To this end, transcriptome sequencing (RNA‐Seq) of lung cancer tissue was undertaken. The gene products were regarded as “expressed in the tumor” when their corresponding FPKM was ≥1. Of the total 361 genes with missense mutations detected by either or both MuTect or VarScan, 207 could be regarded as expressed in the tumor (Fig. 2). Detailed information about these 207 mutations is shown in Table S4.
Figure 2.
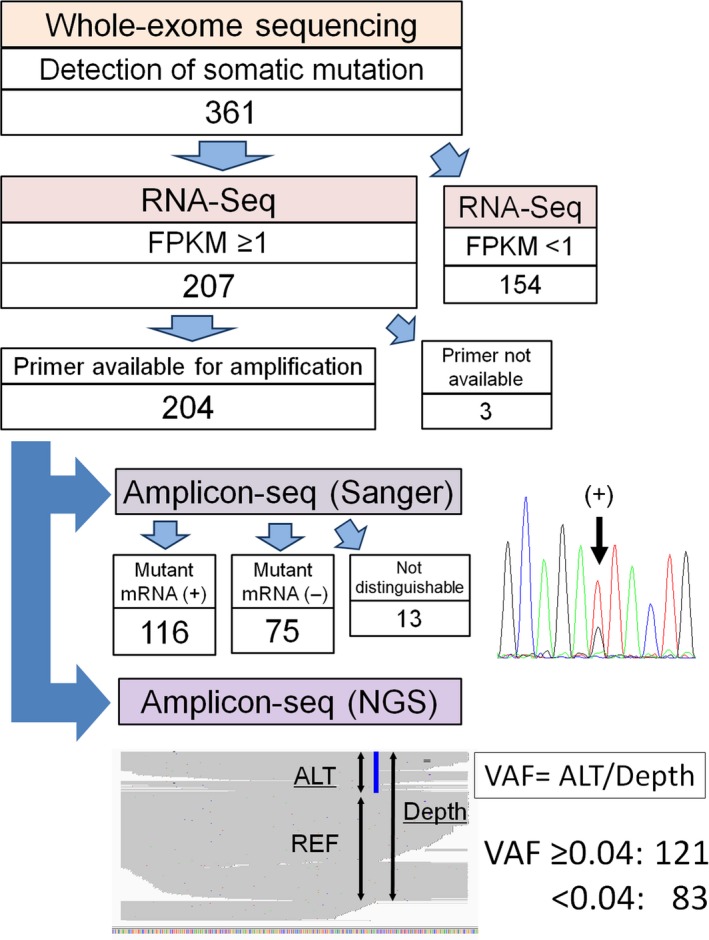
Evaluation of tumor‐specific mutant transcripts. Three hundred and sixty‐one mutations detected by whole‐exome sequencing in four patients with non‐small‐cell lung cancer, of which 207 somatic mutations had a fragments per kilobase of transcript per million fragments mapped (FPKM) ≥1. Of these 207 candidates for expressed mutant mRNA, 204 were confirmed by amplicon sequencing (amplicon‐seq); 3 were excluded because primers for cDNA amplification could not be designed. Each amplified cDNA region was sequenced by both Sanger sequencing and next‐generation sequencing (NGS). ALT, alternative read; REF, reference read; VAF, variant allele frequency.
Detection of mutated gene sequences in tumor RNA by amplicon‐seq of tumor cDNA
To verify the expression of mutant mRNA, fragments containing each mutated nucleotide were amplified from tumor cDNA (Fig. 2). Of the 207 candidates for expressed mutant genes, optimal primer pairs could be generated for all but three. These 204 PCR products corresponding to each missense mutation were subjected to amplicon‐seq using Sanger sequencing. Of these, 13 samples were not evaluable due to the poor resolution of Sanger sequencing, and among the remaining 191, 116 (60.7%) mutations could be confirmed.
High‐throughput amplicon‐seq was also carried out for these 204 PCR products using NGS. Median depth per amplicon was 2732 (range, 0–325 174) (Table S4). In NGS, sequences with and without mutations are simultaneously detected; VAF can be calculated at each mutation position (Fig. 2). Variant allele frequency obtained by amplicon‐seq using NGS and the results by amplicon‐seq using Sanger sequencing were compared (Fig. 3). Although most samples not showing mutations by amplicon‐seq (Sanger) did have a low VAF by amplicon‐seq (NGS) (Fig. 3a), it is critical to determine the appropriate VAF cut‐off value for determining bona fide mutations by amplicon‐seq (NGS). Therefore, a receiver operating characteristic (ROC) curve was drawn to obtain the optimal cut‐off value for VAF by amplicon‐seq (NGS) for detecting mutations determined by amplicon‐seq (Sanger) (Fig. 3b). Sequencing results for the 191 genes that were evaluated by amplicon‐seq (Sanger) were subjected to ROC curve analysis. The area under the ROC curve was 0.985, and the cut‐off value of VAF in amplicon‐seq (NGS) was set at 0.039 with a Youden index of 0.926 (sensitivity, 0.966; specificity, 0.96). Thus, we defined VAF ≥0.04 as a criterion for identifying bona fide mutations by amplicon‐seq (NGS). Using this criterion, we re‐evaluated the amplicon‐seq (NGS) data for the 204 PCR products. Of these, 121 had a VAF ≥0.04; we thus concluded that they were positive for mutant mRNA sequences (Fig. 2). It is of note that NGS could evaluate several gene products that could not be analyzed by Sanger sequencing due to poor resolution.
Figure 3.
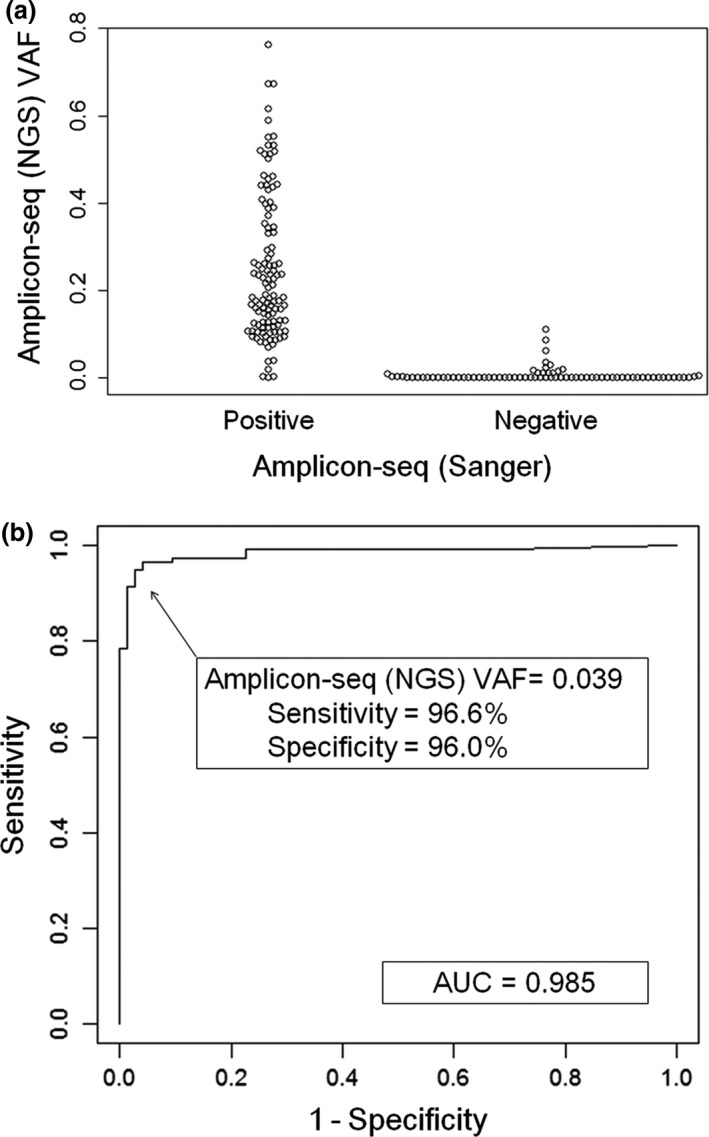
Sequencing of amplified tumor cDNA (amplicon‐seq) by Sanger sequencing as well as next‐generation sequencing (NGS) to determine the presence of mutation sequences in the tumor RNA. (a) Variant allele frequencies (VAF) at each mutation site obtained by amplicon‐seq (NGS) were categorized as positive or negative by amplicon‐seq (Sanger) and shown in a beeswarm plot. (b) A receiver operator characteristic curve was drawn to determine the cut‐off value of the VAF obtained by amplicon‐seq (NGS) for the detection of mutant mRNA expression. The results of Sanger sequencing for detection of mutant mRNA expression were accurately paralleled by NGS when the cut‐off value of VAF was set at ≥0.039 (sensitivity, 0.966; specificity, 0.96). AUC, area under the curve.
RNA‐Seq of tumor delivers information on nucleotide sequences in addition to the level of expression in tumor
As discussed above, it is valuable to amplify fragments that contain missense mutations from tumor cDNA and carry out amplicon sequencing for confirmation of the presence of mutated mRNA in the tumor. However, it would be faster and more cost‐effective if we could avoid having to prepare amplicons and just use RNA‐Seq data of whole tumor RNA for evaluating the presence of mutant mRNA sequences.
Accordingly, we investigated whether the VAF of each mutation derived from the RNA‐Seq raw data or the mapped data could be used for evaluation of mutant mRNA expression. As shown in Table 2, we determined the predictive values for mutant mRNA detection at various different cut‐offs for VAFs of RNA‐Seq data. Here, positive and negative mutant mRNA expression was compared with amplicon‐seq (NGS) data, 121 positive and 83 negative for mutations. When the cut‐off for RNA‐Seq VAF was set at the same value as for the amplicon‐seq (NGS) VAF (i.e., VAF = 0.04), a total of 115 mutant mRNAs was determined, of which 106 were also detected by amplicon‐seq (NGS), indicating 9 false positives. While 89 mutations were regarded as not expressed in the tumor, 74 were also not detected by amplicon‐seq (NGS); the remaining 15 were detected by amplicon‐seq (NGS) but missed by RNA‐Seq (false negatives). Thus, when the cut‐off value was set at VAF = 0.04, positive and negative predictive values were 92.2% (106 of 115) and 83.1% (74 of 89), respectively. When the RNA‐Seq VAF cut‐off was set at 0.02, the positive predictive value decreased to 90.7% while the negative predictive value increased to 83.7%. When RNA‐Seq VAF cut‐offs were set at 0.06, 0.08, and 0.10, the positive predictive values increased to 92.9%, 94.0%, and 94.7%, respectively, and the negative predictive values decreased to 82.4%, 74.0% and 70.9%, respectively. A cut‐off value of VAF ≥0.04 for RNA‐Seq data yielded acceptably high positive and negative predictive values for mutant mRNA expression; therefore, for further analysis, we chose this value as the cut‐off for determining the presence of mutated mRNA in tumor.
Table 2.
Predictive values for mutant mRNA detection using different variant allele frequency (VAF) cut‐offs in RNA sequencing (RNA‐Seq) data
| RNA‐Seq VAF cut‐off | Expression of mutant mRNA: validated by amplicon‐seq (NGS) VAF ≥0.04 | Total (n = 204) | Predictive value, % | |
|---|---|---|---|---|
| Positive (n = 121) | Negative (n = 83) | |||
| ≥0.02 | ||||
| Positive | 107 | 11 | 118 | 90.7 |
| Negative | 14 | 72 | 86 | 83.7 |
| ≥0.04 | ||||
| Positive | 106 | 9 | 115 | 92.2 |
| Negative | 15 | 74 | 89 | 83.1 |
| ≥0.06 | ||||
| Positive | 105 | 8 | 113 | 92.9 |
| Negative | 16 | 75 | 91 | 82.4 |
| ≥0.08 | ||||
| Positive | 94 | 6 | 100 | 94.0 |
| Negative | 27 | 77 | 104 | 74.0 |
| ≥0.10 | ||||
| Positive | 89 | 5 | 94 | 94.7 |
| Negative | 32 | 78 | 110 | 70.9 |
Amplicon‐seq, amplicon sequencing; NGS, next‐generation sequencing.
If RNA‐Seq could be undertaken at the same depth as amplicon‐seq using NGS, theoretically the results should be identical. Even under the current conditions, the VAFs of mutations identified by RNA‐Seq versus amplicon‐seq (NGS) were significantly correlated (Pearson's R = 0.72, P < 0.0001; Fig. S1). These results support the utilization of RNA‐Seq data without the necessity for generating another set of amplicon‐seq data for detecting mutated mRNA in tumors. In the cases investigated here, 117 of 207 mutant mRNAs were regarded as expressed in the tumor (Fig. 4a); of these, 106 were validated by amplicon‐seq using NGS (Fig. 4b).
Figure 4.
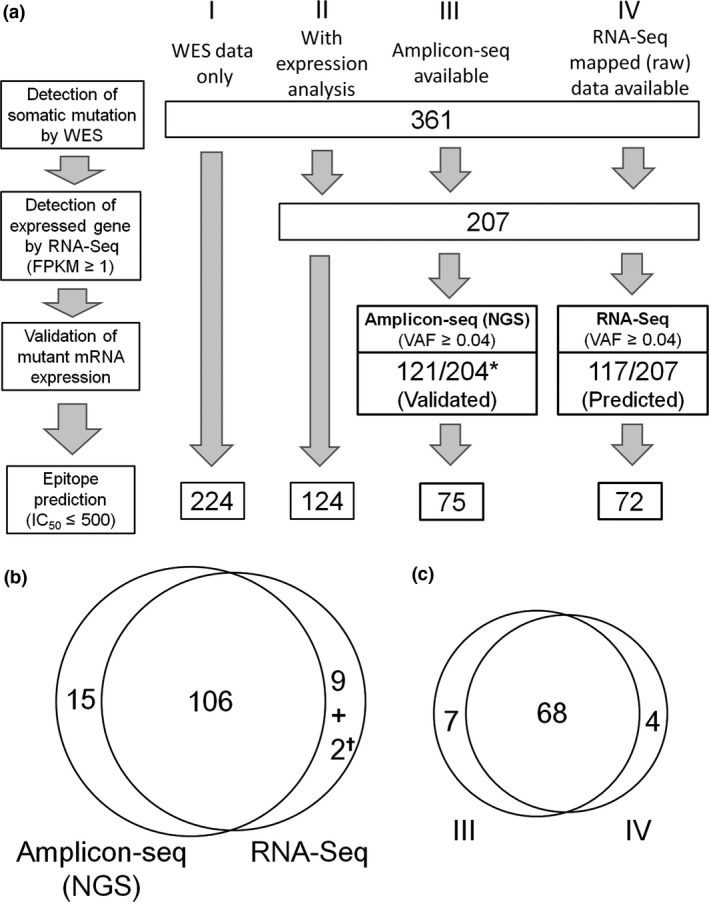
Prediction of candidate neoantigens by different strategies. (a) To predict potential neoantigens, detection of somatic mutations by whole‐exome sequencing (WES) was followed by confirmation of gene expression on the basis of fragments per kilobase of transcript per million fragments mapped (FPKM) ≥1 of RNA‐Seq of the tumor, validation of mutant RNA expression in the tumor, and prediction of peptide–MHC binding affinities by NetMHCpan. Strategy I: if the available data are WES only, there is no way to verify the expression of mutant mRNA. Here, 361 somatic missense mutations detected by WES alone were submitted to NetMHCpan, and 224 candidate neoantigens were predicted. Strategy II: if gene expression data are also available, the list of somatic mutations detected by WES can be narrowed down (here, to 207 mutations with FPKM ≥1 of RNA sequencing [RNA‐Seq]), resulting in 124 candidate neoantigens. Strategy III: when amplicon‐seq data are available, expression of mutant mRNA can be validated. Except for three mutations for which primers for cDNA amplification were not available, amplicon‐seq using next‐generation sequencing (NGS) could be undertaken for all (*) mutations. Expression of 121 mutant mRNA was validated, resulting in 75 predicted candidate neoantigens. Strategy IV: evaluating the expression of mutant mRNA examined by RNA‐Seq mapped data only, instead of performing amplicon‐seq. Selecting a variant allele frequency (VAF) ≥0.04 resulted in 117 of 207 mutant mRNA predicted to be significantly expressed in the tumor, yielding 72 candidate neoantigens. (b) Intratumoral expression of 121 (by strategy III) or 117 (by strategy IV) mutations was confirmed by amplicon‐seq (NGS) or RNA‐Seq, respectively. Of these, 106 were validated by both amplicon‐seq (NGS) and RNA‐Seq, with 15 detected only by amplicon‐seq (NGS). Of the 11 mutations detected by RNA‐Seq but not by amplicon‐seq (NGS), 9 were false positives where mutant mRNA expression could not be detected by amplicon‐seq (NGS). The remaining two (✝) were not evaluable because primers for amplicon‐seq could not be generated. (c) Of the 72 candidate neoantigens predicted using strategy IV, 68 were also predicted by strategy III.
Prediction of appropriate neoantigen candidates using Exome and RNA‐Seq
Commonly, the final step of in silico screening for potential neoantigens depends on an algorithm for predicting the binding affinity of mutated peptides to the patients’ individual HLA‐A, ‐B, and ‐C molecules. Tumor‐specific variant proteins that harbor mutant peptides with an IC50 ≤500 nM are generally regarded as candidate neoantigens. To develop immunotherapies targeting neoantigens, the detection of mutant mRNA in the tumor is preferable over the mere counts of neoantigens (neoantigen load) as biomarkers. A set of actually expressed mutant transcripts rather than only mutated genes, some of which might not give rise to transcripts at all, should preferably be used for MHC class I binding affinity prediction.
As shown in Figure 4(a), in our four patients, we detected a total of 361 somatic missense mutations. The numbers of mutations and candidate neoantigens for each individual patient are shown in Table S5. These 361 somatic mutations were analyzed by NetMHCpan epitope prediction, which identified 224 candidate neoantigens with IC50 ≤500 nM (Fig. 4a, strategy I). When FPKM of RNA‐Seq was incorporated into the WES data, a list of 207 mutated genes expressed in the tumors with FPKM ≥1 was generated. Of these, NetMHCpan predicted that 124 could represent candidate neoantigens with an IC50 ≤500 nM (Fig. 4a, strategy II). When expression of mutant mRNA sequences was confirmed by amplicon‐seq, a more precise list of expressed mutant mRNA could be obtained. Thus, of the 207 mutations with FPKM ≥1, amplicon‐seq could be performed for 204, yielding 121 with a VAF ≥0.04 by amplicon‐seq (NGS). Accordingly, they were considered to represent expressed mutant mRNAs. Of these, 75 with an IC50 ≤500 nM may be regarded as candidate neoantigens (Fig. 4a, strategy III). Additionally, of 361 mutated genes detected by WES, RNA‐Seq of the tumor selected 117 missense mutant RNA sequences with FPKM ≥1 and VAF ≥0.04 (Fig. 4a, strategy IV). From these data, 72 candidate neoantigens were identified.
Returning to strategy I, among the 224 predicted candidate neoantigens, only 75 were likely to be expressed in tumor. This would yield as positive predictive value of only 33.5% (75 of 224) using strategy I. For strategy II, the positive predictive value would be better but still only 60.5% (75 of 124). The number of candidate neoantigens determined by strategies III and IV was 75 and 72, respectively, with 68 identified by both strategies (Fig. 4c), leaving 7 identified by strategy III alone, and 4 by strategy IV alone. Therefore, positive predictive values for strategy IV rose to 94.4% (68 of 72). Thus, it can be concluded that, even without additional PCR amplification and sequencing, utilization of raw or mapped data of tumor RNA‐Seq combined with WES enables us to predict neoantigens efficiently and accurately.
Discussion
The assessment of neoantigen load, such as initially the number of candidate neoantigens, has attracted a great deal of attention as a potential biomarker for immunotherapy. Accurate prediction of neoantigens as therapeutic targets is further required for the development of individualized cancer vaccines. For these reasons, precise and efficient prediction of candidate neoantigens is important.
Approaches using WES data only (that we here designated strategy I) or together with gene expression data (strategy II) have been used in clinical trials of checkpoint inhibitors to evaluate neoantigen load as a biomarker of the therapy, but assessment of mutant mRNA expression in the tumor itself has not been taken into consideration.24, 25 However, mutant gene expression in the tumor is crucial if neoantigen load as a biomarker is to reflect relevant immune responses to the tumor. In this respect, strategy II is superior to strategy I, and strategy III (WES + FPKM ≥1 of RNA‐Seq + detection of mutated sequences by amplicon sequencing of tumor cDNA) is more rational than strategy II. Here, we showed that strategy IV (WES + FPKM ≥1 + VAF ≥0.04 by RNA‐Seq) was comparable to strategy III. Therefore, we consider strategy IV is the practical and appropriate strategy to predict candidate neoantigens fully utilizing currently available information without the necessity for additional cDNA sequencing. Actually, RNA‐Seq or cDNA capture sequencing data have been used for validation of mutant mRNA expression,7, 10, 12, 26 although the methods differ from one research to another.
The commonly used strategy of combining WES data and FPKM values of RNA‐Seq (i.e. strategy II) cannot formally confirm the existence of mutated mRNA in the cancer cells themselves. Tumor samples contain both cancer cells and normal cells; mutated and non‐mutated sequences coexist in the sample at different ratios for the genes concerned. The FPKM values of RNA‐Seq reflect the amount of mRNA including sequences encompassing normal as well as mutated positions. Even if particular reads cover the mutated position, sequences with or without mutation are counted without distinguishing between the two. Thus, a high FPKM does not necessarily reflect the expression of the mutated gene product. In cases where tumor cells contain mutated DNA that is not expressed, and normal cells express that mRNA without any mutation, genes with a high FPKM will nonetheless not represent a source of neoantigen. Therefore, assessment of the actual expression of mutated sequences by cDNA sequencing is required. However, amplicon‐seq requires the preparation of cDNA samples and primers, which is expensive and time‐consuming. To avoid these steps, RNA‐Seq of the tumor could be used not only to evaluate FPKM but to carry out variant reads at each mutation site. The fact that data from RNA‐Seq include information on gene expression levels as well as nucleotide sequences is one of the advantages of this method over microarray analysis. In fact, we show that a cut‐off value of VAF ≥0.04 for RNA‐Seq data yields a sufficiently high positive predictive rate for mutant mRNA expression in this study (Table 2).
Importantly, because of the trade‐off between obtaining too many false negatives and false positives, if we lower the cut‐off value of VAF, false negatives will decrease but false positives will increase. Conversely, increasing the VAF cut‐off and setting another cut‐off with variant‐read count would yield a lower false positive rate but with higher false negative rates for predicting candidates of expressed mutant mRNA (Table 2). Therefore, VAF filters can be used in a flexible manner to prioritize candidate neoantigens, depending on the required accuracy. For example, Yadav et al. used RNA‐Seq VAF 0.04 as a cut‐off, whereas Cohen et al. used 0.1.7, 26
Taken together, we conclude that integrating RNA‐Seq data with WES is very useful in in silico candidate neoantigen prediction, yielding acceptable accuracy with no additional costs or time. Although assessments of immunogenicity of these neoantigens using tumor cells and autologous PBMCs or tumor infiltrating lymphocytes are ideally required to confirm bona fide neoantigens, the reactivity was evaluated with three HLA‐A2 donors (Fig. S2), because no PBMC from patients were available in this study. γ‐Interferon production was detected with two HLA‐A2‐restricted neoantigen peptides in one donor. These results suggest that immunogenic neoantigens can actually be predicted by strategy IV. Recently, Strønen et al. have reported that neoantigen‐reactive T cells are detected in healthy donors and show that adoptive T‐cell therapy targeting neoantigens is feasible by transferring neoantigen‐reactive T‐cell receptor genes obtained from healthy donors into patients’ T cells.27 Therefore, prediction of candidate neoantigens can broaden the patients’ opportunities for cancer immunotherapy.
There are, however, several limitations to this approach. First, an adequate number of sequencing reads are required for strategy IV. In the present study, the average number of initial RNA‐Seq reads was 76.0 M (7.6 G bases). To examine the required depth of RNA‐Seq for mutant mRNA detection, mutations were reevaluated with 1/16, 1/8, 1/4, 3/8, 1/2, and 3/4 of total reads in each patient (Fig. S3). As expected, many mutations were missed and the detection rate of mutant mRNA decreased with fewer RNA‐Seq reads. The detection rate of mutant mRNA saturated at 70–80% of total reads: that is, 50–60 M reads (5–6 G bases). Therefore, RNA‐Seq data of ≥5 G bases is preferable for strategy IV. Second, the quality of NGS data depends on several factors including the quality of each DNA and RNA sample, the number of total sequencing reads, and quality control of the primary sequence data. These encompass several biological obstacles; not only the degradation of RNA in tumor samples or errors due to reverse transcription and sequencing,2 but also intratumoral heterogeneity and contamination with normal tissues such as blood cells and stromal cells in the tumor samples make it difficult to identify the tumor‐specific mutations with a high degree of certainty. Finally, variant call results differ a great deal depending on which software is used. Further study is needed to determine the optimal software combination. This same limitation also applies to the MHC binding affinity prediction software. Although sequencing technologies and bioinformatics have made remarkable advances of late, they are certainly still not perfect.
Nevertheless, knowing the advantages and disadvantages of different approaches, we could accommodate most of these advanced technologies. As described here, a combination of WES data and RNA‐Seq data offers many advantages for identifying those mutant transcripts that are actually expressed in order to predict candidate neoantigens for each individual patient's tumor. RNA‐Seq data can be used for different types of analyses such as gene expression profiling and gene set/pathway enrichment analyses; it is in increasing demand and it is now becoming more feasible to access both WES and RNA‐Seq data in the clinical setting. Using strategy IV, the additional burden of cDNA sequencing can be avoided. We therefore propose strategy IV as the optimal practical and appropriate strategy for predicting candidate neoantigens.
Finally, several different strategies are currently used to predict and prioritize candidate neoantigens, and thus interpretation of neoantigen load reported in published works requires caution and makes it difficult to compare different studies. Illustrating this, in the present study, starting from the same number of somatic missense mutations (i.e., 361 mutations detected by WES in four non‐small‐cell lung cancers), we derived different candidate neoantigen counts from 72 to 224 by applying different current strategies.
Disclosure Statement
The Department of Immunotherapeutics, The University of Tokyo Hospital is endowed by Medinet Co. Ltd.. K.K. received research support from Medinet Co. Ltd. A.H. is an employee of Medinet Co. Ltd. All other authors have no conflict of interest.
Supporting information
Fig. S1. Comparison of RNA‐Seq and amplicon‐seq.
Fig. S2. T‐cell reactivity to candidate neoantigen peptides.
Fig. S3. Adequate sequencing reads for mutant mRNA detection by strategy IV.
Table S1. Primers used for amplicon‐seq.
Table S2. Number of somatic missense mutations.
Table S3. List of all somatic missense mutations.
Table S4. Result of amplicon‐seq.
Table S5. Comparison of strategies.
Acknowledgments
The authors thank Koji Nagaoka, Tamaki Iino, Shin‐nosuke Kimura, and Takuya Takahashi (Medinet Co. Ltd.) for peptide synthesis, Yukari Kobayashi, Kosuke Odaira, Nao Fujieda, and Kaori Kambara (Medinet Co. Ltd.) for T‐cell culture, and Makoto Ikeda (Kazusa DNA Research Institute) for data analyses. This study was supported in part by Japan Society for the Promotion of Science Kakenhi Grant Nos. 16H04708 (K.K.), 15H04942 (J.N.), 16K07162 (H.M.), and 26462124 (K.N.).
Cancer Sci 108 (2017) 170–177
Funding Information
Japan Society for the Promotion of Science Kakenhi Grant Nos. 16H04708 (K.K.), 15H04942 (J.N.), 16K07162 (H.M.), and 26462124 (K.N.).
References
- 1. Schumacher TN, Schreiber RD. Neoantigens in cancer immunotherapy. Science 2015; 348: 69–74. [DOI] [PubMed] [Google Scholar]
- 2. Gubin MM, Artyomov MN, Mardis ER et al Tumor neoantigens: building a framework for personalized cancer immunotherapy. J Clin Invest 2015; 125: 3413–21. [DOI] [PMC free article] [PubMed] [Google Scholar]
- 3. Matsushita H, Vesely MD, Koboldt DC et al Cancer exome analysis reveals a T‐cell‐dependent mechanism of cancer immunoediting. Nature 2012; 482: 400–4. [DOI] [PMC free article] [PubMed] [Google Scholar]
- 4. Castle JC, Kreiter S, Diekmann J et al Exploiting the mutanome for tumor vaccination. Cancer Res 2012; 72: 1081–91. [DOI] [PubMed] [Google Scholar]
- 5. Robbins PF, Lu YC, El‐Gamil M et al Mining exomic sequencing data to identify mutated antigens recognized by adoptively transferred tumor‐reactive T cells. Nat Med 2013; 19: 747–52. [DOI] [PMC free article] [PubMed] [Google Scholar]
- 6. van Rooij N, van Buuren MM, Philips D et al Tumor exome analysis reveals neoantigen‐specific T‐cell reactivity in an ipilimumab‐responsive melanoma. J Clin Oncol 2013; 31: e439–42. [DOI] [PMC free article] [PubMed] [Google Scholar]
- 7. Cohen CJ, Gartner JJ, Horovitz‐Fried M et al Isolation of neoantigen‐specific T cells from tumor and peripheral lymphocytes. J Clin Invest 2015; 125: 3981–91. [DOI] [PMC free article] [PubMed] [Google Scholar]
- 8. Pritchard AL, Burel JG, Neller MA et al Exome sequencing to predict neoantigens in melanoma. Cancer Immunol Res 2015; 3: 992–8. [DOI] [PubMed] [Google Scholar]
- 9. Tran E, Ahmadzadeh M, Lu YC et al Immunogenicity of somatic mutations in human gastrointestinal cancers. Science 2015; 350: 1387–90. [DOI] [PMC free article] [PubMed] [Google Scholar]
- 10. Kreiter S, Vormehr M, van de Roemer N et al Mutant MHC class II epitopes drive therapeutic immune responses to cancer. Nature 2015; 520: 692–6. [DOI] [PMC free article] [PubMed] [Google Scholar]
- 11. Srivastava PK. Neoepitopes of cancers: looking back. Looking ahead. Cancer Immunol Res 2015; 3: 969–77. [DOI] [PMC free article] [PubMed] [Google Scholar]
- 12. Carreno BM, Magrini V, Becker‐Hapak M et al Cancer immunotherapy. A dendritic cell vaccine increases the breadth and diversity of melanoma neoantigen‐specific T cells. Science 2015; 348: 803–8. [DOI] [PMC free article] [PubMed] [Google Scholar]
- 13. Linnemann C, van Buuren MM, Bies L et al High‐throughput epitope discovery reveals frequent recognition of neo‐antigens by CD4+ T cells in human melanoma. Nat Med 2015; 21: 81–5. [DOI] [PubMed] [Google Scholar]
- 14. Li H, Durbin R. Fast and accurate short read alignment with Burrows‐Wheeler transform. Bioinformatics 2009; 25: 1754–60. [DOI] [PMC free article] [PubMed] [Google Scholar]
- 15. McKenna A, Hanna M, Banks E et al The Genome Analysis Toolkit: a MapReduce framework for analyzing next‐generation DNA sequencing data. Genome Res 2010; 20: 1297–303. [DOI] [PMC free article] [PubMed] [Google Scholar]
- 16. Koboldt DC, Zhang Q, Larson DE et al VarScan 2: somatic mutation and copy number alteration discovery in cancer by exome sequencing. Genome Res 2012; 22: 568–76. [DOI] [PMC free article] [PubMed] [Google Scholar]
- 17. Cibulskis K, Lawrence MS, Carter SL et al Sensitive detection of somatic point mutations in impure and heterogeneous cancer samples. Nat Biotechnol 2013; 31: 213–9. [DOI] [PMC free article] [PubMed] [Google Scholar]
- 18. Trapnell C, Pachter L, Salzberg SL. TopHat: discovering splice junctions with RNA‐Seq. Bioinformatics 2009; 25: 1105–11. [DOI] [PMC free article] [PubMed] [Google Scholar]
- 19. Trapnell C, Williams BA, Pertea G et al Transcript assembly and quantification by RNA‐Seq reveals unannotated transcripts and isoform switching during cell differentiation. Nat Biotechnol 2010; 28: 511–5. [DOI] [PMC free article] [PubMed] [Google Scholar]
- 20. Karasaki T, Nagayama K, Kawashima M et al Identification of individual cancer‐specific somatic mutations for neoantigen‐based immunotherapy of lung cancer. J Thorac Oncol 2016; 11: 324–33. [DOI] [PubMed] [Google Scholar]
- 21. Major E, Rigó K, Hague T et al HLA typing from 1000 genomes whole genome and whole exome illumina data. PLoS ONE 2013; 8: e78410. [DOI] [PMC free article] [PubMed] [Google Scholar]
- 22. Nielsen M, Lundegaard C, Blicher T et al NetMHCpan, a method for quantitative predictions of peptide binding to any HLA‐A and ‐B locus protein of known sequence. PLoS ONE 2007; 2: e796. [DOI] [PMC free article] [PubMed] [Google Scholar]
- 23. Hoof I, Peters B, Sidney J et al NetMHCpan, a method for MHC class I binding prediction beyond humans. Immunogenetics 2009; 61: 1–13. [DOI] [PMC free article] [PubMed] [Google Scholar]
- 24. Rizvi NA, Hellmann MD, Snyder A et al Cancer immunology. Mutational landscape determines sensitivity to PD‐1 blockade in non‐small cell lung cancer. Science 2015; 348: 124–8. [DOI] [PMC free article] [PubMed] [Google Scholar]
- 25. Van Allen EM, Miao D, Schilling B et al Genomic correlates of response to CTLA‐4 blockade in metastatic melanoma. Science 2015; 350: 207–11. [DOI] [PMC free article] [PubMed] [Google Scholar]
- 26. Yadav M, Jhunjhunwala S, Phung QT et al Predicting immunogenic tumour mutations by combining mass spectrometry and exome sequencing. Nature 2014; 515: 572–6. [DOI] [PubMed] [Google Scholar]
- 27. Strønen E, Toebes M, Kelderman S et al Targeting of cancer neoantigens with donor‐derived T cell receptor repertoires. Science 2016; 352: 1337–41. [DOI] [PubMed] [Google Scholar]
Associated Data
This section collects any data citations, data availability statements, or supplementary materials included in this article.
Supplementary Materials
Fig. S1. Comparison of RNA‐Seq and amplicon‐seq.
Fig. S2. T‐cell reactivity to candidate neoantigen peptides.
Fig. S3. Adequate sequencing reads for mutant mRNA detection by strategy IV.
Table S1. Primers used for amplicon‐seq.
Table S2. Number of somatic missense mutations.
Table S3. List of all somatic missense mutations.
Table S4. Result of amplicon‐seq.
Table S5. Comparison of strategies.