

Abstract
Myeloid‐derived suppressor cells (MDSCs) cause paraneoplastic leukemoid reactions and facilitate tumor cell metastasis. However, the interaction of MDSCs with tumor cells in live tissue has not been adequately visualized. To accomplish this task, we developed an intravital imaging protocol to observe metastasized tumor cells in mouse lungs. For visualization of the activation of MDSCs, bone marrow cells derived from transgenic mice expressing a Förster resonance energy transfer biosensor for ERK were implanted into host mice. Under a two‐photon excitation microscope, numerous polymorphonuclear cells (PMNs) were found to infiltrate the lungs of tumor‐bearing mice in which 4T1 mammary tumor cells were implanted into the footpads. By Förster resonance energy transfer imaging, we found ERK activation in PMNs around the 4T1 tumor emboli in the lungs. Because antibody array analysis implied the involvement of osteopontin (OPN) in the metastasis of 4T1 cells, we further analyzed the effect of OPN knockdown. The OPN knockdown in 4T1 cells did not affect the cell growth, but markedly suppressed lung metastasis of 4T1 cells and ERK activation in PMNs in the lung. Intravenous injection of recombinant OPN restored the lung metastasis of OPN‐deficient 4T1 cells, suggesting that OPN functioned in a paracrine manner. It has been reported that ERK activation of neutrophils causes NETosis and that PMNs promote metastasis of tumor cells by NETosis. In agreement with previous reports, the NETosis inhibitor DNase I inhibited lung metastasis of 4T1 cells. These observations suggest that OPN promotes metastasis of 4T1 cells by activating PMNs and inducing NETosis.
Keywords: Cancer imaging, immune system imaging, immunosurveillance, tumor immunology, two‐photon excitation microscopy
Tumor microenvironments contribute to the initiation, progression, and metastasis of tumor cells.1 Myeloid‐derived suppressor cells, which are a heterogeneous cell population of monocytic and granulocytic immature cells,2 cause paraneoplastic leukemoid reactions and facilitate tumor cell metastasis.3 Growth of 4T1 tumor cells, which have been extensively used as a metastasis model of human metastatic breast cancer,4 also accompanies paraneoplastic leukemoid reactions in a manner dependent on cytokines and ECM proteins, including granulocyte‐colony stimulating factor, monocyte chemoattractant protein 1/C‐C motif chemokine ligand 2 and preosteoblast EGF‐like repeat protein with MAM domain.5, 6, 7
Osteopontin, also known as secreted phosphoprotein 1, is another extracellular protein that exerts a pleiotropic effect on tumor growth.8 The functional mechanisms linked to the tumor‐promoting activities of OPN include increased survival of tumor cells, enhanced invasion, and angiogenesis.9 Moreover, OPN also induces systemic tumor‐promoting effects such as facilitation of the growth of indolent tumors and recruitment of bone marrow‐derived cells.10
The advent of intravital imaging by two‐photon microscopy has greatly accelerated our understanding of the dynamic aspect of the metastatic process: cells exit the primary tumor, invade the local tissue, intravasate, extravasate, and colonize at remote organs.11 However, intravital imaging of lung, the primary target of tumor metastasis, has not been as easy as that of other organs due to the motion artifacts caused by breathing.12 The recent invention of the vacuum‐stabilized imaging window has greatly alleviated the motion artifacts of the lung and permitted live imaging of this organ.13, 14 For example, Headley et al.15 visualized the phagocytosis of the fragmented cell body of cancer cells by residential macrophages of the lung.
The recent application of FRET biosensors to intravital imaging has opened a new field of research, which visualizes the spatiotemporal dynamics of signaling molecule activities in a physiological context. For example, the effects of anticancer drugs have been visualized in tumors of live mice16, 17, 18 and the timing of neutrophil activation was captured during extravasation in an inflamed tissue.19 Here, by using transgenic mice expressing the FRET biosensor for the ERK MAPK, we show that polymorphonuclear leukocytes in tumor‐bearing mice are activated by direct interaction with 4T1 tumor cell emboli in the pulmonary capillary. Osteopontin has been found to be indispensable not only for the activation of PMNs but also colonization of the tumor cells.
Materials and Methods
Plasmids
pCX4‐derived lentiviral expression vectors were provided by Tsuyoshi Akagi.20 Lentiviruses were produced by using Lenti‐X 293T cells according to the manufacturer's protocol (TaKaRa Bio, Shiga, Japan). The pPB piggyBac transposon vector and pCMV‐mPBase (neo‐) encoding the piggyBac transposase were provided by Kosuke Yusa and Allan Bradley of the Welcome Trust Sanger Institute (Cambridge, UK).21 The shRNA sequences inserted into the pLKO.1 TRC lentivirus vector (Addgene, Cambridge, MA, USA) are shown in Table S1. As a negative control, a scramble shRNA (scr) (plasmid #1864; Addgene) was used.
Mammary tumor cell culture
4T1 mammary tumor cells were purchased from ATCC (Manassas, VA, USA) and maintained on a collagen‐coated dish (AGC Techno Glass, Tokyo, Japan) in RPMI‐1640 medium (Thermo Fisher Scientific, Waltham, MA, USA) containing 10% FBS (Sigma‐Aldrich, St. Louis, MO, USA) and 1% penicillin–streptomycin (Nacalai Tesque, Kyoto, Japan) at 37°C in a humidified atmosphere containing 5% CO2. A BindShut II dish (AGC Techno Glass) was used for suspension culture. For establishment of 4T1 cell lines expressing iRFP, 4T1 cells were infected with the lentivirus produced from pCX4bsr‐iRFP. After blasticidin S selection at 10 μg/mL for 1 week, the bright cell population was collected by FACS (FACSAria II; BD Biosciences, Franklin Lakes, NJ, USA) and subjected to single cell cloning. For the expression of tdTomato, piggyBac transposon plasmids encoding the tdTomato gene (pPBbsr2‐tdTomato) and pCMV‐mPBase were cotransfected into 4T1 cells by using Lipofectamine 3000 (Thermo Fisher Scientific). After blasticidin S selection (10 μg/mL) for 1 week, the bright cell population was collected by FACS. For knockdown experiments, 4T1 cells were infected with lentiviruses encoding shRNAs (Table S1) or scramble control. After puromycin selection for 1 week, knockdown efficiency was confirmed by immunoblotting.
Antibodies and reagents
The following primary and secondary antibodies were used for immunoblotting: anti‐mouse OPN rabbit polyclonal antibody (IB1397; Immuno‐Biological Laboratories, Gunma, Japan), anti‐α‐tubulin (DM1A) mouse mAb (Millipore, Billerica, MA, USA), IRDye 680 goat anti‐mouse IgG and IRDye 800CW goat anti‐rabbit (LI‐COR Biosciences, Lincoln, NE, USA). Anti‐CD44 (GTX15834) was purchased from GeneTex (Irvine, CA, USA). Anti‐CD51 (104108), anti‐CD61 (104310), anti‐CD29 (102209), and rat or hamster IgG were purchased from BioLegend (San Diego, CA, USA). Phycoerythrin‐labeled anti‐Gr‐1 and allophycocyanin‐labeled anti‐Ly6G (1A8) were purchased from BioLegend. Collagen type C was purchased from Nitta Gelatin (Osaka, Japan). Blasticidin S and puromycin were purchased from InvivoGen (San Diego, CA, USA). Geltrex and Qtracker 655 were purchased from Thermo Fisher Scientific. DNase I was purchased from Roche Diagnostics (Basel, Switzerland). PD0325901 was purchased from Wako (Osaka, Japan).
Immunoblotting
4T1 cells were lysed in 1× SDS sample buffer (62.5 mM Tris‐HCl [pH 6.8], 12% glycerol, 2% SDS, 0.04% bromophenol blue, and 5% 2‐mercaptoethanol). After sonication, the samples were loaded on precast 5–20% SDS‐PAGE gels (SuperSep Ace; Wako) and transferred to PVDF membranes (Millipore). After blocking with Odyssey blocking buffer (LI‐COR Biosciences) diluted 1:2 in TBS‐T for 30 min, the membranes were incubated with primary antibodies diluted in Can Get Signal (Toyobo, Osaka, Japan), followed by secondary antibodies diluted in TBS‐T. Proteins were detected by an Odyssey Infrared Imaging System (LI‐COR Biosciences) and analyzed by using the Odyssey imaging software.
Immunohistochemistry
Mouse lungs were fixed by intratracheal administration of 4% paraformaldehyde in PBS. Paraffin‐embedded tissues were sectioned with 3‐μm thickness and stained with anti‐phospho‐ERK (#4370; Cell Signaling Technology, Danvers, MA, USA), anti‐Gr‐1 (RB6‐8C5; BioLegend), and anti‐OPN (IBL, Fujioka, Gunma, Japan) antibodies. Antibodies were visualized with 3,3′‐diaminobenzidine (Dojindo, Kumamoto, Japan). Frozen sections with 6‐μm thickness were stained with anti‐phospho‐ERK, anti‐Gr‐1, and anti‐citrullinated histone H3 (ab5103; Abcam) antibodies and visualized with Alexa Fluor 488‐conjugated goat anti‐rabbit IgG (Thermo Fisher Scientific). Cell nuclei were stained with DAPI (Sigma‐Aldrich).
Antibody array
4T1 cells were cultured in RPMI‐1640 for 24 h to prepare the conditioned medium. Blood samples were collected from the postcaval vein of tumor‐bearing mice at day 30 or healthy mice. Plasma was collected by centrifugation at 1500 g for 10 min in a heparin‐coated tube. The conditioned medium and plasma were subjected to Mouse Cytokine Array 4 (AAM‐CYT‐4‐8; Raybiotech, Norcross, GA, USA) or Inflammation Antibody Array 1 (AAM‐INF‐1‐8; Raybiotech) according to the manufacturer's protocol for the Odyssey Infrared Imaging System (LI‐COR Biosciences). The mean spot density was measured by using the Odyssey software (LI‐COR Biosciences), and mean values above the reference value (mean density of the negative control spots) were charted on a graph using Excel 2010 (Microsoft, Redmond, WA, USA).
Cell growth assay
The iRFP‐expressing cell lines were double‐diluted from 1 × 10⁵/well to 1 × 10²/well and plated onto collagen‐coated 96‐well glass‐bottom plates (#4860‐010; AGC Techno Glass) in RPMI‐1640 medium containing 10% FBS. Fluorescence at 700 nm was measured by an Odyssey Infrared Imaging System (LI‐COR Biosciences) under the following conditions: resolution = 21 μm, quality = medium, intensity = 5.0 (700 nm), and focus offset = 0.5 mm. Three wells in which the fluorescence was correlated linearly to the number of cells were used for the analysis (n = 3).
Anchorage‐independent sphere formation assay
The iRFP‐expressing cell lines were maintained by shaking at 70 rpm in a humidified CO2 incubator essentially as described in previous studies.22, 23, 24 Cells were dissociated with Accutase (Sigma‐Aldrich) and transferred to non‐coated 6‐well plates (#1810‐006; AGC Techno Glass) in 2.25 mL serum‐free RPMI‐1640 medium at 5 × 10⁵ cells/well. After the addition of blocking antibodies at 2 μg/mL, cells were cultured on the shaker. Cell growth was measured with the Odyssey Infrared Imaging System as described above, except that the focus offset was set to 4 mm. Cell spheres were quantified by Metamorph software (Molecular Devices, Sunnyvale, CA, USA). In some experiments, cell spheres were collected by centrifugation at 300 g for 5 min, and trypsinized for 5 min at room temperature. Cells were then resuspended in serum‐containing PBS and counted by a Countess automated cell counter (Thermo Fisher Scientific) according to the manufacturer's protocol. In the coculture experiment, iRFP‐labeled 4T1 cells expressing shRNA against OPN (sh870) were cultured in the first well (5 × 10⁵/well). In the second well, iRFP‐labeled 4T1 cells expressing sh870 (2.5 × 10⁵/well) and non‐labeled 4T1 cells expressing the scr RNA (2.5 × 10⁵/well) were cocultured. After 24 h, the number of cell spheres was counted.
Recombinant OPN purification
Mouse OPN cDNA was purchased from Sino Biological (MG50116M; Beijing, China). The 12× histidine‐tag was inserted after the signal peptide sequence by PCR with the following primer set: forward, 5′‐ctcgaggccaccatgaggctgcagttctcctggctgaattctgagggactaactacgaccatgagattggcagtgatttg‐3′; and reverse, 5′‐gcggccgcctagtgatggtgatggtgatggtgatggtgatggtgatgtggtccctggaacaggacttccagtccggagttgacctcagaagatgaactc‐3′. The PCR fragment was inserted into the pPBbsr expression vector. The resulting plasmid pPBbsr2‐OPN‐12xHis was cotransfected with the piggyBac transposase expression vector into Lenti‐X 293T cells (TaKaRa Bio) with 293fectin (Thermo Fisher Scientific). The conditioned medium from 10 culture dishes was collected and centrifuged at 360 g ×5 min to remove cell debris. After the equilibration with PBS and 3 h of mixing with conditioned medium, TALON resin (TaKaRa Bio) was washed three times with wash buffer (50 mM NaH2PO4, 300 mM NaCl, and 10 mM imidazole [pH 7.0]) and mixed with elution buffer (50 mM NaH2PO4, 300 mM NaCl, and 500 mM imidazole [pH 7.0]) to elute the OPN‐12xHis fusion protein. The eluate was dialyzed with 2× PBS by using Slide‐A‐Lyzer Dialysis Cassettes (MWCO 2K; Thermo Fisher Scientific). The purity and amount of purified OPN were checked by immunoblotting with OPN antibody and Coomassie Brilliant Blue staining (Bio‐Rad, Hercules, CA, USA). Commercially available recombinant mouse OPN (R&D Systems, Minneapolis, MN, USA) was used as a reference protein.
Metastasis model
BALB/c mice were purchased from Japan SLC (Shizuoka, Japan) and housed in a specific pathogen‐free facility, and received unrestricted access to normal chow and drinking water. Mice (7–16 weeks old) were inoculated with 1 × 10⁶ 4T1 cells suspended in 50 μL PBS containing 50% Geltrex at the footpad.25, 26 After 2–4 weeks, the local tumor volume was calculated by the following formula: tumor volume (mm3) = length × width × height × 0.523. Lung metastatic foci of iRFP‐expressing cells were visualized by an Odyssey Infrared Imaging System (LI‐COR Biosciences) under the following conditions: resolution = 21 μm, quality = medium, intensity = 5.0 (700 nm)/5.0 (800 nm), and focus offset = 0.5 mm. The number of foci was obtained by MetaMorph software (Molecular Devices) with an inclusive threshold ≤200 for lung area and an inclusive threshold ≤2500 and size ≥10 for foci. In some experiments, the tumor‐bearing mice or healthy control mice were inoculated i.v. with 4T1 cells that were prepared as follows: 4T1 cells maintained on collagen‐coated dishes were harvested by Accutase, collected by centrifugation at 300 g for 5 min and cultured in RPMI‐1640 medium with 10% FBS on non‐coated BindShut II dishes for 8–10 h. After the removal of cell spheres with a 35‐μm cell strainer (#352235; BD Biosciences), the cells were counted and 1 × 10⁵ cells were injected from the tail vein. In the experiment with recombinant OPN injection, sh870‐expressing 4T1 cells were injected into the footpads of BALB/c mice. Two weeks later, recombinant OPN protein (8.4 μg/mouse) was injected i.v. into tumor‐bearing mice for 5 days prior to the injection of iRFP‐labeled sh870‐expressing 4T1 cells (1 × 10⁵). Three days later, metastatic foci in the lung were counted by an Odyssey Infrared Imaging System (LI‐COR Biosciences). In the experiment with DNase I injection, scr‐expressing 4T1 cells were injected into the footpads of BALB/c mice. Two weeks later, DNase I (2000 U) in PBS was given i.v. to tumor‐bearing mice after the i.v. injection of iRFP‐labeled scr‐expressing 4T1 cells (1 × 10⁵). Three days later, metastatic foci in the lung were counted by an Odyssey Infrared Imaging System. The animal protocols were reviewed and approved by the Animal Care and Use Committee of Kyoto University Graduate School of Medicine (No. 15064; Kyoto, Japan).
Bone marrow transplantation
Transgenic mice expressing the FRET biosensor for ERK activity have been reported previously.22 The transgenic mice were back‐crossed for more than six generations to BALB/c mice. Bone marrow transplantation was carried out according to the general protocol with some modifications.27 Briefly, bone marrow cells were harvested from the femurs and tibias of the transgenic mice. Red blood cells were lysed with red blood cell lysis buffer (0.75% NH4Cl, 0.017 M Tris‐HCl [pH 7.65], and 1 μM EDTA). Recipient mice were irradiated with 10‐Gy gamma rays and received 6 × 10⁶ bone marrow cells through the tail vain. Bone marrow‐transplanted mice were housed in a specific pathogen‐free facility and received drinking water containing 0.5 mg/mL enrofloxacin (pH 3.0; Tokyo Chemical Industry, Tokyo, Japan) for 1 month before experiments.
Intravital lung imaging by two‐photon excitation microscopy
Mice were anesthetized by 1.0–1.5% isoflurane (Wako) inhalation and placed on an electric heating pad (ThermoPlate; Tokai‐Hit, Shizuoka, Japan) maintained at 37°C. Isoflurane was supplied through a tracheostomy tube (Surflo indwelling catheter 22G; Terumo, Tokyo, Japan) connected to an artificial respirator (MK‐V100; Muromachi Kikai, Tokyo, Japan) under the following respirator conditions: 55 b.p.m., 35 mL/min, and an inspiratory/expiratory ratio of 3:2. For stabilizing the exposed lung, a custom‐made vacuum‐stabilized imaging window was placed over the lung. Mice were observed with an FV1200MPE‐BX61WI upright microscope (Olympus, Tokyo, Japan) equipped with a 25 × /1.05 water‐immersion objective lens (XLPLN 25XW‐MP; Olympus), which was connected to an InSight DeepSee laser (Spectra Physics, Mountain View, CA, USA). Images (512 × 512 pixels) were scanned at 2 μs/pixel with 1.5× digital zoom. The excitation wavelength for cyan fluorescent protein was 840 nm. We used an IR‐cut filter, BA685RIF‐3, two dichroic mirrors, DM505 and DM570, and three emission filters, BA460‐500 (Olympus) for cyan fluorescent protein, BA520‐560 (Olympus) for yellow fluorescent protein, and 645/60 (Chroma Technology, Bellows Falls, VT, USA) for tdTomato fluorescence. Acquired images were analyzed with MetaMorph software (Molecular Devices). If necessary, antibodies, cells, or recombinant proteins were injected from the tail vein.
Statistical analysis
P‐values for normal distributed data were calculated with Student's t‐test for the evaluation of statistically significant differences. For multiple groups, anova was used. Data analysis was carried out using Excel 2010 (Microsoft) or Prism software (GraphPad Software, La Jolla, CA, USA). Significance is shown as *P < 0.05, **P < 0.01, and ***P < 0.001.
Results
Intravital FRET imaging of lungs of tumor‐bearing mice
To gain insight into the mechanism of tumor metastasis, we undertook intravital FRET imaging of the lung. Motion artifacts caused by the animal's breathing were minimized by using a vacuum‐stabilized imaging window (Fig. 1a,b). BALB/c mice expressing a FRET biosensor for ERK MAPK, called FRET mice hereafter, were used to monitor cell activation. The ERK biosensor localizes at the cytoplasm and allows us to distinguish nuclear shapes. Monitoring was carried out up to a depth of 60 μm with a resolution sufficient to distinguish Ly6G/Gr‐1‐positive PMNs based on the nuclear shape (Figs 1c,d,S1). The morphology and the Ly6G/Gr‐1 positivity suggest that these PMNs are granulocytic MDSCs.2 For consistency, we hereafter refer to these lung‐infiltrating cells as PMNs.
Figure 1.
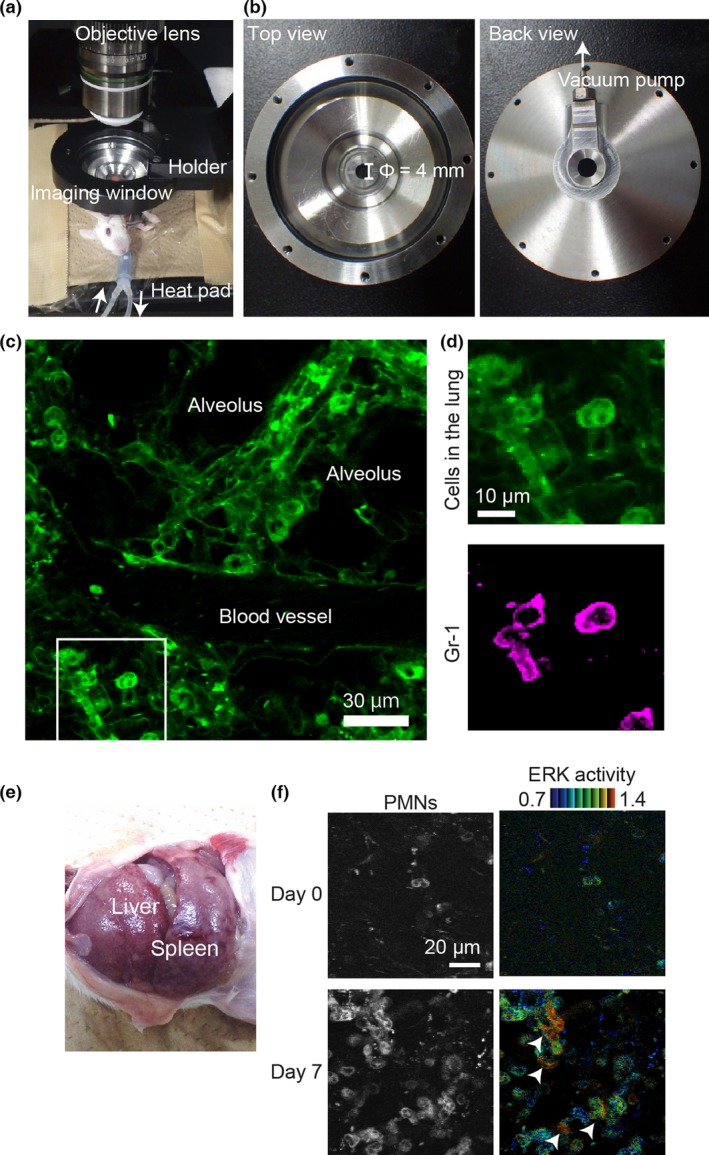
Intravital Förster resonance energy transfer (FRET) imaging of lung metastasis in mouse by two‐photon excitation microscopy. (a) Layout of the intravital imaging system for the mouse lung. An anesthetized FRET mouse for ERK was placed on an electric heating pad and set under a custom‐made, vacuum‐stabilized imaging window to minimize the motion artifacts caused by breathing. (b) The top and back view of the vacuum‐stabilized imaging window. The diameter of the window area is 4 mm. (c) Cyan fluorescent protein fluorescence image of the lung of a FRET mouse, into which 6 μg phycoerythrin (PE)‐labeled anti‐Gr‐1 antibody was injected i.v. (d) Magnified images of the boxed region in (c). The PE image of the same region is also shown. Note that the polymorphonuclear cells (PMNs) are stained with PE‐labeled anti‐Gr‐1 antibody. (e) Image of hepatosplenomegaly 3 weeks after tumor inoculation at the footpad. (f) Bone marrow cells of a FRET mouse for ERK were transferred to a recipient BALB/c mouse. One month after bone marrow transplantation, 4T1 cells were inoculated at the footpad. The lung was observed on the day of tumor cell inoculation (day 0) and day 7. Yellow fluorescent protein images (left) and FRET/cyan fluorescent protein images for ERK activity (right) are shown. Of note, ERK activation is observed in some PMNs (arrowheads).
The 4T1 mammary tumor cells were inoculated into syngeneic transgenic FRET mice at the footpad. Neutrophil infiltration into the lungs was observed within 1 week, followed by remarkable hepatosplenomegaly within 3 weeks (Fig. 1e). Prominent infiltration of PMNs was also observed in the lung (Fig. 1f, Movie S1). During the time‐lapse observation, occasional ERK activation in PMNs was observed (Figs 1f,S2, arrowheads). This observation implies that ERK activation in PMNs may play a role in the colonization of tumor cells in the lung. We attempted to visualize ERK activation in PMNs in paraffin‐fixed lungs by using an anti‐phospho‐ERK antibody (Fig. S3). However, we failed to show PMNs with high ERK activity convincingly, probably due to low sensitivity of immunohistochemistry.
Osteopontin required for growth of 4T1 mammary tumor cells in suspension culture
To understand the mechanism of PMN activation by 4T1 tumor cells, we searched pro‐metastatic molecules secreted by 4T1 tumor cells by using a Mouse Cytokine Array 4 and Inflammation Array 1 (Figs 2a,S4). In addition to known pro‐metastatic cytokines such as granulocyte‐colony stimulating factor, monocyte chemoattractant protein‐1, and MMP‐3, we found that OPN was increased in the conditioned medium of 4T1 cells. Because OPN has been reported to recruit neutrophils and facilitate metastasis of various tumors, in the following study we focused on the contribution of OPN to the metastasis of 4T1 cells. First, we knocked down OPN by shRNAs in 4T1 cells. In agreement with a previous report,10 shRNAs against OPN did not alter the cell growth or morphology of the 4T1 cells that grew on culture dishes (Fig. 2b–d). However, in suspension culture, expression of shRNAs against OPN markedly inhibited sphere formation (Fig. 2e–g) and replication of 4T1 cells (Fig. 2h,i). Sphere formation with OPN‐depleted cells was rescued by the addition of non‐fluorescent cells with scr shRNA (Fig. 2j), indicating that OPN could function in trans. To examine which OPN receptor mediates the sphere formation of 4T1 cells, we examined the effect of antibodies against several potential OPN receptors: CD44, CD51 (integrin αv), CD61 (integrin β3), and CD29 (integrin β1). Among them, only anti‐CD44 inhibited the sphere formation of 4T1 cells (Fig. 2k). In agreement with this observation, shRNA against CD44 completely inhibited the sphere formation of 4T1 cells (Fig. 2l). These results indicated that OPN promotes the sphere formation of 4T1 cells in a CD44‐dependent manner. To determine the OPN receptor in PMNs, isolated PMNs were cultured with recombinant OPN or antibodies against OPN receptors in vitro. However, we could not culture PMNs in vitro due to the short lifespan of PMNs; almost all PMNs died before the analysis. Alternatively, we have surveyed OPN receptors on neutrophils in published works (Table S2) and in the database (Table S3). It is reported that OPN physiologically interacts with at least nine integrins and CD44. Judging from Tables S2 and S3, integrin αvβ1, αvβ3, α4β1, α4β7, α5β1, α9β1, and CD44 were candidates of OPN receptors in PMNs.
Figure 2.
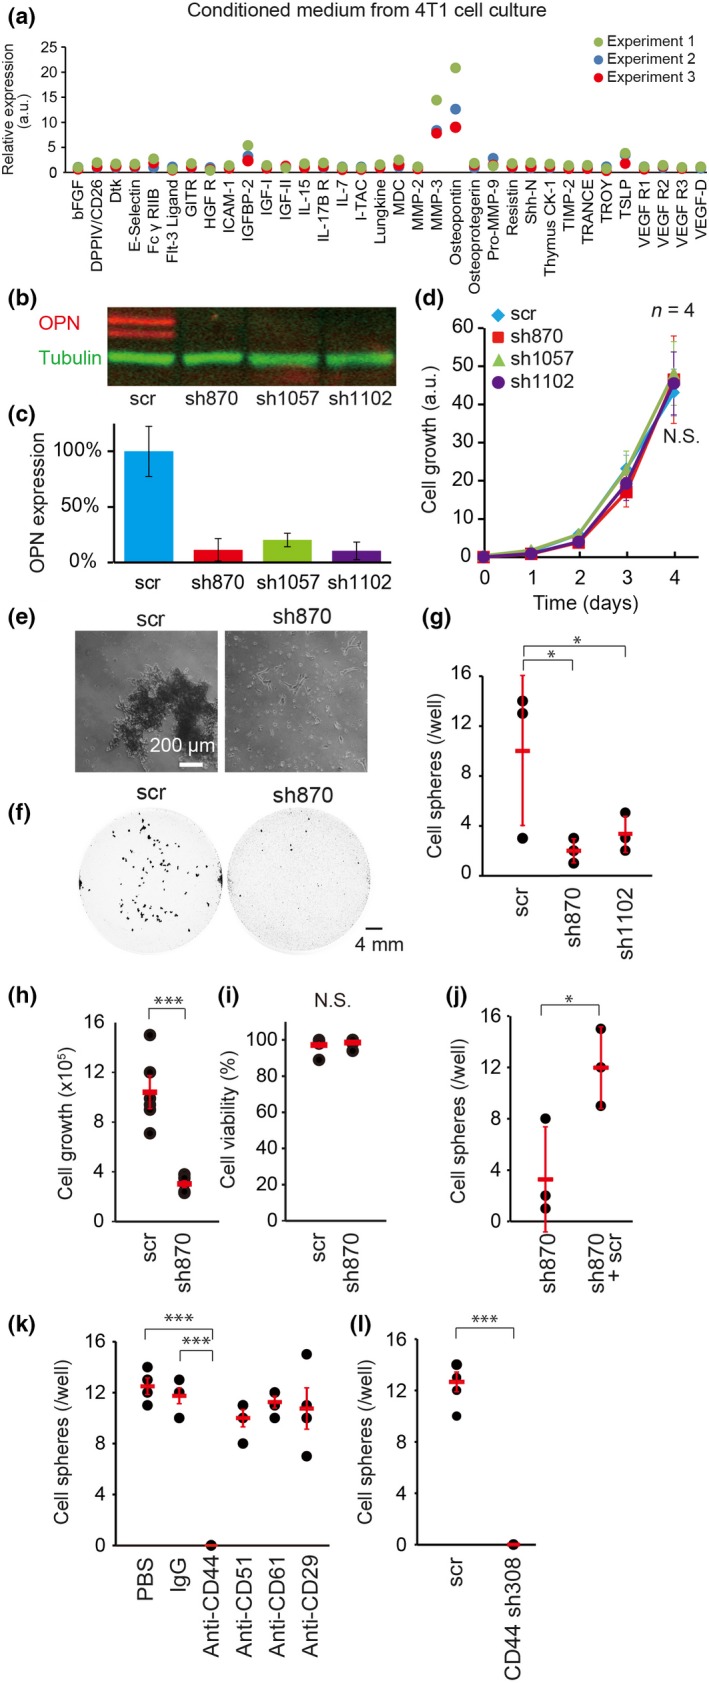
Requirement of osteopontin (OPN) for sphere formation in vitro. (a) Conditioned medium of 4T1 cells was subjected to analysis with a Mouse Cytokine Array 4 Kit (n = 3). (b, c) 4T1 cells expressing an shRNA against OPN (sh870, sh1057, or sh1102) or a scramble negative control shRNA (scr) were analyzed by SDS‐PAGE and immunoblotted with anti‐OPN (red) and anti‐β‐tubulin (green) antibodies. β‐Tubulin was used for normalization in (c). Bars = SD (n = 3). (d) 4T1 cell lines expressing shRNAs were subjected to cell growth assay in vitro. Bars = SD (n = 4). Statistical significance was not detected by one‐way anova (N.S.). (e) Near‐infrared fluorescent protein (iRFP)‐labeled 4T1 cells expressing scr or sh870 were cultured in suspension. Phase contrast images are shown. Bar = 200 μm. (f) iRFP images of 4T1 cell spheres grown in suspension. Bar = 4 mm. (g–i) 4T1 cells with shRNAs were cultured for 24 h in suspension (5 × 10⁵/well). Spheres larger than 0.1 mm2 were counted (g). Bars = SD (n = 3). Cells were harvested, dissociated, stained with Trypan blue, and analyzed with an automated cell counter (h, i). Bars = SD (n = 6). (j) In the first well, iRFP‐labeled sh870‐expressing 4T1 cells (5 × 10⁵/well) were cultured. In the second well, iRFP‐labeled sh870‐expressing 4T1 cells (2.5 × 10⁵/well) and non‐labeled scr‐expressing 4T1 cells (2.5 × 10⁵/well) were cocultured. After 24 h, the number of cell spheres with iRFP was counted. Bars = SD (n = 3). (k) 4T1 cells were cultured in the presence of the indicated antibodies at a concentration of 2 μg/mL. Bars = SD (n = 4). (l) 4T1 cells expressing scr or an shRNA against CD44 (sh308) were cultured in suspension for 24 h. Bars = SD (n = 4). (g–l) Statistical significance was determined by Student's t‐test. *P < 0.05; ***P < 0.001.
Osteopontin activates PMNs during colonization of 4T1 cells
Having elucidated the in vitro role of OPN on 4T1, we next examined the role of OPN in PMN activation around tumor cell emboli by injecting 4T1 cells expressing tdTomato red fluorescent protein into tumor‐bearing mice. Here, to show conclusively that the cells recruited to 4T1 cells were bone marrow‐derived inflammatory cells, we used BALB/c mice that had been transplanted with the bone marrow of ERK FRET mice. These bone marrow‐transplanted BALB/c mice were implanted with 4T1 cells at the footpad. Under this condition, more than 90% of the FRET biosensor‐expressing cells in the lung were positive for Ly6G/Gr‐1, a marker for PMNs (Fig. 3a). The tumor‐bearing BALB/c mice were next injected with 4T1 cells expressing either scr or sh870 RNA. When the scr‐expressing 4T1 cell emboli were trapped at the pulmonary capillary, PMNs were recruited to the 4T1 cells and activated (Figs 3b,d,S5,S6, Movie S2). However, when OPN‐depleted 4T1 cells expressing sh870 were injected into the BALB/c mice bearing OPN‐depleted 4T1 cells at the footpad, recruitment and activation of PMNs were markedly impaired (Figs 3c,e,S6, Movie S3). Before the i.v. injection of tumor cells, the numbers of PMNs in the lung were comparable between cells with scr and cells with sh870 (Fig. S7). To examine whether ERK activation in PMNs is required for tumor metastasis, we i.v. injected an MEK inhibitor into tumor‐bearing mice after tumor cell injection. As expected, MEK inhibitor suppressed ERK activation in PMNs and tumor metastasis (Fig. S8, Movie S4). Immunohistochemistry of lungs from tumor‐bearing mice agreed with the observation by intravital imaging: ERK activation in PMNs was observed after the injection of tumor cells expressing scr (Figs 3f,S9). These observations suggested that OPN may be required for PMN recruitment to the tumor cell emboli.
Figure 3.
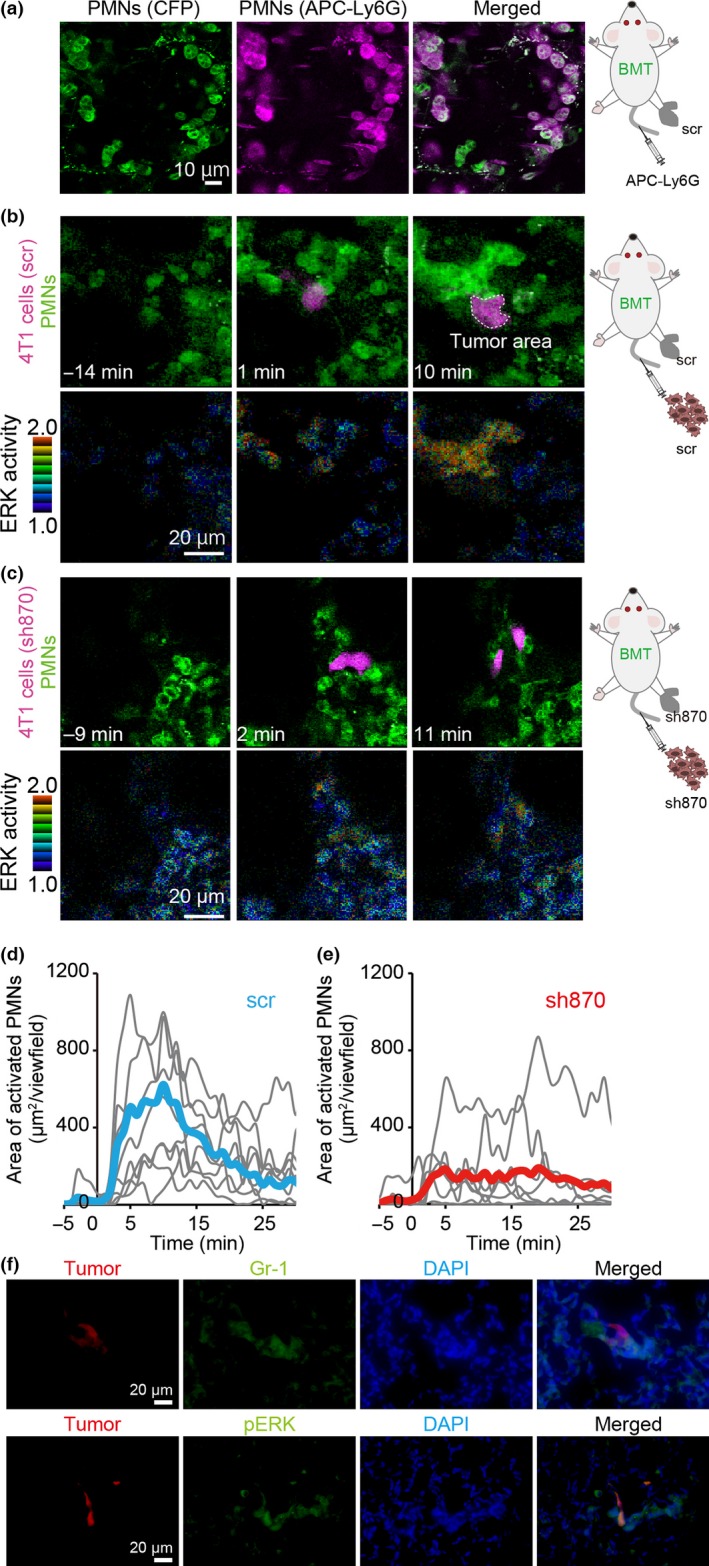
Osteopontin (OPN)‐dependence of polymorphonuclear cell (PMN) activation in lungs of tumor‐bearing mice. Bone marrow cells of a Förster resonance energy transfer (FRET) mouse for ERK were transplanted to host BALB/c mice. After 1 month, the mice received 4T1 cells expressing scramble shRNA (scr) or shRNA against OPN (sh870) at the footpad. Two weeks after inoculation of 4T1 cells, mice were observed with a two‐photon excitation microscope. (a) To the mouse bearing scr‐expressing 4T1 cells, 6 μg allophycocyanin (APC)‐labeled anti‐Ly6G antibody was injected into the tail vein. Lungs were observed in vivo under a two‐photon excitation microscope. (b, c) In the process of imaging, the mice were injected i.v. with 4T1 cells expressing either scr (b) or sh870 (c). Upper panels show PMNs (cyan fluorescent protein [CFP], shown in green) and tumor cells (tdTomato, shown in magenta). Lower panels show ERK activity (FRET/CFP ratio image), with the range of activity indicated on the left. (d, e) In each time‐lapse image, the activated PMN area showing high ERK activity, that is FRET/CFP ratio ≥1.3, was measured and plotted against time (n = 8). Blue and red lines show the mean value of scr‐ and sh870‐expressing 4T1 cells, respectively. (f) 4T1 cells expressing scr were inoculated at the footpad (1 × 10⁶/mouse). Two weeks later, 4T1 cells expressing scr and tdTomato were injected i.v. into the tumor‐bearing mouse (1 × 10⁵/mouse). Five minutes after injection, lungs were fixed with 4% paraformaldehyde in PBS. Frozen sections were stained with anti‐phospho‐ERK (pERK) and anti‐Gr‐1 antibodies. Bar = 20 μm. BMT, bone marrow‐transplanted.
Osteopontin required for efficient colonization of 4T1 cells
We observed that OPN was increased 1.7‐fold in the blood plasma of a tumor‐bearing mouse (Fig. 4a). To assess the contribution of OPN to lung metastasis over the long term, 4T1 cells expressing shRNAs against OPN or the scr shRNA were implanted into the footpads of syngeneic BALB/c mice. The OPN‐depleted 4T1 cells formed a local tumor mass as efficiently as did the scr shRNA‐expressing control 4T1 cells (Fig. 4b). However, the numbers of metastatic colonies were significantly reduced in mice inoculated with OPN‐depleted 4T1 cells compared to those in the mice inoculated with the scr shRNA‐expressing 4T1 cells (Fig. 4c,d). Notably, injection of rOPN induced ERK activation in PMNs (Fig. S10, Movie S5) and co‐injection of rOPN significantly facilitated the colonization of OPN‐depleted 4T1 cells in the lung (Fig. 4e), indicating that OPN functions in a paracrine manner.
Figure 4.
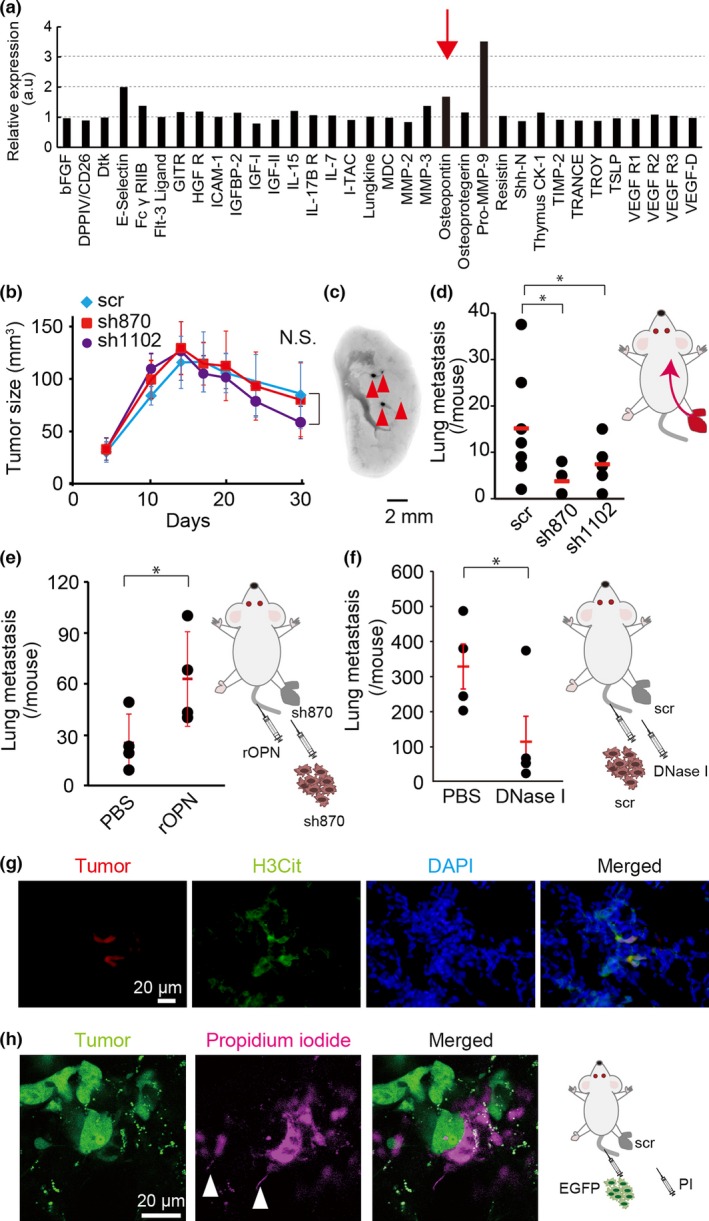
Requirement of osteopontin (OPN) for metastasis in vivo. (a) Blood plasma samples prepared from a 4T1 tumor‐bearing mouse and a control mouse were subjected to analysis with a Mouse Cytokine Array 4 Kit. The ratio of protein expression in the 4T1 tumor‐bearing mouse to that in the control mouse is shown. (b) 4T1 cells expressing an shRNA against OPN (sh870 or sh1102) or scramble shRNA (scr) were inoculated into the footpads of BALB/c mice. The tumor size was measured at the indicated time. Bars = SD (n = 4). Statistical significance was not detected by one‐way anova (N.S.). (c) Representative image of the metastatic foci of near‐infrared fluorescent protein (iRFP)‐labeled scr‐expressing 4T1 cells. Arrowheads indicate metastatic foci. (d) Numbers of metastatic foci of 4T1 cells expressing an shRNA (scr, sh870, or sh1102) were counted. Bars = SD (n = 7). Statistical significance was not detected by Student's t‐test. (e) Sh870‐expressing 4T1 cells were injected into the footpads of BALB/c mice. Two weeks later, recombinant OPN protein (rOPN; 8.4 μg/mouse) was injected i.v. into tumor‐bearing mice for 5 days prior to injection of iRFP‐labeled sh870‐expressing 4T1 cells. The numbers of metastatic foci were counted. Bars = SD (n = 4). Statistical significance was not detected by Student's t‐test. (f) The scr‐expressing 4T1 cells were injected into the footpads of BALB/c mice. Two weeks later, iRFP‐labeled scr‐expressing 4T1 cells were injected i.v. One hour later, DNase I (2000 U/mouse) was also injected i.v. into tumor‐bearing mice. Three days later, the numbers of metastatic foci were counted. Bars = SD (n = 4). Statistical significance was not detected by Student's t‐test. (g) 4T1 cells expressing scr were inoculated at the footpad (1 × 10⁶/mouse). Two weeks after the inoculation, the mouse was injected i.v. with 4T1 cells expressing scr and tdTomato red fluorescent protein (1 × 10⁵/mouse). Five hours after the injection, lungs were fixed with 4% paraformaldehyde in PBS. Frozen sections of fixed lungs were stained with anti‐citrullinated histone H3 (H3Cit) antibody and DAPI. Bar = 20 μm. (h) Intravital imaging of NETosis in tumor‐bearing mouse. A tumor‐bearing mouse was prepared as in (g). 4T1 cells expressing scr and EGFP were injected i.v. into the tumor‐bearing mouse (1 × 10⁵/mouse). Five hours after the injection, intravital imaging of lung was carried out and propidium iodide (PI) was injected i.v. to visualize extracellular DNA. White arrowheads indicate characteristic DNA fibers of NETosis. Bar = 20 μm. *P < 0.05.
Because OPN was required for PMN activation around the tumor emboli (Fig. 3), we reasoned that OPN‐mediated activation of PMNs may play roles in the colonization of 4T1 cells in the lung. Because ERK activation induces NETosis, we speculated that a NET may contribute to the colonization of 4T1 cells in the lung. To test this hypothesis, DNase I, an inhibitor of NET, was co‐injected with 4T1 cells. As expected, DNase I significantly inhibited the colonization of 4T1 cells in the lung (Fig. 4f). To support these observations, extracellular DNA that is characteristic of NETosis was also detected by immunohistochemistry and intravital imaging (Fig. 4g,h). These results suggested that OPN‐mediated ERK activation in PMNs facilitates tumor colonization by means of NETosis.
Discussion
Here, by using a vacuum‐assisted stabilizer, we succeeded in the visualization of PMNs infiltrating tumor‐burdened mouse lungs. The use of FRET mice for ERK further allowed us to observe PMN activation around tumor emboli in the lung. Phagocytosis of the fragmented cell bodies of cancer cells has already been live‐imaged in the lung,15 but additional information on the activities of signaling molecules will pave the way for the association of molecular activities with cellular function.
The expression level of OPN in the blood plasma or tissues correlates with poor prognosis in various malignant diseases, including breast cancers.28 In in vitro and in vivo models, OPN has been shown to play critical roles in tumor progression and metastasis by interacting with multiple cell surface receptors, including integrins and CD44.8, 9 Ironically, however, such pleiotropic functions obscure the principal effects of OPN, particularly in vivo. For example, it is not clear whether the increase in serum OPN is sufficient for OPN to affect remote organs. In our 4T1 cell model, the increase in OPN in serum was less than twofold that in the control (Fig. 4a). Because we examined only a single tumor‐bearing mouse, we cannot speculate at length on this observation; however, it does suggest that the increased serum OPN level may not have biological meaning except as a marker of tumor growth. In fact, knockdown of OPN did not affect PMN accumulation in the lung (Figs 3c,S7) or hepatosplenomegaly (data not shown). In consideration of these findings, we suggest that, at least in the 4T1 tumor model, OPN may function in a paracrine manner.
The paracrine function of OPN includes sphere formation in vitro (Fig. 2). The requirement of OPN for anchorage‐independent cell growth and protection from anoikis has been reported in human breast cancer cells and murine epidermal cells.29, 30 We have also found that OPN is required for cell growth in suspension culture. However, considering the period required for tumor cells to move from the primary tumor site to the lung, it remains unknown whether the prevention of anoikis in the blood affects the overall efficiency of lung metastasis in vivo.
In this regard, OPN may play a more important role in recruiting PMNs to the 4T1 tumor emboli at the pulmonary capillary. The PMNs around 4T1 tumor emboli were Ly6G/Gr‐1‐positive, suggesting that these PMNs were granulocytic MDSCs (Fig. 3a). Therefore, the PMNs may prevent cytotoxic or helper T cells from recognizing 4T1 cells and thereby promote the colonization of metastatic 4T1 cells. Alternatively, because PMNs are activated by binding to 4T1 cells, they may contribute to the holding of 4T1 cells by NET. Indeed, it has already been reported that NET contributes to the progression of many tumors.31, 32
Because ERK activation mediates the NETosis induced by phorbol‐12‐myristate‐13‐acetate, calcium pyrophosphate dehydrate, or Leishmania,33, 34, 35 the robust ERK activation around 4T1 cells in the lungs strongly argues for the occurrence of NETosis. In fact, released DNA that is characteristic of NETosis was confirmed by immunohistochemistry and intravital imaging of lungs (Fig. 4g,h). The reduction of lung metastasis by DNase I treatment further supports the idea that ERK‐mediated NETosis makes a major contribution to the lung metastasis of 4T1 cells (Fig. 4f).
In conclusion, the present work has shown that the intravital imaging of FRET mice is a powerful method to examine the interaction between host and tumor cells. This approach could also be used to examine the effect of antitumor therapy in environments closely resembling those in human patients or using patient‐derived xenografts.
Disclosure Statement
The authors have no conflict of interest.
Abbreviations
- FRET
Förster resonance energy transfer
- iRFP
near‐infrared fluorescent protein
- Ly6G
mouse lymphocyte antigen 6 complex locus G6D
- Gr‐1
granulocyte‐differentiation antigen‐1
- MDSC
myeloid‐derived suppressor cell
- NET
neutrophil extracellular trap
- OPN
osteopontin
- PMN
polymorphonuclear cell
- rOPN
recombinant osteopontin
- scr
scramble control
Supporting information
Fig. S1. Representative two‐photon image of mouse lung.
Fig. S2. Quantification of area of polymorphonuclear cells (PMNs) and activated PMNs in Figure 1(f).
Fig. S3. Polymorphonuclear cell (PMN) accumulation, ERK phosphorylation, and osteopontin (OPN) deposition in lungs after tumor inoculation.
Fig. S4. Cytokines detected from conditioned medium of 4T1 cell culture.
Fig. S5. Quantification of ERK activity from the proximity of tumor emboli to the distant area.
Fig. S6. Statistical analysis of osteopontin (OPN)‐dependent polymorphonuclear cell (PMN) activation in Figure 3.
Fig. S7. Polymorphonuclear cell (PMN) areas in the lungs of mice inoculated with scramble shRNA (scr)‐expressing tumor cells or sh870‐expressing tumor cells.
Fig. S8. ERK activation in polymorphonuclear cells (PMN) is required for osteopontin (OPN)‐mediated metastasis.
Fig. S9. ERK activation in polymorphonuclear cells (PMNs) after i.v. injection of tumor cells.
Fig. S10. Osteopontin (OPN)‐mediated ERK activation in polymorphonuclear cells (PMNs).
Table S1. Nucleotides inserted into pLKO.1‐TRC for depleting murine osteopontin (OPN) and murine CD44.
Table S2. Osteopontin (OPN) receptors in polymorphonuclear cells (PMNs) reported in published works.
Table S3. Osteopontin (OPN) receptors in polymorphonuclear cells (PMNs) in the database.
Movie S1. Movie corresponding to Figure 1(f). Bone marrow cells of a Förster resonance energy transfer (FRET) mouse for ERK were transferred to a recipient BALB/c mouse. One month after bone marrow transplantation, 4T1 cells were inoculated at the footpad. The lung was observed on the day of tumor cell inoculation (day 0) and on day 7. Yellow fluorescent protein images (left) and FRET/cyan fluorescent protein images for ERK activity (right) are shown. Of note, ERK activation is observed in some polymorphonuclear cells (arrowheads).
Movie S2. Movie corresponding to Figure 3(b). Bone marrow cells of a Förster resonance energy transfer (FRET) mouse for ERK were transplanted to host BALB/c mice. After 1 month, the mice received 4T1 cells expressing scramble shRNA (scr) at the footpad. Two weeks after inoculation of 4T1 cells, the mice were injected i.v. with tdTomato‐labeled scr‐expressing 4T1 cells and observed with a two‐photon excitation microscope. Upper panels show polymorphonuclear cells (cyan fluorescent protein [CFP], shown in green) and tumor cells (tdTomato, shown in magenta). Lower panels show ERK activity (FRET/CFP ratio image), with the Intensity Modulated Display (IMD) mode.
Movie S3. Movie corresponding to Figure 3(c). Bone marrow cells of a Förster resonance energy transfer (FRET) mouse for ERK were transplanted to host BALB/c mice. After 1 month, the mice received 4T1 cells expressing an shRNA against osteopontin (sh870) at the footpad. Two weeks after the inoculation of 4T1 cells, the mice were injected i.v. with tdTomato‐labeled sh870‐expressing 4T1 cells and observed with a two‐photon excitation microscope. Lower panels show ERK activity (FRET/cyan fluorescent protein ratio image), with Intensity Modulated Display (IMD) mode.
Movie S4. Movie corresponding to Figure S8(a). Bone marrow cells of a Förster resonance energy transfer (FRET) mouse for ERK were transplanted to a host BALB/c mouse. After 1 month, the mouse received 4T1 cells expressing scramble shRNA (scr) at the footpad. Two weeks after inoculation of 4T1 cells, mice were observed with a two‐photon excitation microscope. The tumor‐bearing mouse was injected i.v. with 4T1 cells expressing scr and tdTomato red fluorescent protein at time zero. After 13 min, MEK inhibitor (PD0325901, 200 μg in 200 μL PBS) was injected i.v. with 3 μL Qtracker 655 as a vasculature marker. Right panels show polymorphonuclear cells (cyan fluorescent protein [CFP], shown in green) and tumor cells (tdTomato, shown in magenta). Left panels show ERK activity (FRET/CFP ratio image range 1.0–2.0).
Movie S5. Movie corresponding to Figure S10. Bone marrow cells of a Förster resonance energy transfer (FRET) mouse for ERK were transplanted to host BALB/c mouse (6 × 10⁶/mouse). After 1 month, the mouse received 4T1 cells expressing shRNA against osteopontin (OPN) (sh870) at the footpad (1 × 10⁶/mouse). Two weeks later, the mouse was observed with a two‐photon excitation microscope. Recombinant OPN protein (rOPN, 8.4 μg/mouse) and vasculature marker Qtracker 655 (0.03 μM) were injected i.v. into the tumor‐bearing mouse at time zero (right image). Arrowheads indicate aggregations of polymorphonuclear cells with high ERK activity (left image).
Acknowledgments
We are grateful to Eiji Nakasho (Olympus) for technical advice on the custom‐made vacuum‐stabilized imaging window, Tsuyoshi Akagi for the provision of pCX4 lentivirus vectors, Kosuke Yusa for the provision of piggyBac vectors, the members of the Matsuda Laboratory for their helpful input, Y. Inaoka, K. Hirano, and A. Kawagishi for their technical assistance, the Medical Research Support Center of Kyoto University for intravital imaging and the Center for Anatomical, Pathological and Forensic Medical Researches of Kyoto University for immunohistochemistry. This work was supported by the Innovative Techno‐Hub for Integrated Medical Bio‐imaging Project of the Special Coordination Funds for Promoting Science and Technology, by Japan Society for the Promotion of Science Kakenhi Grants‐in‐Aid for Young Scientists (B) (nos. 23701053 and 26830070), by the Platform Project for Supporting Drug Discovery and Life Science Research (Platform for Dynamic Approaches to Living System) of the Ministry of Education, Culture, Sports, and Science of Japan, and by the Japan Agency for Medical Research and Development.
Cancer Sci 108 (2017) 226–235
Funding Information
Special Coordination Funds for Promoting Science and Technology; Japan Society for the Promotion of Science; Ministry of Education, Culture, Sports, and Science of Japan; Japan Agency for Medical Research and Development.
References
- 1. McAllister SS, Weinberg RA. The tumour‐induced systemic environment as a critical regulator of cancer progression and metastasis. Nat Cell Biol 2014; 16: 717–27. [DOI] [PMC free article] [PubMed] [Google Scholar]
- 2. Cortez‐Retamozo V, Etzrodt M, Newton A et al Origins of tumor‐associated macrophages and neutrophils. Proc Natl Acad Sci U S A 2012; 109: 2491–6. [DOI] [PMC free article] [PubMed] [Google Scholar]
- 3. Talmadge JE, Gabrilovich DI. History of myeloid‐derived suppressor cells. Nat Rev Cancer 2013; 13: 739–52. [DOI] [PMC free article] [PubMed] [Google Scholar]
- 4. Heppner GH, Miller FR, Shekhar PM. Nontransgenic models of breast cancer. Breast Cancer Res 2000; 2: 331–4. [DOI] [PMC free article] [PubMed] [Google Scholar]
- 5. Kowanetz M, Wu X, Lee J et al Granulocyte‐colony stimulating factor promotes lung metastasis through mobilization of Ly6G+Ly6C+ granulocytes. Proc Natl Acad Sci U S A 2010; 107: 21248–55. [DOI] [PMC free article] [PubMed] [Google Scholar]
- 6. Yoshimura T, Howard OM, Ito T et al Monocyte chemoattractant protein‐1/CCL2 produced by stromal cells promotes lung metastasis of 4T1 murine breast cancer cells. PLoS ONE 2013; 8: e58791. [DOI] [PMC free article] [PubMed] [Google Scholar]
- 7. Eckhardt BL, Parker BS, van Laar RK et al Genomic analysis of a spontaneous model of breast cancer metastasis to bone reveals a role for the extracellular matrix. Mol Cancer Res 2005; 3: 1–13. [PubMed] [Google Scholar]
- 8. Shevde LA, Samant RS. Role of osteopontin in the pathophysiology of cancer. Matrix Biol 2014; 37: 131–41. [DOI] [PMC free article] [PubMed] [Google Scholar]
- 9. Rangaswami H, Bulbule A, Kundu GC. Osteopontin: role in cell signaling and cancer progression. Trends Cell Biol 2006; 16: 79–87. [DOI] [PubMed] [Google Scholar]
- 10. McAllister SS, Gifford AM, Greiner AL et al Systemic endocrine instigation of indolent tumor growth requires osteopontin. Cell 2008; 133: 994–1005. [DOI] [PMC free article] [PubMed] [Google Scholar]
- 11. Fein MR, Egeblad M. Caught in the act: revealing the metastatic process by live imaging. Dis Model Mech 2013; 6: 580–93. [DOI] [PMC free article] [PubMed] [Google Scholar]
- 12. Lelkes E, Headley MB, Thornton EE, Looney MR, Krummel MF. The spatiotemporal cellular dynamics of lung immunity. Trends Immunol 2014; 35: 379–86. [DOI] [PMC free article] [PubMed] [Google Scholar]
- 13. Looney MR, Thornton EE, Sen D, Lamm WJ, Glenny RW, Krummel MF. Stabilized imaging of immune surveillance in the mouse lung. Nat Methods 2011; 8: 91–6. [DOI] [PMC free article] [PubMed] [Google Scholar]
- 14. Entenberg D, Rodriguez‐Tirado C, Kato Y, Kitamura T, Pollard JW, Condeelis J. Subcellular resolution optical imaging in the lung reveals early metastatic proliferation and motility. Intravital 2015; 4: pii: e1086613. [DOI] [PMC free article] [PubMed] [Google Scholar]
- 15. Headley MB, Bins A, Nip A et al Visualization of immediate immune responses to pioneer metastatic cells in the lung. Nature 2016; 531: 513–7. [DOI] [PMC free article] [PubMed] [Google Scholar]
- 16. Nobis M, McGhee EJ, Morton JP et al Intravital FLIM‐FRET imaging reveals dasatinib‐induced spatial control of src in pancreatic cancer. Cancer Res 2013; 73: 4674–86. [DOI] [PubMed] [Google Scholar]
- 17. Hirata E, Girotti MR, Viros A et al Intravital imaging reveals how BRAF inhibition generates drug‐tolerant microenvironments with high integrin beta1/FAK signaling. Cancer Cell 2015; 27: 574–88. [DOI] [PMC free article] [PubMed] [Google Scholar]
- 18. Takaoka S, Kamioka Y, Takakura K et al Live imaging of TAK1 activation in Lewis lung carcinoma 3LL cells implanted into syngeneic mice and treated with polyI:C. Cancer Sci 2016; 107: 644–52. [DOI] [PMC free article] [PubMed] [Google Scholar]
- 19. Mizuno R, Kamioka Y, Kabashima K et al In vivo imaging reveals PKA regulation of ERK activity during neutrophil recruitment to inflamed intestines. J Exp Med 2014; 211: 1123–36. [DOI] [PMC free article] [PubMed] [Google Scholar]
- 20. Akagi T, Sasai K, Hanafusa H. Refractory nature of normal human diploid fibroblasts with respect to oncogene‐mediated transformation. Proc Natl Acad Sci U S A 2003; 100: 13567–72. [DOI] [PMC free article] [PubMed] [Google Scholar]
- 21. Yusa K, Rad R, Takeda J, Bradley A. Generation of transgene‐free induced pluripotent mouse stem cells by the piggyBac transposon. Nat Methods 2009; 6: 363–9. [DOI] [PMC free article] [PubMed] [Google Scholar]
- 22. Kamioka Y, Sumiyama K, Mizuno R et al Live imaging of protein kinase activities in transgenic mice expressing FRET biosensors. Cell Struct Funct 2012; 37: 65–73. [DOI] [PubMed] [Google Scholar]
- 23. Matilainen H, Yu XW, Tang CW, Berridge MV, McConnell MJ. Sphere formation reverses the metastatic and cancer stem cell phenotype of the murine mammary tumour 4T1, independently of the putative cancer stem cell marker Sca‐1. Cancer Lett 2012; 323: 20–8. [DOI] [PubMed] [Google Scholar]
- 24. An H, Kim JY, Oh E, Lee N, Cho Y, Seo JH. Salinomycin promotes anoikis and decreases the CD44+/CD24− stem‐like population via inhibition of STAT3 activation in MDA‐MB‐231 cells. PLoS ONE 2015; 10: e0141919. [DOI] [PMC free article] [PubMed] [Google Scholar]
- 25. Lin P, Buxton JA, Acheson A et al Antiangiogenic gene therapy targeting the endothelium‐specific receptor tyrosine kinase Tie2. Proc Natl Acad Sci U S A 1998; 95: 8829–34. [DOI] [PMC free article] [PubMed] [Google Scholar]
- 26. Elkabets M, Ribeiro VS, Dinarello CA et al IL‐1beta regulates a novel myeloid‐derived suppressor cell subset that impairs NK cell development and function. Eur J Immunol 2010; 40: 3347–57. [DOI] [PMC free article] [PubMed] [Google Scholar]
- 27. Duran‐Struuck R, Dysko RC. Principles of bone marrow transplantation (BMT): providing optimal veterinary and husbandry care to irradiated mice in BMT studies. J Am Assoc Lab Anim Sci 2009; 48: 11–22. [PMC free article] [PubMed] [Google Scholar]
- 28. Tuck AB, Chambers AF, Allan AL. Osteopontin overexpression in breast cancer: knowledge gained and possible implications for clinical management. J Cell Biochem 2007; 102: 859–68. [DOI] [PubMed] [Google Scholar]
- 29. He B, Mirza M, Weber GF. An osteopontin splice variant induces anchorage independence in human breast cancer cells. Oncogene 2006; 25: 2192–202. [DOI] [PubMed] [Google Scholar]
- 30. Hsieh YH, van der Heyde H, Oh ES, Guan JL, Chang PL. Osteopontin mediates tumorigenic transformation of a preneoplastic murine cell line by suppressing anoikis: an Arg‐Gly‐Asp‐dependent‐focal adhesion kinase‐caspase‐8 axis. Mol Carcinog 2015; 54: 379–92. [DOI] [PubMed] [Google Scholar]
- 31. Cools‐Lartigue J, Spicer J, McDonald B et al Neutrophil extracellular traps sequester circulating tumor cells and promote metastasis. J Clin Invest 2013; 123: 3446–58. [DOI] [PMC free article] [PubMed] [Google Scholar]
- 32. Cools‐Lartigue J, Spicer J, Najmeh S, Ferri L. Neutrophil extracellular traps in cancer progression. Cell Mol Life Sci 2014; 71: 4179–94. [DOI] [PMC free article] [PubMed] [Google Scholar]
- 33. Pang L, Hayes CP, Buac K, Yoo DG, Rada B. Pseudogout‐associated inflammatory calcium pyrophosphate dihydrate microcrystals induce formation of neutrophil extracellular traps. J Immunol 2013; 190: 6488–500. [DOI] [PubMed] [Google Scholar]
- 34. DeSouza‐Vieira T, Guimaraes‐Costa A, Rochael NC et al Neutrophil extracellular traps release induced by Leishmania: role of PI3Kgamma, ERK, PI3Ksigma, PKC, and [Ca2+]. J Leukoc Biol 2016; 100: 801–10. [DOI] [PMC free article] [PubMed] [Google Scholar]
- 35. Hakkim A, Fuchs TA, Martinez NE et al Activation of the Raf‐MEK‐ERK pathway is required for neutrophil extracellular trap formation. Nat Chem Biol 2011; 7: 75–7. [DOI] [PubMed] [Google Scholar]
Associated Data
This section collects any data citations, data availability statements, or supplementary materials included in this article.
Supplementary Materials
Fig. S1. Representative two‐photon image of mouse lung.
Fig. S2. Quantification of area of polymorphonuclear cells (PMNs) and activated PMNs in Figure 1(f).
Fig. S3. Polymorphonuclear cell (PMN) accumulation, ERK phosphorylation, and osteopontin (OPN) deposition in lungs after tumor inoculation.
Fig. S4. Cytokines detected from conditioned medium of 4T1 cell culture.
Fig. S5. Quantification of ERK activity from the proximity of tumor emboli to the distant area.
Fig. S6. Statistical analysis of osteopontin (OPN)‐dependent polymorphonuclear cell (PMN) activation in Figure 3.
Fig. S7. Polymorphonuclear cell (PMN) areas in the lungs of mice inoculated with scramble shRNA (scr)‐expressing tumor cells or sh870‐expressing tumor cells.
Fig. S8. ERK activation in polymorphonuclear cells (PMN) is required for osteopontin (OPN)‐mediated metastasis.
Fig. S9. ERK activation in polymorphonuclear cells (PMNs) after i.v. injection of tumor cells.
Fig. S10. Osteopontin (OPN)‐mediated ERK activation in polymorphonuclear cells (PMNs).
Table S1. Nucleotides inserted into pLKO.1‐TRC for depleting murine osteopontin (OPN) and murine CD44.
Table S2. Osteopontin (OPN) receptors in polymorphonuclear cells (PMNs) reported in published works.
Table S3. Osteopontin (OPN) receptors in polymorphonuclear cells (PMNs) in the database.
Movie S1. Movie corresponding to Figure 1(f). Bone marrow cells of a Förster resonance energy transfer (FRET) mouse for ERK were transferred to a recipient BALB/c mouse. One month after bone marrow transplantation, 4T1 cells were inoculated at the footpad. The lung was observed on the day of tumor cell inoculation (day 0) and on day 7. Yellow fluorescent protein images (left) and FRET/cyan fluorescent protein images for ERK activity (right) are shown. Of note, ERK activation is observed in some polymorphonuclear cells (arrowheads).
Movie S2. Movie corresponding to Figure 3(b). Bone marrow cells of a Förster resonance energy transfer (FRET) mouse for ERK were transplanted to host BALB/c mice. After 1 month, the mice received 4T1 cells expressing scramble shRNA (scr) at the footpad. Two weeks after inoculation of 4T1 cells, the mice were injected i.v. with tdTomato‐labeled scr‐expressing 4T1 cells and observed with a two‐photon excitation microscope. Upper panels show polymorphonuclear cells (cyan fluorescent protein [CFP], shown in green) and tumor cells (tdTomato, shown in magenta). Lower panels show ERK activity (FRET/CFP ratio image), with the Intensity Modulated Display (IMD) mode.
Movie S3. Movie corresponding to Figure 3(c). Bone marrow cells of a Förster resonance energy transfer (FRET) mouse for ERK were transplanted to host BALB/c mice. After 1 month, the mice received 4T1 cells expressing an shRNA against osteopontin (sh870) at the footpad. Two weeks after the inoculation of 4T1 cells, the mice were injected i.v. with tdTomato‐labeled sh870‐expressing 4T1 cells and observed with a two‐photon excitation microscope. Lower panels show ERK activity (FRET/cyan fluorescent protein ratio image), with Intensity Modulated Display (IMD) mode.
Movie S4. Movie corresponding to Figure S8(a). Bone marrow cells of a Förster resonance energy transfer (FRET) mouse for ERK were transplanted to a host BALB/c mouse. After 1 month, the mouse received 4T1 cells expressing scramble shRNA (scr) at the footpad. Two weeks after inoculation of 4T1 cells, mice were observed with a two‐photon excitation microscope. The tumor‐bearing mouse was injected i.v. with 4T1 cells expressing scr and tdTomato red fluorescent protein at time zero. After 13 min, MEK inhibitor (PD0325901, 200 μg in 200 μL PBS) was injected i.v. with 3 μL Qtracker 655 as a vasculature marker. Right panels show polymorphonuclear cells (cyan fluorescent protein [CFP], shown in green) and tumor cells (tdTomato, shown in magenta). Left panels show ERK activity (FRET/CFP ratio image range 1.0–2.0).
Movie S5. Movie corresponding to Figure S10. Bone marrow cells of a Förster resonance energy transfer (FRET) mouse for ERK were transplanted to host BALB/c mouse (6 × 10⁶/mouse). After 1 month, the mouse received 4T1 cells expressing shRNA against osteopontin (OPN) (sh870) at the footpad (1 × 10⁶/mouse). Two weeks later, the mouse was observed with a two‐photon excitation microscope. Recombinant OPN protein (rOPN, 8.4 μg/mouse) and vasculature marker Qtracker 655 (0.03 μM) were injected i.v. into the tumor‐bearing mouse at time zero (right image). Arrowheads indicate aggregations of polymorphonuclear cells with high ERK activity (left image).