

Abstract
Purpose
Based on available phase III trial data, we performed a cost-effectiveness analysis of different treatment strategies that can be used in patients with newly diagnosed HER2-positive metastatic breast cancer (mBC).
Patients and Methods
We constructed a Markov model to assess the cost-effectiveness of four different HER2 targeted treatment sequences in patients with HER2-positive mBC treated in the U.S. The model followed patients weekly over their remaining life expectancies. Health states considered were progression free survival (PFS) 1st to 3rd lines, and death. Transitional probabilities were based on published phase III trials. Cost data (2015 US dollars) was captured from the U.S. Centers for Medicare and Medicaid Services (CMS) drug payment table and physician fee schedule. Health utility data were extracted from published studies. The outcomes considered were PFS, OS, costs, QALYs, the incremental cost per QALY gained ratio, and the net monetary benefit. Deterministic and probabilistic sensitivity analyses assessed the uncertainty around key model parameters and their joint impact on the base-case results.
Results
The combination of trastuzumab, pertuzumab, and docetaxel (THP) as first-line therapy, trastuzumab emtansine (T-DM1) as second-line therapy, and lapatinib/capecitabine third-line resulted in 1.81 QALYs, at a cost of $335,231.35. The combination of trastuzumab/docetaxel as first line without subsequent T-DM1 or pertuzumab yielded 1.41 QALYs, at a cost of $175,240.69. The least clinically effective sequence (1.27 QALYs), but most cost-effective at a total cost of $149,250.19, was trastuzumab/docetaxel as first-line therapy, T-DM1 as second-line therapy, and trastuzumab/lapatinib as third line therapy.
Conclusion
Our results suggest that THP as first-line therapy, followed by T-DM1 as second-line therapy, would require at least a 50% reduction in the total drug acquisition cost for it to be considered a cost-effective strategy.
Keywords: cost-effectiveness analysis, breast cancer, Markov, HER2-positive, metastatic breast cancer, Trastuzumab, sequential therapy, pertuzumab, lapatinib, T-DM1
INTRODUCTION
Treatment of human epithelial growth factor receptor 2 (HER2)-positive breast cancer, which accounts for 20–25% of all breast cancer patients, has rapidly evolved over the last decade [1, 2]. The clarification of the signaling pathway activated by HER2 and its impact on the formation of breast cancer, followed by the clinical development of effective HER2 targeted agents, have tremendously advanced the field of oncology. Since the initial approval of trastuzumab by the US Food and Drug Administration (FDA) in 1998, three other HER2 directed agents have been approved and have provided varying degrees of therapeutic benefit [3]. Lapatinib, a dual tyrosine kinase inhibitor that interrupts the HER2 and epidermal growth factor receptor (EGFR) pathways, in combination with capecitabine, received an FDA indication in 2007 for the treatment of HER2-positive mBC after progression on prior therapies [4]. The monoclonal HER2 directed antibody pertuzumab, when used in combination with docetaxel and trastuzumab, was approved in 2012 as 1st line therapy for HER2-positive metastatic breast cancer (mBC). The HER2 directed antibody-chemotherapy drug conjugate trastuzumab emtansine (T-DM1) received FDA approval in 2013 for treatment of HER2-positive mBC after progression with trastuzumab and a taxane.
HER2 targeting agents have had a dramatic impact on the natural history of HER2-positive mBC, as evidenced by a dramatic improvement in median OS—from 25 months with chemotherapy plus trastuzumab reported in 2001 by Slamon et al. to 56 months in the CLEOPATRA trial [5, 6]. Despite an unprecedented improvement in OS, HER2-positive mBC is still considered incurable in the vast majority of patients.
Based on recent phase III data, a consensus has emerged regarding the optimal initial sequencing strategy of HER2 targeted agents for HER2-positive mBC, which is reflected in recently published guidelines from American Society of Clinical Oncology (ASCO) and the National Comprehensive Cancer Network (NCCN) [7]. For patients with newly diagnosed advanced HER2-positive breast cancer, and candidates for combination chemotherapy, the combination of trastuzumab, pertuzumab, and docetaxel (THP) is recommended as the preferred initial treatment followed by trastuzumab emtansine (T-DM1) upon first disease progression [3].
For third line therapy, despite gaps in our current knowledge, most physicians favor lapatinib in combination with either capecitabine or trastuzumab [3]. As these agents are not used in a mutually exclusive fashion, practitioners in the U.S. have multiple treatment sequencing options to from which to choose. Traditionally, cost-effectiveness studies have evaluated one treatment line versus another, whereas in clinical practice, patients are often treated in a sequential fashion. A recent study, although failing to account for the sequential treatment, estimated that the addition of pertuzumab to docetaxel and trastuzumab as first-line treatment for HER2-positive mBC has a cost of $713,219 per QALY gained [8].
Although the optimal sequence of first, second [and likely third] line HER2 therapies to date seems clear from a clinical standpoint, their optimal treatment sequence from a pharmacoeconomic standpoint remains uncertain. Hence, we evaluated the cost-effectiveness of first-line THP, followed by second-line T-DM1, and third-line lapatinib/capecitabine in women with newly diagnosed HER2-positive mBC compared to other possible sequencing strategies.
Patients and Methods
Patients and Interventions
Patients in our study were assumed to be similar to patients enrolled in the randomized phase III CLEOPATRA and EMILIA trials and were candidates to receive cytotoxic chemotherapy in combination with HER2 targeted therapy [9, 10]. HER2-positive/ER-positive is a minority of the HER2-positive subset of patients and our model was not aimed at sequencing endocrine therapy in this subset.
Due to the availability of different HER2 targeted agents, which can also be combined with several different cytotoxic chemotherapeutic drugs, there are several possible treatment sequences that can be given as first through third line therapy. Published phase III trials and the recent ASCO consensus guidelines [3] were considered to identify the potential treatment sequences for HER2-positive mBC. The following treatment sequences were derived:
Sequence 1 (optimal clinical sequence). 1st line: pertuzumab plus trastuzumab plus docetaxel [THP]; [9] 2nd line: T-DM1; [10] 3rd line: capecitabine plus lapatinib [4] (THP → T-DM1 → Cape/Lapat).
Sequence 2 (pertuzumab, no T-DM1). 1st line: THP [9] ; 2nd line: trastuzumab plus lapatinib [11] ; 3rd line: trastuzumab plus capecitabine [12] (THP → Trastuz/Lapat → Trastuz/Cape).
Sequence 3 (T-DM1, no pertuzumab). 1st line: trastuzumab plus docetaxel [9]; 2nd line: T-DM1 [10]; 3rd line: trastuzumab plus lapatinib [11] (Trastuz/Docet → T-DM1 → Trastuz/Lapat).
Sequence 4 (No T-DM1 or pertuzumab). 1st line: trastuzumab plus docetaxel [9]; 2nd line: trastuzumab plus lapatinib [11]; 3rd line: trastuzumab plus capecitabine [12] (Trastuz/Docet → Trastuz/Lapat → Trastuz/Cape).
Decision-analytic model overview
We developed a Markov model using TreeAge Pro 2016 (TreeAge Software Inc., Williamstown, MA, USA). This model was used to assess the cost-effectiveness of four different HER2 targeted treatment sequences in US patients with HER2-positive mBC, from a U.S Centers for Medicaid and Medicare Services (CMS) perspective. The health states were PFS 1st line, PFS 2nd line, PFS 3rd line, and death.
The analysis was conducted over the remaining life expectancy of patients. A one-week cycle was set to match the patient assessment time interval used in most clinical trials. At disease progression patients were assumed to move to the next therapy in the treatment sequence.
Patients entered the model once they were considered eligible to initiate treatment (Fig. 1). At that point, all patients were in the PFS 1st line with no adverse events state and transitioned to the other health states based upon transition probabilities. Patients who experienced disease progression (with and without grade 3 or 4 adverse events; sAEs) and those who did not progress, but develop sAEs, moved to the next line treatment of the corresponding sequence. If all treatments in the sequence failed to maintain patients in the PFS state, we assumed that palliative care was initiated for a period of 3 months, with patients ultimately dying upon completion [13].
Fig. 1.
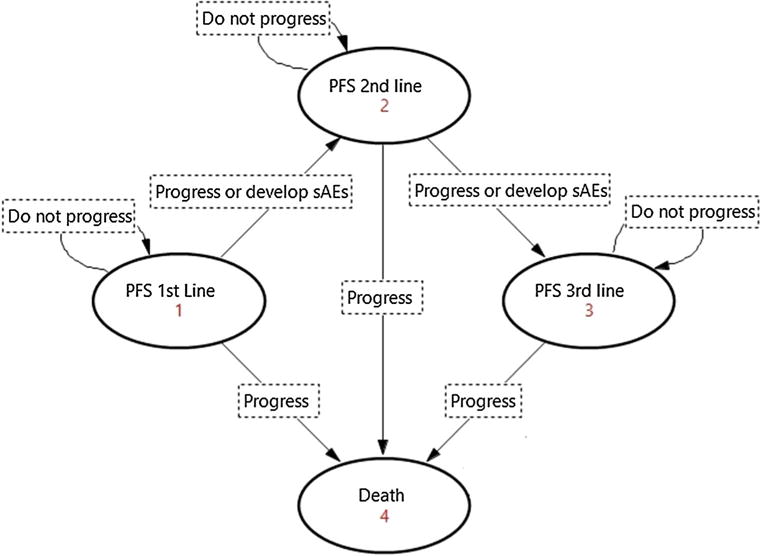
Markov state transition diagram. The Markov model simulated a hypothetical cohort of HER2-positive metastatic breast cancer patients, eligible to receive 1st through 3rd line sequential targeted therapy. The model considered four health states (presented by order of occurrence): progression free while receiving first-line therapy (PFS 1st line), progression free while receiving second line therapy (PFS 2nd line), progression free while receiving third line therapy (PFS 3rd line), and death. Patients would move from one state to another upon disease progression or experience of serious adverse events (sAEs), until they die
The outcomes of interest were PFS, OS, costs (in 2015 US dollars), QALYs, the incremental cost per QALY gained ratio, and the net monetary benefit (NMB) [14]. Benchmark willingness-to-pay (WTP) thresholds [15–18] ($50,000 per QALY, $100,000 per QALY, $150,000 per QALY, and $200,000 per QALY) were used to establish the cost-effectiveness of the treatment sequences.
Model input parameters
Transition probabilities
The estimation of transition probabilities consisted of two steps: 1) individual patient data (IPD) reconstruction from published PFS and OS Kaplan–Meier (KM) curves, [4, 9–12, 19] and 2) survival modeling for the estimation of transition probabilities in model-based economic evaluations in the absence of IPD.
WebPlotDigitizer® (Version 3.4; Ankit Rohatgi, Austin, TX) was used to extract the coordinates of the PFS and OS KM curves, which were further used to reconstruct IPD for OS and PFS [20, 21]. Then, standard parametric distributions (exponential, Weibull, Gompertz, lognormal, and log-logistic) were tested for goodness-of-fit to the reconstructed IPD using graphical (Cox-Snell residuals) and analytical tests [Akaike Information Criterion (AIC) and Bayesian Information Criterion (BIC)]. The log-logistic distribution best fitted the OS and PFS IPD. The shape and scale of the log-logistic distributions for OS and PFS KM curves were used to estimate the transitional probability equations [21]. These equations were transformed to match the weekly cycle length considered in our model (Appendix 1 of the supplement).
Medical resource use and costs
Costs were identified according to the U.S. CMS perspective, and measured based on medical resources used (Appendix 2 of the Supplement). Costs were inflated using the Consumer Price Index (CPI) inflation calculator from the Bureau Labor of Statistics (available at http://www.bls.gov/data/inflation_calculator.htm).
Only direct medical costs were considered, and included costs associated with the acquisition of treatments [22], medical visits [23], computed tomography (CT) scans [23], echocardiograms [23], laboratory tests [24], medical management of the most common treatment-related sAEs observed in each clinical trial including the use of prophylactic granulocyte-colony stimulating factor (G-CSF) [25–27], and the costs associated with palliative end-of life care [13] (Table 1). According to expert opinion, grade 1–2 adverse events were excluded because they were assumed to not have a significant effect on costs. Additionally, accrued costs due to hospitalization were excluded since it was assumed that none of the patients on trial were hospitalized. Finally, the cost of infusion and those for chemo-related pre-medications and “PRN” medications were excluded from the analysis.
Table 1.
Input parameters for the model with ranges for sensitivity analysis
| Variable | Unit | Value (range or 95% CI) | Assumptions | Reference | Distribution |
|---|---|---|---|---|---|
| Medical Visit ($) | |||||
| Physician fees | Every 3 weeks | 160.56 (120.42; 200.7) | Appendix 2-Supplement | CMS23 | Gamma |
| Acquisition cost of treatments ($) | |||||
| Loading dose pertuzumab (840 mg) | First week of treatment only | 8,580.60 (4290.3; 12870.9) | Appendix 2-Supplement | Medicare part B drug ASP22 | Gamma |
| Maintenance dose pertuzumab (420 mg) | Every 3 weeks starting from week 4 | 4,290.30 (2145.15; 6435.45) | Appendix 2-Supplement | Medicare part B drug ASP22 | Gamma |
| Loading dose trastuzumab (8 mg/kg) | First week of treatment only | 4,892.10 (2446.05; 7338.15) | Appendix 2-Supplement | Medicare part B drug ASP22 | Gamma |
| Maintenance dose trastuzumab (6 mg/kg) | Every 3 weeks starting from week 4 | 3,669.08 (1834.54; 5503.62) | Appendix 2-Supplement | Medicare part B drug ASP22 | Gamma |
| Docetaxel (1 mg) | Every 3 weeks for 6 cycles | 467.99 (233.995; 701.985) | Appendix 2-Supplement | Medicare part B drug ASP22 | Gamma |
| Pegfilgrastim (6 mg) | Every 3 weeks for 6 cycles | 3,772.79 (1886.39; 5659.18) | Appendix 2-Supplement | Medicare part B drug ASP22 | Gamma |
| TDM1 | Every 3 weeks | 7,361.42 (3680.7; 11042.14) | Appendix 2-Supplement | Medicare part B drug ASP22 | Gamma |
| Capecitabine (500 mg) | Assuming 2 weeks of treatment per cycle + 1 week rest | 955.50 (477.75; 1433.25) | Appendix 2-Supplement | Medicare part B drug ASP22 | Gamma |
| Lapatinib (1,500 mg daily) | Weekly | 1,434.58 (717.29; 2151.87) | Appendix 2-Supplement | Medicare part B drug ASP22 | Gamma |
| Management of Adverse Events (grade 3–4) ($) | |||||
| THP | 1 time | 6297.23 (3183.7; 14695.07) | Appendix 2-Supplement | Niraula et al[25] | Gamma |
| Trastuzumab plus docetaxel | 1 time | 4512.4 (2291.29; 10943.88) | Appendix 2-Supplement | Niraula et al[25] | Gamma |
| T-DM1 | 1 time | 2230.27 (1108.57; 4394.94) | Appendix 2-Supplement | Niraula et al[25] | Gamma |
| Lapatinib plus capecitabine | 1 time | 571.35 (282.42; 1146.26) | Appendix 2-Supplement | Niraula et al[25] | Gamma |
| Trastuzumab plus lapatinib | 1 time | 305.61 (150.91; 588.39) | Appendix 2-Supplement | Niraula et al[25]; Sharpe[27] | Gamma |
| Trastuzumab plus capecitabine | 1 time | 1052.97 (494.64; 1878.49) | Appendix 2-Supplement | Niraula et al[25]; Garrison L et al[26] | Gamma |
| Computed tomography (CT) scan ($) | Every 9 weeks | 753.74 (565.305; 942.175) | Appendix 2-Supplement | CMS[23] | Gamma |
| Laboratory Tests ($) | |||||
| Blood test | Every 3 weeks | 33.83 (25.37; 42.29) | Appendix 2-Supplement | Schilling et al[24] | Gamma |
| Echocardiogram | Every 13 weeks | 251.25 (188.44; 314.06) | Appendix 2-Supplement | CMS[25] | Gamma |
| Palliative care/End of life ($) | 1 time | 8195.63 (4097.82; 12293.45) | Palliative care patients live on average about 3 months ($30,148×0.25) | Sorensen et al[13] | Gamma |
| Utility | |||||
| Progression free | 0.786 (0.484; 0.935) | Appendix 3-Supplement | Lloyd et al[28] | Beta | |
| Treatment response | 0.061 (0.025; 0.074) | Appendix 3-Supplement | Lloyd et al[28] | Beta | |
| Utility decrement associated with disease progression and adverse events due to treatments | |||||
| Disease progression | 0.248 (0.087–0.289) | Appendix 3-Supplement | Lloyd et al[28] | Beta | |
| THP | 0.056 (0.016–0.098) | Appendix 3-Supplement | Lloyd et al[28]; Attard et al[29] | Beta | |
| Trastuzumab plus docetaxel | 0.040 (0.011–0.058) | Appendix 3-Supplement | Lloyd et al[28]; Attard et al[29] | Beta | |
| T-DM1 | 0.009 (0.002–0.012) | Appendix 3-Supplement | Attard et al[29] | Beta | |
| Lapatinib plus capecitabine | 0.018 (0.004–0.032) | Appendix 3-Supplement | Lloyd et al[28] | Beta | |
| Tastuzumab plus lapatinib | 0.017 (0.004–0.026) | Appendix 3-Supplement | Lloyd et al[28]; Attard et al[29] | Beta | |
| Trastuzumab plus capecitabine | 0.040 (0.009–0.075) | Appendix 3-Supplement | Lloyd et al[28]; Attard et al[29] | Beta | |
| Shape and Scale Parameters | |||||
| γ THP | 0.544 (0.460–0.642) | Regression | Gamma | ||
| γ trastuzumab plus docetaxel | 0.577 (0.501–0.663) | Regression | Gamma | ||
| γ T-DM1 | 0.474 (0.414–0.543) | Regression | Gamma | ||
| γ lapatinib plus capecitabine | 0.465 (0.357–0.606) | Regression | Gamma | ||
| γ trastuzumab plus lapatinib | 0.588 (0.468–0.740) | Regression | Gamma | ||
| γ Lapatinib plus capecitabine | 0.451 (0.338–0.602) | Regression | Gamma | ||
| λ THP | 0.019 (0.016–0.023) | Regression | Gamma | ||
| λ Trastuzumab plus docetaxel | 0.025 (0.022–0.028) | Regression | Gamma | ||
| λ T-DM1 | 0.033 (0.029–0.036) | Regression | Gamma | ||
| λ Lapatinib plus capecitabine | 0.016 (0.013–0.020) | Regression | Gamma | ||
| λ Trastuzumab plus lapatinib | 0.019 (0.015–0.024) | Regression | Gamma | ||
| λ Lapatinib plus capecitabine | 0.041 (0.033–0.051) | Regression | Gamma | ||
| γ THP | 0.622 (0.561–0.690) | Regression | Gamma | ||
| γ Trastuzumab plus docetaxel | 0.555 (0.504–0.612) | Regression | Gamma | ||
| γ T-DM1 | 0.606 (0.552–0.675) | Regression | Gamma | ||
| γ Lapatinib plus capecitabine | 0.516 (0.423–0.630) | Regression | Gamma | ||
| γ Trastuzumab plus lapatinib | 0.554 (0.481–0.638) | Regression | Gamma | ||
| γ Trastuzumab plus capecitabine | 0.508 (0.410–0.630) | Regression | Gamma | ||
| λ THP | 0.052 (0.047–0.058) | Regression | Gamma | ||
| λ Trastuzumab plus docetaxel | 0.074 (0.067–0.082) | Regression | Gamma | ||
| λ T-DM1 | 0.104 (0.093–0.117) | Regression | Gamma | ||
| λ Lapatinib plus capecitabine | 0.034 (0.028–0.041) | Regression | Gamma | ||
| λ Trastuzumab plus lapatinib | 0.082 (0.070–0.097) | Regression | Gamma | ||
| λ Trastuzumab plus capecitabine | 0.115 (0.094–0.142) | Regression | Gamma | ||
| Probability of Developing Adverse Event | |||||
| THP | 0.011 (0.006–0.017) | Trial | Swain et al[9] | Beta | |
| Trastuzumab plus docetaxel | 0.009 (0.004–0.013) | Trial | Swain et al[9] | Beta | |
| T-DM1 | 0.017 (0.009–0.026) | Trial | Verma et al[10] | Beta | |
| Lapatinib plus capecitabine | 0.045 (0.022–0.067) | Trial | Geyer, et al[19] | Beta | |
| Trastuzumab plus lapatinib | 0.008 (0.004–0.013) | Trial | Blackwel et al[11] | Beta | |
| Trastuzumab plus capecitabine | 0.025 (0.012–0.037) | Trial | von Minckwitz et al[12] | Beta | |
| Discount rate — weekly | 0.000662 (0–0.000939) | Arbitrary | Uniform |
US United States; CMS Centers for Medicare & Medicaid Services; ASP average sales price; CI Confidence interval
Original costs inflated using Consumer Price Index (CPI) inflation calculator from the Bureau Labor of Statistics, available at http://www.bls.gov/data/inflation_calculator.htm
$Original costs expressed in Swedish Krona were converted into US dollars using the current exchange rate and expressed in 2014 US dollars.
For each combination of treatments, the cost of the management of treatment-related sAEs (CMAEs) was calculated as the weighted sum of the sAEs observed among at least 5 % of patients in each trial and their associated cost.
The distributions of the most common sAEs were obtained from clinical trials [9–12, 19] while the cost associated with each sAE considered was captured from the published literature [25–27]. A one-time palliative care cost was applied to patients who experienced disease progression after third line therapy and those who discontinued third line treatment due to sAEs. All assumptions regarding the estimation of costs are presented in Appendix 2 of the supplement.
Health Utilities
Health utilities were assumed to be independent of the therapies, but dependent upon their associated sAEs, progression status, and therapy line. It was also assumed that the baseline utility of patients in the model would decrease as they progressed through lines of treatment.
Baseline utility values for various combinations of mBC states and sAEs were estimated by summing and back-transforming the parameter estimates of a mixed model with random effects on patient level used to develop predictors of utilities for these states and adverse events [28].
Similar sources [29–31] were used for the coefficients of the sAEs that were not reported in the Lloyd et al. (2006) study [28]. For each combination of treatments, disutility for adverse events was calculated as the weighted sum of the treatment-related sAEs observed among at least 5 % of patients in each trial and their associated disutilities. All assumptions regarding the estimation of health utility weights are presented in Appendix 3 of the supplement.
Discounting and half-cycle correction
All costs and utilities were discounted at a 3.5 % annual rate [32, 33], which was converted into a weekly discount rate (Appendix 2). A half-cycle correction was applied to costs and QALYs.
Sensitivity analyses
A tornado analysis was conducted to determine the key parameters affecting the ICERs of the following pairwise comparisons of treatment sequences: (1) THP → T-DM1 → Cape/Lapat vs. THP → Trastuz/Lapat → Trastuz/Cape, (2) THP → T-DM1 → Cape/Lapat vs. Trastuz/Docet → T-DM1 → Trastuz/Lapat, (3) THP → T-DM1 → Cape/Lapat vs. Trastuz/Docet → Trastuz/Lapat → Trastuz/Cape, (4) THP → Trastuz/Lapat → Trastuz/Cape vs. Trastuz/Docet → T-DM1 → Trastuz/Lapat, (5) THP → Trastuz/Lapat → Trastuz/Cape vs. Trastuz/Docet → Trastuz/Lapat → Trastuz/Cape, and (6) Trastuz/Docet → Trastuz/Lapat → Trastuz/Cape vs Trastuz/Docet → T-DM1 → Trastuz/Lapat. Each key parameter was varied according to their associated range. In the absence of data for the range of a parameter, its baseline value was varied between 25 and 50 % (Table 1).
Probabilistic sensitivity analysis (PSA) with 10,000 Monte Carlo simulations was carried-out to assess the effect of the joint model parameter uncertainty on the ICERs (Table 1). The choice of PSA distribution was made using standard statistical methods [34]. Cost-effectiveness acceptability curves (CEAC) were developed from these simulations.
Results
Base-case analysis
The efficiency frontier plot revealed that THP → Trastuz/Lapat → Trastuz/Cape was extendedly dominated by a combination of THP → T-DM1 → Cape/Lapat and Trastuz/Docet → Trastuz/Lapat → Trastuz/Cape (Fig. 2). The comparison of ICERs of the pairwise comparisons of non-dominated options suggested that THP → T-DM1 → Cape/Lapat was not cost-effective when compared to Trastuz/Docet → T-DM1 → Trastuz/Lapat, irrespective of the WTP thresholds. Trastuz/Docet → Trastuz/Lapat → Trastuz/Cape was cost-effective compared to Trastuz/Docet → T-DM1 → Trastuz/Lapat only when the WTP threshold was set at $200,000 (Table 2).
Fig. 2.
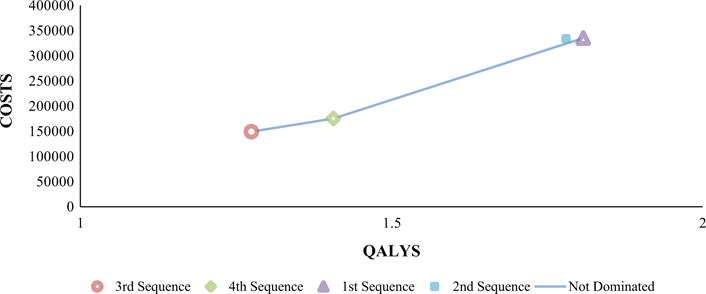
Efficiency frontier scatter plot. QALYs Quality Adjusted Life Years, Sequence 1 THP → T-DM1 → Cape/Lapat, Sequence 2 THP → Trastuz/Lapat → Trastuz/Cape, Sequence 3 Trastuz/Docet → T-DM1 → Trastuz/Lapat Sequence 4 Trastuz/Docet → Trastuz/Lapat → Trastuz/Cape
Table 2.
Results of the base-case analysis
| Strategy | Costa | Incr Cost | QALY | Incr Eff | Incr C/E | Status | NMB
|
|||
|---|---|---|---|---|---|---|---|---|---|---|
| λ = 50,000 | λ = 100,000 | λ = 150,000 | λ = 200,000 | |||||||
| All referencing common baseline | ||||||||||
| 3rd Sequence | 149,250.19 | 1.27 | Undominated | −85,519.42 | −21,788.65 | 41,942.12 | 105,672.89 | |||
| 4th Sequence | 175,240.69 | 25,990.50 | 1.41 | 0.13 | 197,012.54 | Undominated | −104,913.77 | −34,586.84 | 35,740.08 | 106,067.00 |
| 2nd Sequence | 333,797.20 | 18,4547.01 | 1.78 | 0.51 | 364,883.82 | Ext. dominated | −244,777.97 | −155,758.74 | −66,739.51 | 22,279.72 |
| 1st Sequence | 335,231.35 | 185,981.16 | 1.81 | 0.53 | 348,630.87 | Undominated | −244,827.50 | −154,423.66 | −64,019.81 | 26,384.03 |
| Excluding dominated | ||||||||||
| 3rd Sequence | 149,250.19 | 1.27 | Undominated | −855,19.42 | −217,88.65 | 419,42.12 | 105,672.89 | |||
| 4th Sequence | 175,240.69 | 25,990.50 | 1.41 | 0.13 | 197,012.54 | Undominated | −104,913.77 | −345,86.84 | 357,40.08 | 106,067.00 |
| 1st Sequence | 335,231.35 | 159,990.66 | 1.81 | 0.40 | 398,444.17 | Undominated | −244,827.50 | −154,423.66 | −640,19.81 | 26,384.03 |
All costs are expressed in 2015 US dollars; Incr Cost incremental cost, Incr Eff incremental effectiveness, Incr C/E incremental cost-effectiveness ratio, NMB net monetary benefit, λ willingness-to-pay threshold, QALY quality adjusted life years, Ext. Dominated: extended dominated; 1st Sequence – 1st line pertuzumab plus trastuzumab plus docetaxel [THP], 2nd line T-DM1, 3rd line capecitabine plus lapatinib; 2nd Sequence – 1st line THP, 2nd line trastuzumab plus lapatinib, 3rd line trastuzumab plus capecitabine; 3rd Sequence – 1st line trastuzumab plus docetaxel, 2nd line T-DM1, 3rd line trastuzumab plus lapatinib; 4th Sequence – 1st line trastuzumab plus docetaxel, 2nd line trastuzumab plus lapatinib, 3rd line trastuzumab plus capecitabine
Using the NMB approach, Trastuz/Docet → T-DM1 → Trastuz/Lapat was found to be the most cost-effective sequence, followed by Trastuz/Docet → Trastuz/Lapat → Trastuz/Cape, and finally THP → T-DM1 → Cape/Lapat.
Sensitivity analyses
The tornado sensitivity analysis did not result in major deviations from the base-case analysis (Appendix 4). The PSA showed slightly different results than the results of the base-case analysis. THP → Trastuz/Lapat → Trastuz/Cape became the most effective (1.789 QALYs) and the most expensive ($333,630.31) strategy. THP → T-DM1 → Cape/Lapat was both the second most effective and most expensive strategy (1.787 QALYs; $330,667.33), followed by Trastuz/Docet → Trastuz/Lapat → Trastuz/Cape (1.431 QALYs; $177,043.57) and Trastuz/Docet → T-DM1 → Trastuz/Lapat (1.301 QALYs; $151,977.81). Using Trastuz/Docet → T-DM1 → Trastuz/Lapat as reference, THP → T-DM1 → Cape/Lapat and THP → Trastuz/Lapat → Trastuz/Cape were not cost-effective, irrespective of the WTP thresholds. Trastuz/Docet → Trastuz/Lapat → Trastuz/Cape was cost-effective compared to Trastuz/Docet → T-DM1 → Trastuz/Lapat only when the WTP was set at $200,000. The CEAC suggests that if a QALY were worth $50,000, THP → T-DM1 → Cape/Lapat would have had a zero probability of being cost-effective compared to each of the remaining treatment sequences (Fig. 3).
Fig. 3.

Cost-effectiveness acceptability curves. Sequence 1 THP → T-DM1 → Cape/Lapat, Sequence 2 THP → Trastuz/Lapat → Trastuz/Cape, Sequence 3 Trastuz/Docet → T-DM1 → Trastuz/Lapat, Sequence 4 Trastuz/Docet → Trastuz/Lapat → Trastuz/Cape
DISCUSSION
Although targeted therapies have significantly improved the survival of patients with HER2-positive mBC, they have also been associated with significant acquisition costs. In this paper, we compared the cost-effectiveness of four potential sequences used in phase III trials and that are FDA approved for this patient population. Consistent with the phase III clinical trials, THP → T-DM1 → Cape/Lapat was the most clinically effective sequence, but was associated with the highest total cost in our base-case analysis. In order for THP → T-DM1 → Cape/Lapat to be a cost-effective approach, the WTP threshold would have to be U.S. $398,444.17/QALY. Trastuz/Docet → T-DM1 → Trastuz/Lapat, which excluded treatment with pertuzumab, was the least clinically effective, but most cost-effective sequence. Meanwhile.
THP → Trastuz/Lapat → Trastuz/Cape (no T-DM1) was extendedly dominated.
Recently, Durkee et al. performed a cost-effectiveness analysis of pertuzumab in the management of treatment naïve HER2-positive mBC, and with an ICER of US$713,219/QALY, found the addition of pertuzumab to docetaxel and trastuzumab to not be cost-effective, when compared to docetaxel and trastuzumab alone [8]. In contrast to our analysis, which assigned costs in the stable disease state and assumed most patients with HER2-positive mBC cancer would receive sequential lines of HER2 targeted therapy, Durkee et al. used costs in the progression disease state and assumed the patients would only receive one line of HER2 directed therapy, after initial progression on pertuzumab, an assumption that does not reflect the standard clinical prescribing practice among oncology clinicians in the U.S.
The evidence review group (ERG) for the National Institute for Health and Care Excellence (NICE) in the UK preliminarily estimated an ICER of £166,429 (approximately US$250,000) QALY gained for trastuzumab emtansine, compared with lapatinib plus capecitabine [35]. Based upon the commonly accepted WTP threshold of £30,000/QALY, NICE recently advised against the use of pertuzumab and T-DM1 for HER2 positive mBC.
This study is the first to evaluate the cost-effectiveness of several potential treatment sequences rather than just the addition of a new agent in the management of HER2-positive mBC. While cost-effectiveness evaluations in the U.S. are currently not considered in the FDA approval evaluation or private and public health insurance coverage, it is clear that current unregulated, manufacturer based pricing policies are unsustainable for the US economy [36]. At current prices, using WTP thresholds that are less than $200,000, treatment sequences, including that in which was studied in CLEOPATRA (pertuzumab and T-DM1), are not cost-effective for the treatment of HER2-positive mBC. THP → T-DM1 → Cape/Lapat becomes cost-effective compared to Trastuz/Docet → Trastuz/Lapat → Trastuz/Cape when the WTP threshold is at least $200,000.
Our model is subject to limitations. First, the treatment sequences did not include the clinical approach of adding endocrine blockade to HER2 targeting (Pertuzumab and Trastuzumab) after the cytotoxic component is dropped. To our defense, trials evaluating this approach are ongoing and as such data are very limited. For this reason, we assumed that patients entering our model were both HER2-positive and candidates for chemotherapy. Second, we did not include the cost of positron emission tomography and computed tomography (PET-CT) scan, which is often used in restaging. Nonetheless, the main input parameters for our model were sourced from available phase III clinical trials, which did not use PET-CT.
Notwithstanding these limitations, we believe the results of our analysis to be robust. The development and reporting of our methods was done in light of the joint recommendations of the International Society for Pharmacoeconomics and Outcomes Research (ISPOR) and Society for Medical Decision Making (SMDM) good research practices for model transparency and validation [37]. The identification of the treatment sequences was done by experienced oncologists, based on available published phase III trials and ASCO consensus guidelines [3]. The Markov cycle length considered allowed capturing small variations in the estimation of transitional probabilities and costs among competing alternatives. Patients in our model were also able to live the remaining life expectancies at the completion of our simulations, which reflects real-life conditions. The estimation of transitional probabilities was done using appropriate epidemiological and statistical techniques such as IPD reconstruction and parametric survival model fitting. The estimation of health utilities was based on published literature and was adjusted to reflect some demographic characteristics of patients included in our model. Deterministic and probabilistic sensitivity analyses assessed the impact of uncertainty on our initial results. Finally, our analysis is transparent enough to allow interested readers to replicate or build on the methods presented in this paper. Readers are redirected to a supplemental online file where further explanations are provided should they need it.
The results of this study raise an important dilemma that has emerged in oncology, where the most clinically effective drugs are typically not the most cost-effective therapeutic options. Thus, practitioners caring for cancer patients, who inherently wish to provide the most clinically effective treatments, are often faced with a difficult predicament. As opposed to many other new agents in oncology that have been FDA approved during this era of precision medicine, both pertuzumab and T-DM1 have demonstrated to produce a very significant long-term patient benefit, when compared to previous treatments. The clinical benefit is so profound that most practitioners would not accept treating patients according to their cost-effectiveness profile. Should we consider a value-based pricing approach, a strategy that helps identify the price at which a treatment becomes cost-effective, our analysis suggests the following pricing guidelines:
The sequence containing pertuzumab and T-DM1 dominates Trastuz/Docet → Trastuz/Lapat → Trastuz/Cape when the acquisition cost of T-DM1 is 50 % less than its current price.
The sequence containing pertuzumab and T-DM1 is cost-effective compared to Trastuz/Docet → Trastuz/Lapat → Trastuz/Cape, at a WTP threshold of $52,000, when the acquisition cost of pertuzumab (loading and/or maintenance doses) is approximately 50 % less than its current price.
THP → T-DM1 → Cape/Lapat is cost-effective compared to Trastuz/Docet → T-DM1 → Trastuz/Lapat and Trastuz/Docet → Trastuz/Lapat → Trastuz/Cape, at a WTP threshold of $186,000, when the acquisition costs of pertuzumab and T-DM1 is a fourth of their current price.
Pursuit of value-based pricing and the establishment of an institution analogous to United Kingdom (UK)’s NICE in the U.S. would seem to be one logical approach to overcome this dilemma between the optimal treatment approaches in oncology increasingly being the least cost-effective options.
Supplementary Material
Acknowledgments
The authors would like to thank Andrew Munzer (Director of Training & Support, TreeAge) and Dr. Vassiki Sanogo (Senior researcher, Center for Economic Forecasting and Analysis at Florida State University) for their technical assistance.
Funding This study was funded in part by the National Institute on Minority Health and Health Disparities of the National Institutes of Health under Award No. G12MD007582 (to V.D.), and by National Cancer Institute Grant No. 5R25CA093423-10 Virginia Commonwealth University/Massey Cancer Center (to G.A.).
Footnotes
This manuscript was presented at the 21st annual international meeting of the International Society for Pharmacoeconomics and Outcomes Research in Washington D.C. (Poster Presentations Session III Tuesday, May 24, 2016)
Electronic supplementary material The online version of this article (doi:10.1007/s10549-016-3978-6) contains supplementary material, which is available to authorized users.
Conflict of Interest Vakaramoko Diaby declares that he has no conflict of interest. Georges Adunlin declares that he has no conflict of interest. Askal Ayalew Ali declares that she has no conflict of interest. Simon B. Zeichner declares that he has no conflict of interest. Gilberto de Lima Lopes declares that he has no conflict of interest. Christine G. Kohn declares that she has no conflict of interest. Alberto J. Montero declares that he has no conflict of interest.
Ethical approval This article does not contain any studies with human participants or animals performed by any of the authors.
References
- 1.Arteaga CL, Sliwkowski MX, Osborne CK, et al. Treatment of HER2-positive breast cancer: current status and future perspectives. Nat Rev Clin Oncol. 2012;9:16–32. doi: 10.1038/nrclinonc.2011.177. [DOI] [PubMed] [Google Scholar]
- 2.John M, Hinke A, Stauch M, et al. Weekly paclitaxel plus trastuzumab in metastatic breast cancer pretreated with anthracyclines–a phase II multipractice study. BMC Cancer. 2012;12:165. doi: 10.1186/1471-2407-12-165. [DOI] [PMC free article] [PubMed] [Google Scholar]
- 3.Giordano SH, Temin S, Kirshner JJ, et al. Systemic therapy for patients with advanced human epidermal growth factor receptor 2-positive breast cancer: American Society of Clinical Oncology clinical practice guideline. J Clin Oncol. 2014;32:2078–2099. doi: 10.1200/JCO.2013.54.0948. [DOI] [PMC free article] [PubMed] [Google Scholar]
- 4.Cameron D, Casey M, Oliva C, et al. Lapatinib plus capecitabine in women with HER-2-positive advanced breast cancer: final survival analysis of a phase III randomized trial. Oncologist. 2010;15:924–934. doi: 10.1634/theoncologist.2009-0181. [DOI] [PMC free article] [PubMed] [Google Scholar]
- 5.Slamon DJ, Leyland-Jones B, Shak S, et al. Use of chemotherapy plus a monoclonal antibody against HER2 for metastatic breast cancer that overexpresses HER2. N Engl J Med. 2001;344:783–792. doi: 10.1056/NEJM200103153441101. [DOI] [PubMed] [Google Scholar]
- 6.Swain S, Kim S, Cortes J. Final overall survival (OS) analysis from the CLEOPATRA study of first-line (1L) pertuzumab (Ptz), trastuzumab (T), and docetaxel (D) in patients (pts) with HER2-positive metastatic breast cancer (MBC) 2014:350. [Google Scholar]
- 7.National Comprehensive Cancer Network. NCCN clinical practice guidelines in oncology: breast cancer. 2015 doi: 10.6004/jnccn.2009.0070. Version 3. [DOI] [PubMed] [Google Scholar]
- 8.Durkee BY, Qian Y, Pollom EL, et al. Cost-effectiveness of pertuzumab in human epidermal growth factor receptor 2–positive metastatic breast cancer. J Clin Oncol. 2015;2015(62):9105. doi: 10.1200/JCO.2015.62.9105. [DOI] [PMC free article] [PubMed] [Google Scholar]
- 9.Swain SM, Kim S, Cortés J, et al. Pertuzumab, trastuzumab, and docetaxel for HER2-positive metastatic breast cancer (CLEOPATRA study): overall survival results from a randomised, double-blind, placebo-controlled, phase 3 study. Lancet Oncol. 2013;14:461–471. doi: 10.1016/S1470-2045(13)70130-X. [DOI] [PMC free article] [PubMed] [Google Scholar]
- 10.Verma S, Miles D, Gianni L, et al. Trastuzumab emtansine for HER2-positive advanced breast cancer. N Engl J Med. 2012;367:1783–1791. doi: 10.1056/NEJMoa1209124. [DOI] [PMC free article] [PubMed] [Google Scholar]
- 11.Blackwell KL, Burstein HJ, Storniolo AM, et al. Randomized study of Lapatinib alone or in combination with trastuzumab in women with ErbB2-positive, trastuzumab-refractory metastatic breast cancer. J Clin Oncol. 2010;28:1124–1130. doi: 10.1200/JCO.2008.21.4437. [DOI] [PubMed] [Google Scholar]
- 12.von Minckwitz G, du Bois A, Schmidt M, et al. Trastuzumab beyond progression in human epidermal growth factor receptor 2-positive advanced breast cancer: a german breast group 26/breast international group 03–05 study. J Clin Oncol. 2009;27:1999–2006. doi: 10.1200/JCO.2008.19.6618. [DOI] [PubMed] [Google Scholar]
- 13.Sorensen SV, Goh JW, Pan F, et al. Incidence-based cost-of-illness model for metastatic breast cancer in the United States. Int J Technol Assess Health Care. 2012;28:12–21. doi: 10.1017/S026646231100064X. [DOI] [PubMed] [Google Scholar]
- 14.Gray AM, Clarke PM, Wolstenholme JL, et al. Applied methods of cost-effectiveness analysis in healthcare. Oxford University Press; Oxford: 2010. [Google Scholar]
- 15.Laupacis A, Feeny D, Detsky AS, et al. How attractive does a new technology have to be to warrant adoption and utilization? Tentative guidelines for using clinical and economic evaluations. CMAJ. 1992;146:473–481. [PMC free article] [PubMed] [Google Scholar]
- 16.Neumann PJ, Cohen JT, Weinstein MC. Updating cost-effectiveness—the curious resilience of the $50,000-per-QALY threshold. N Engl J Med. 2014;371:796–797. doi: 10.1056/NEJMp1405158. [DOI] [PubMed] [Google Scholar]
- 17.Winkelmayer WC, Weinstein MC, Mittleman MA, et al. Health economic evaluations: the special case of end-stage renal disease treatment. Med Decis Making. 2002;22:417–430. doi: 10.1177/027298902236927. [DOI] [PubMed] [Google Scholar]
- 18.Lee CP, Chertow GM, Zenios SA. An empiric estimate of the value of life: updating the renal dialysis cost-effectiveness standard. Value in Health. 2009;12:80–87. doi: 10.1111/j.1524-4733.2008.00401.x. [DOI] [PubMed] [Google Scholar]
- 19.Geyer CE, Forster J, Lindquist D, et al. Lapatinib plus capecitabine for HER2-positive advanced breast cancer. N Engl J Med. 2006;355:2733–2743. doi: 10.1056/NEJMoa064320. [DOI] [PubMed] [Google Scholar]
- 20.Guyot P, Ades AE, Ouwens MJ, et al. Enhanced secondary analysis of survival data: reconstructing the data from published Kaplan-Meier survival curves. BMC Med Res Methodol. 2012;12 doi: 10.1186/1471-2288-12-9. 9-2288-12-9. [DOI] [PMC free article] [PubMed] [Google Scholar]
- 21.Diaby V, Ali AA, Adunlin G, et al. Parameterization of a disease progression simulation model for sequentially treated metastatic human epidermal growth factor receptor 2 positive breast cancer patients. Curr Med Res Opin. 2016:991–996. doi: 10.1185/03007995.2016.1149056. [DOI] [PMC free article] [PubMed] [Google Scholar]
- 22.Medicare ASP Drug Pricing Files. 2015 http://www.cms.gov/Medicare/Medicare-Fee-for-Service-Part-BDrugs/McrPartBDrugAvgSalesPrice/2015ASPFiles.html. Accessed 22 Oct 2015.
- 23.Centers for Medicare and Medicaid Services. Physician Fee Schedule Search. 2015 https://www.cms.gov/apps/physician-fee-schedule/search/search-results.aspx?Y=1&T=0&HT=1&CT=0&H1=80053&H2=85025&M=5. Accessed 22 Sept 2015.
- 24.Schilling MB, Parks C, Deeter RG. Costs and outcomes associated with hospitalized cancer patients with neutropenic complications: a retrospective study. Exp Ther Med. 2011;2:859–866. doi: 10.3892/etm.2011.312. [DOI] [PMC free article] [PubMed] [Google Scholar]
- 25.Niraula S, Amir E, Vera-Badillo F, et al. Risk of incremental toxicities and associated costs of new anticancer drugs: a meta-analysis. J Clin Oncol. 2014;32:3634–3642. doi: 10.1200/JCO.2014.55.8437. [DOI] [PubMed] [Google Scholar]
- 26.Garrison LP, Lubeck D, Lalla D, et al. Cost-effectiveness analysis of trastuzumab in the adjuvant setting for treatment of HER2-positive breast cancer. Cancer. 2007;110:489–498. doi: 10.1002/cncr.22806. [DOI] [PubMed] [Google Scholar]
- 27.Sharpe D. Treatment-Related Toxicities Add Substantially to Cost Burden of Treating Cancer Patients. 2011 http://www.obroncology.com/blog/2011/09/treatment-related-toxicities-add-substantially-to-cost-burden-oftreating-cancer-patients/. Accessed 20 Sept 2015.
- 28.Lloyd A, Nafees B, Narewska J, et al. Health state utilities for metastatic breast cancer. Br J Cancer. 2006;95:683–690. doi: 10.1038/sj.bjc.6603326. [DOI] [PMC free article] [PubMed] [Google Scholar]
- 29.Attard C, Brown S, Alloul K, et al. Cost-effectiveness of FOLFIRINOX for first-line treatment of metastatic pancreatic cancer. Curr Oncol. 2014;21:e41. doi: 10.3747/co.21.1327. [DOI] [PMC free article] [PubMed] [Google Scholar]
- 30.Nafees B, Stafford M, Gavriel S, et al. Health state utilities for non small cell lung cancer. Health Qual Life Outcomes. 2008;6:84. doi: 10.1186/1477-7525-6-84. [DOI] [PMC free article] [PubMed] [Google Scholar]
- 31.Doyle S, Lloyd A, Walker M. Health state utility scores in advanced non-small cell lung cancer. Lung Cancer. 2008;62:374–380. doi: 10.1016/j.lungcan.2008.03.019. [DOI] [PubMed] [Google Scholar]
- 32.Evans DB, Hurley SF. The application of economic evaluation techniques in the health sector: the state of the art. J Int Dev. 1995;7:503–524. [Google Scholar]
- 33.Gold M. Cost-effectiveness in health and medicine. Oxford University Press; Oxford: 1996. [Google Scholar]
- 34.Briggs A, Sculpher M, Claxton K. Decision modelling for health economic evaluation. Oxford university press; Oxford: 2006. [Google Scholar]
- 35.National Institute for Health and Care Excellence. Final appraisal determination. Trastuzumab emtansine for treating HER2- positive, unresectable locally advanced or metastatic breast cancer after treatment with trastuzumab and a taxane. 2015;2015 doi: 10.1007/s40273-016-0386-z. [DOI] [PubMed] [Google Scholar]
- 36.Neumann PJ, Weinstein MC. Legislating against use of cost-effectiveness information. N Engl J Med. 2010;363:1495–1497. doi: 10.1056/NEJMp1007168. [DOI] [PubMed] [Google Scholar]
- 37.Eddy DM, Hollingworth W, Caro JJ, et al. Model transparency and validation: a report of the ISPOR-SMDM Modeling Good Research Practices Task Force-7. Med Decis Making. 2012;32:733–743. doi: 10.1177/0272989X12454579. [DOI] [PubMed] [Google Scholar]
Associated Data
This section collects any data citations, data availability statements, or supplementary materials included in this article.