Abstract
Adipose tissue is a major site of energy storage and plays a role in regulation of metabolism through release of adipokines. Here we show that mice with a fat-specific knockout of the miRNA-processing enzyme Dicer (ADicerKO), as well as humans with lipodystrophy, have major decreases in circulating exosomal miRNAs. Transplantation of white and especially brown adipose tissue (BAT) into ADicerKO mice restores circulating miRNAs associated with an improvement in glucose tolerance and a reduction of hepatic FGF21 mRNA and circulating FGF21. This gene regulation can be mimicked by administration of normal, but not AdicerKO, serum exosomes. Expression of a human-specific miRNA in BAT of one mouse in vivo can also regulate its 3’UTR-reporter in liver of another mouse through serum exosomal transfer. Thus, adipose tissue constitutes a major source of circulating exosomal miRNAs, and these miRNAs can regulate gene expression in distant tissues thereby serving as novel forms of adipokines.
Keywords: Brown fat, Exosomes, Obesity, Lipodystrophy, Metabolic syndrome, FGF21, Tissue crosstalk
miRNAs are non-coding RNAs of 19–22 nucleotides that function as negative regulators of translation and are involved in many cellular processes1,2,3. In addition to tissues, many miRNAs exist in the circulation4, a large fraction of which are in exosomes5, i.e., 50–200nm vesicles released from multivesicular bodies6. Increased levels of specific miRNAs have been associated with a variety of diseases, including cancer7, diabetes3,8,9 obesity10, and cardiovascular disease11. miRNAs play an important role in the differentiation and function of many cells, including adipose tissue12. We have shown that white adipose tissue (WAT) miRNAs decline with age due to a decrease in the miRNA processing enzyme Dicer13 and are also reduced in humans with HIV-associated lipodystrophy14 due to a decrease in Dicer. To better understand the role of miRNAs in fat, we generated mice specifically lacking Dicer in adipose tissue using Cre-lox gene recombination (Figure 1a)13. ADicerKO mice exhibit a defect in miRNA processing in adipose tissue resulting in a reduction of WAT, whitening of BAT, insulin resistance and altered circulating lipids14.
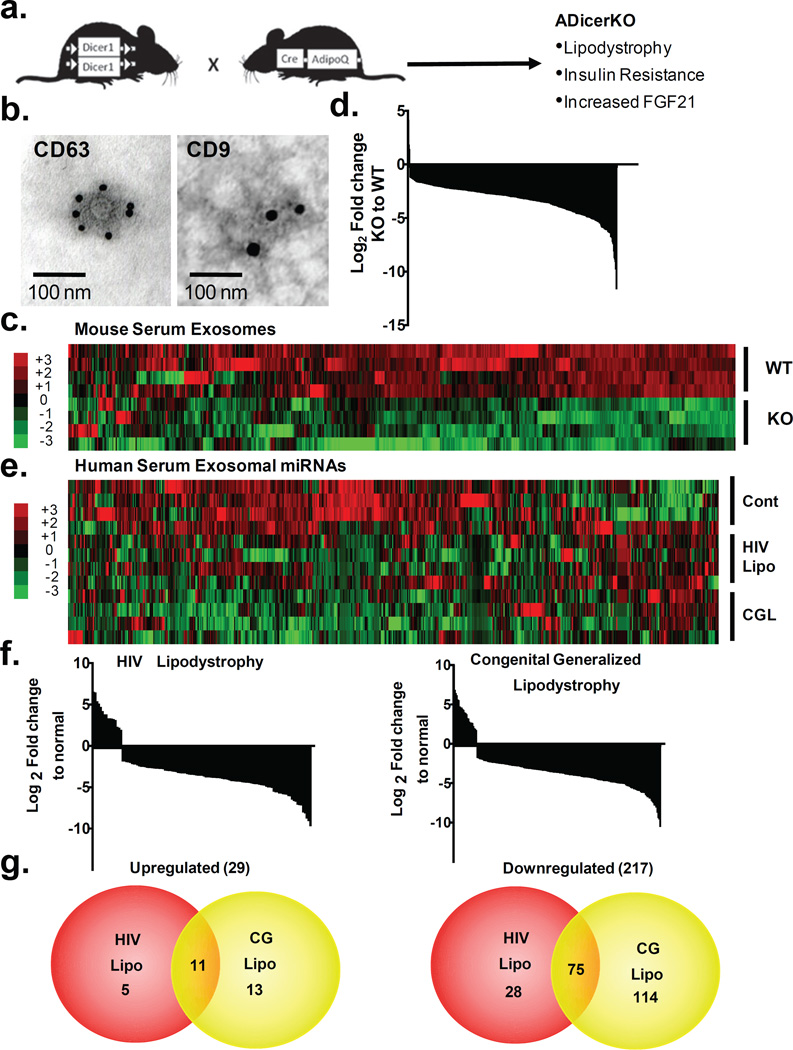
Figure 1. Fat tissue is a major source of exosomal miRNAs.
(a) Schematic showing creation of ADicerKO mice. (b) Immunoelectron microscopy of CD63 and CD9 in murine serum exosomes. (c) Heatmap showing Z-scores of exosomal miRNAs from serum of ADicerKO (KO) and Lox (WT) mice (n=4/group). (d) Waterfall plot showing relative abundance of serum exosomal miRNAs between ADicerKO and control mice (n=4/group, p<0.05). (e) Heatmap showing Z-scores of exosomal miRNAs in sera of humans with HIV lipodystrophy (HIV), congenital generalized lipodystrophy (CGL) and controls (n=4/group). (f) Waterfall plots representing the relative abundance of exosomal miRNAs differentially expressed between HIV lipodystrophy, generalized lipodystrophy and controls (n=4/group, p<0.05). (g) Venn diagrams representing significantly up- and down-regulated miRNAs in HIV and CGL compared to controls (n=4/group, p<0.05).
Adipose Tissue is a Major Source of Circulating Exosomal miRNAs
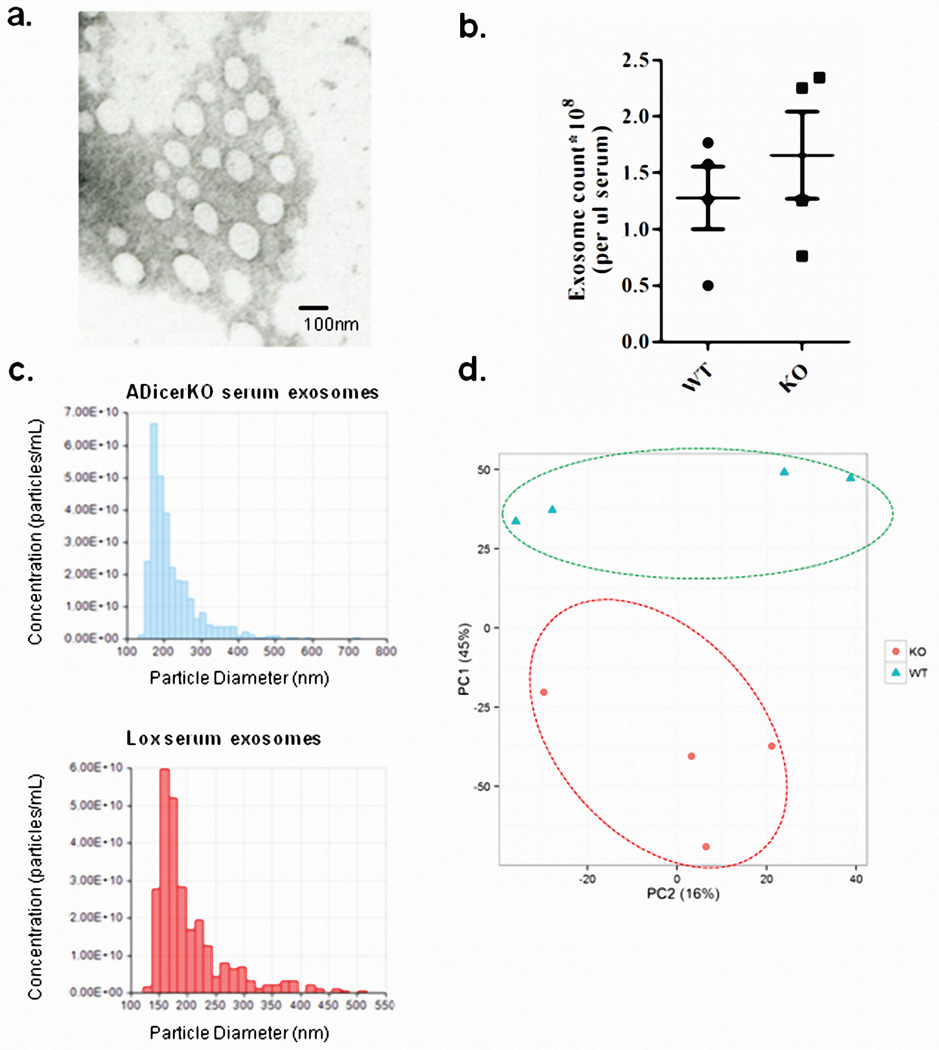
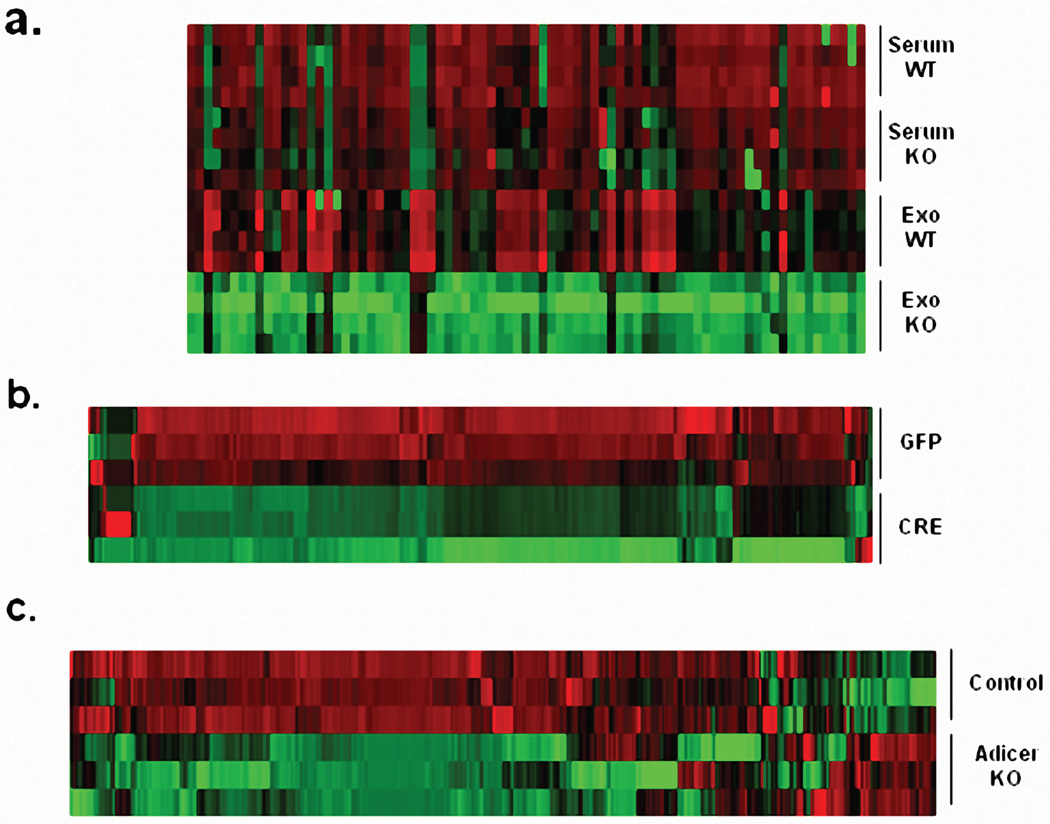
To determine to what extent adipose tissue contributes to circulating miRNAs, we isolated exosomes from sera of 6-month-old male ADicerKO and control mice by differential ultracentrifugation15. These vesicles were 80–200nm in diameter16 (Extended Data Figure 1a) and stained for the exosomal markers CD63 and CD9 (Figure 1b)17,18. The number of exosomes isolated from ADicerKO and controls was comparable (Extended Data Figure 1b and 1c). qPCR profiling of serum exosomes for 709 murine miRNAs revealed 653 detectable miRNAs (defined as CT<34). Compared to control, ADicerKO mice exhibited significant alterations in 422 exosomal miRNAs. Of these, 3 miRNAs were significantly increased, while 419 had significant decreases (Figures 1c–d, Extended Data Figure 1d and Supplemental Table 1) with 88% reduced by >4-fold, suggesting that adipose tissue is a major source of circulating exosomal miRNAs. Consistent with this, many of the reduced miRNAs (Supplemental Table 1) have been previously identified as highly expressed in fat, including miR-221, miR-201, miR-222 and miR-169,19,20. miRNAs also exist in the circulation outside of exosomes. Indeed, in a sample of 80 miRNAs, there was a broad reduction in total miRNAs in ADicerKO serum when compared to serum of WT mice (Extended Data Figure 2a), however, this reduction was not as dramatic as the downregulation of exosomal miRNAs showing that adipose contributes especially to the exosomal miRNA fraction. The loss of exosomal miRNA secretion in adipocytes lacking Dicer is cell autonomous. Thus, in preadipocytes isolated from Dicer-floxed animals and recombined in vitro, most of the detectable miRNAs (of 380 miRNAs profiled) released in exosomes into the media were decreased when compared to control Ad-GFP-transduced cells (Extended Data Figure 2b).
To further dissociate altered metabolism from lipodystrophy as a cause of reduced exosomal miRNAs, we compared serum miRNAs from 4-week-old control and AdicerKO mice, since at this age metabolic phenotypes of ADicerKO mice are minimal (Extended Data Figure 2c). Again, of the 380 miRNAs profiled, 373 miRNAs were detectable with 202 down-regulated in ADicerKO mice and only 23 miRNAs up-regulated, indicating that reduction in circulating exosomal miRNAs reflects primarily differences in miRNA processing/production rather than effects of chronic lipodystrophy.
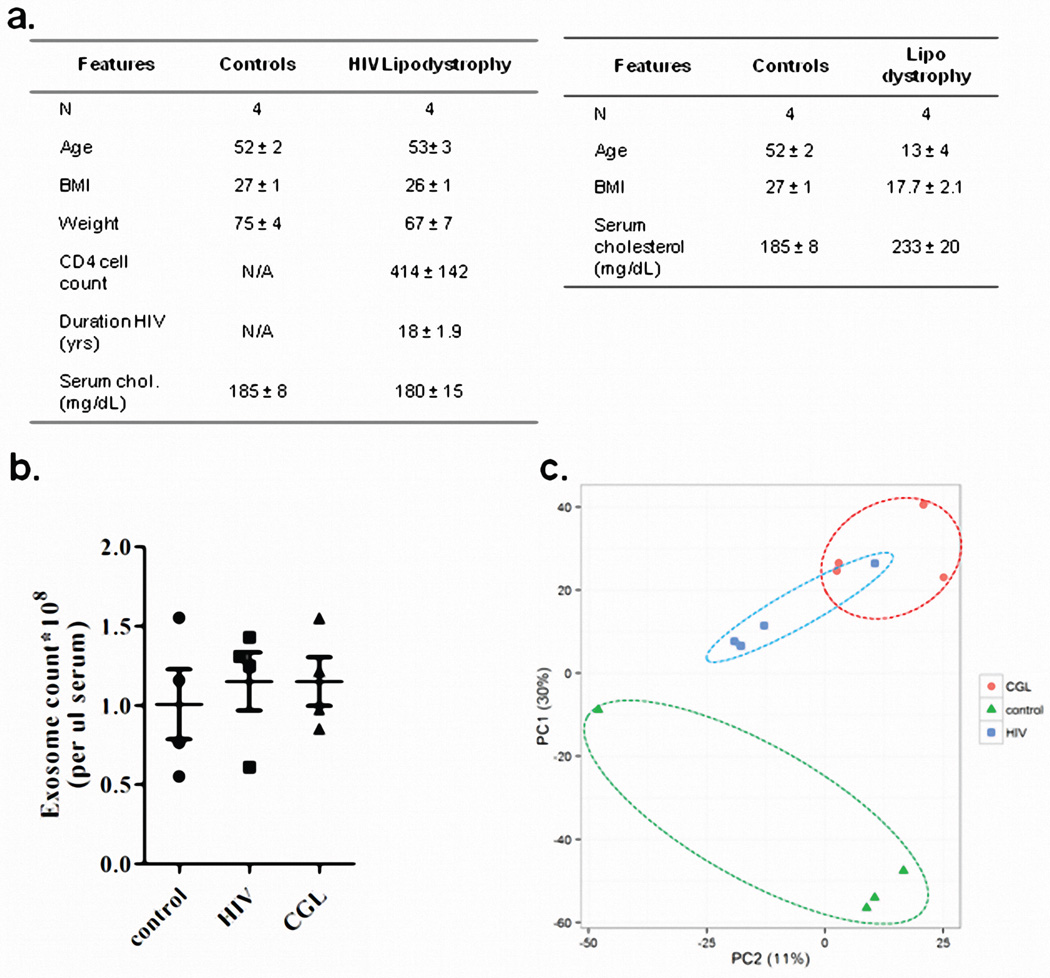
To determine if circulating miRNAs in humans also originate from fat, we performed exosomal miRNA profiling on sera from patients with congenital generalized lipodystrophy (CGL) and patients with HIV-related lipodystrophy, previously shown to have decreased levels of Dicer in adipose tissue14 (Extended Data Figure 3a). Isolation yielded similar exosome numbers from controls and lipodystrophic patients (Extended Data Figure 3b). qPCR profiling of 572 miRNAs in exosomes revealed 119 significantly different between control and HIV lipodystrophy subjects and 213 significantly different between control and CGL subjects (Figures 1e–f, Extended Data Figure 3c, Supplemental Tables 2 and 3). Of these, only 5% (29 miRNAs) were upregulated in CGL or HIV lipodystrophy, while 217 (38%) were down-regulated, with 75 decreased in both groups (Figure 1g, Supplemental Table 4). Again, several of these miRNAs have been previously implicated in regulation of fat9,10,20,21. Thirty miRNAs that were decreased in serum of both patient cohorts were also decreased in the serum of ADicerKO mice (Supplemental Table 5).
Adipose Tissue Transplantation Reconstitutes Circulating miRNAs in Lipodystrophic Mice
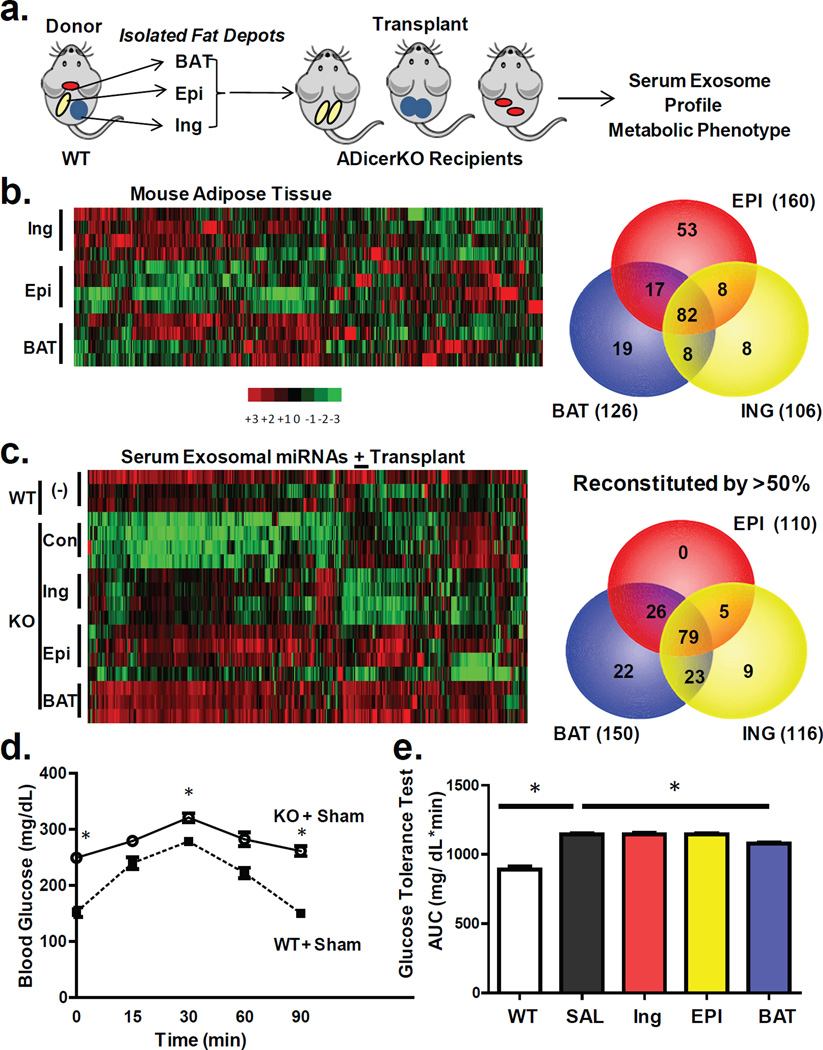
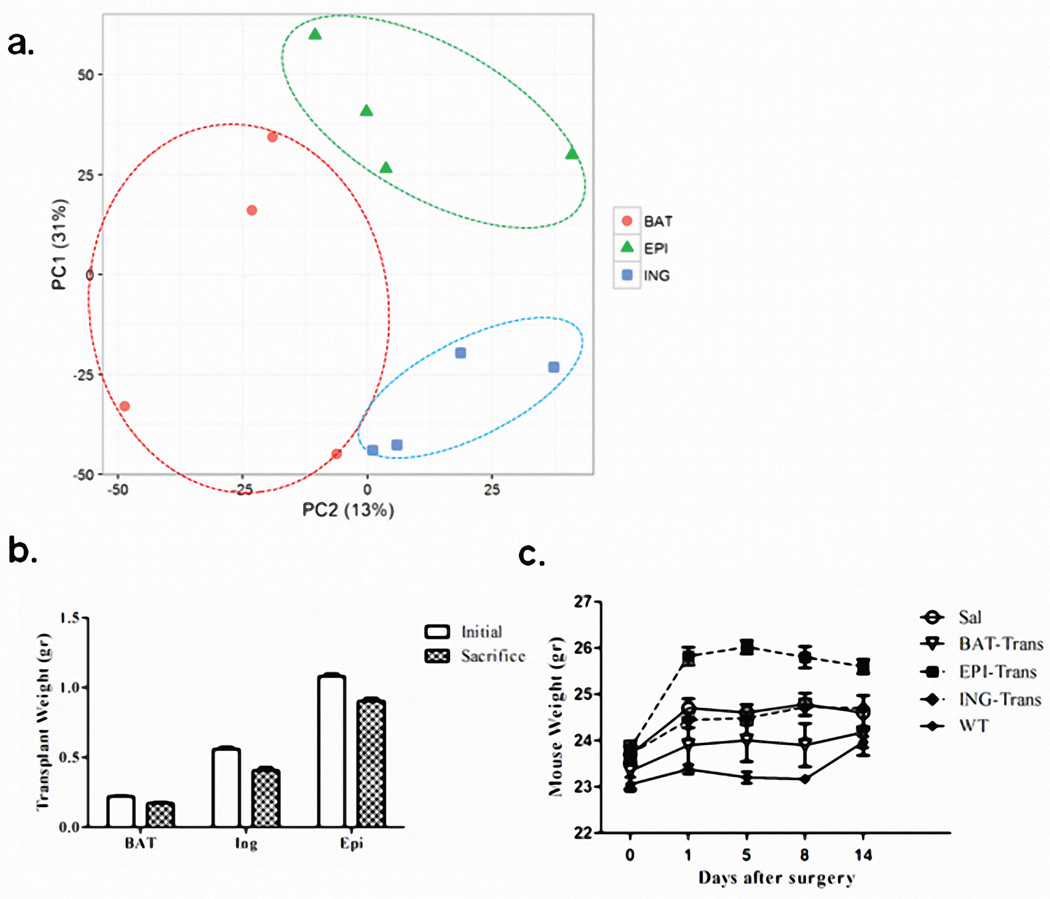
To verify that adipose tissue is indeed a major source of circulating miRNAs, we transplanted fat from normal mice into ADicerKO mice (Figure 2a). miRNA profiling of subcutaneous inguinal (Ing) WAT, intraabdominal epididymal (Epi) WAT, and BAT from the normal donor mice revealed distinct, depot-specific signatures consistent with previous studies22 (Figures 2b, Extended Data Figure 4a; Supplemental Table 6). Considering only miRNAs that were expressed greater than U6, 126 miRNAs were highly expressed in BAT, 106 in Ing-WAT, and 160 in Epi-WAT, with 82 in all three depots (Figure 2b). During the following two weeks, all mice had maintained body weight, and at sacrifice the transplanted fat weighed 80–90% of the original weight, indicating successful engraftment (Extended Data Figures 4b and 4c). As in the first cohort, in sham-operated ADicerKO mice circulating exosomal miRNAs were markedly reduced compared to controls (Figure 2c). By comparison, ADicerKO mice that received fat transplants showed remarkable restoration of circulating exosomal miRNAs (Figures 2c and Extended Data Figure 5a; Supplemental Tables 7 and 8). Indeed, of the 177 circulating exosomal miRNAs that were detectable in wild-type and significantly decreased in ADicerKO serum, fat transplantation restored the levels of the majority of these at least 50% of the way to normal, indicating that adipose tissue is a major source of circulating exosomal miRNAs and that different depots contribute differentially.
Figure 2. Fat depot contributions to circulating exosomal miRNAs.
(a) Schematic of fat transplantation experiment using WT donor fat depots transplanted into ADicerKO recipients. (b) Heatmap showing Z-scores of miRNA expression in inguinal (Ing), epididymal (Epi), and brown adipose tissue (BAT) from WT donor mice (n=4/group). Venn diagram represents number of fat depot-specific miRNAs with expression >U6 in WT mice (n=4/group). (c) Heatmap of Z-scores of exosomal miRNAs in ADicerKO or C57Bl/6 mice after sham surgery and transplantation of fat (n=4/group). The Venn diagram represents miRNAs reconstituted at least 50% of the way to WT values after transplantation (n=4/group, p<0.05). (d) Glucose tolerance test in C57Bl/6 and AdicerKO mice (n=3/group, p=0.0001, WT vs KO at 0 min; p=0.013, WT vs KO at 15 min; p=0.0001, WT vs KO at 90 min, two-tailed t-test). (e) Area under the curve (AUC) of glucose tolerance tests in ADicerKO (+sham surgery), C57Bl/6 (+sham surgery) and ADicerKO mice after fat transplantion; (n=3/group, p=0.0002, WT vs KO, p=0.033 KO vs KO+BAT, two-tailed t-test). Bars represent SEM.
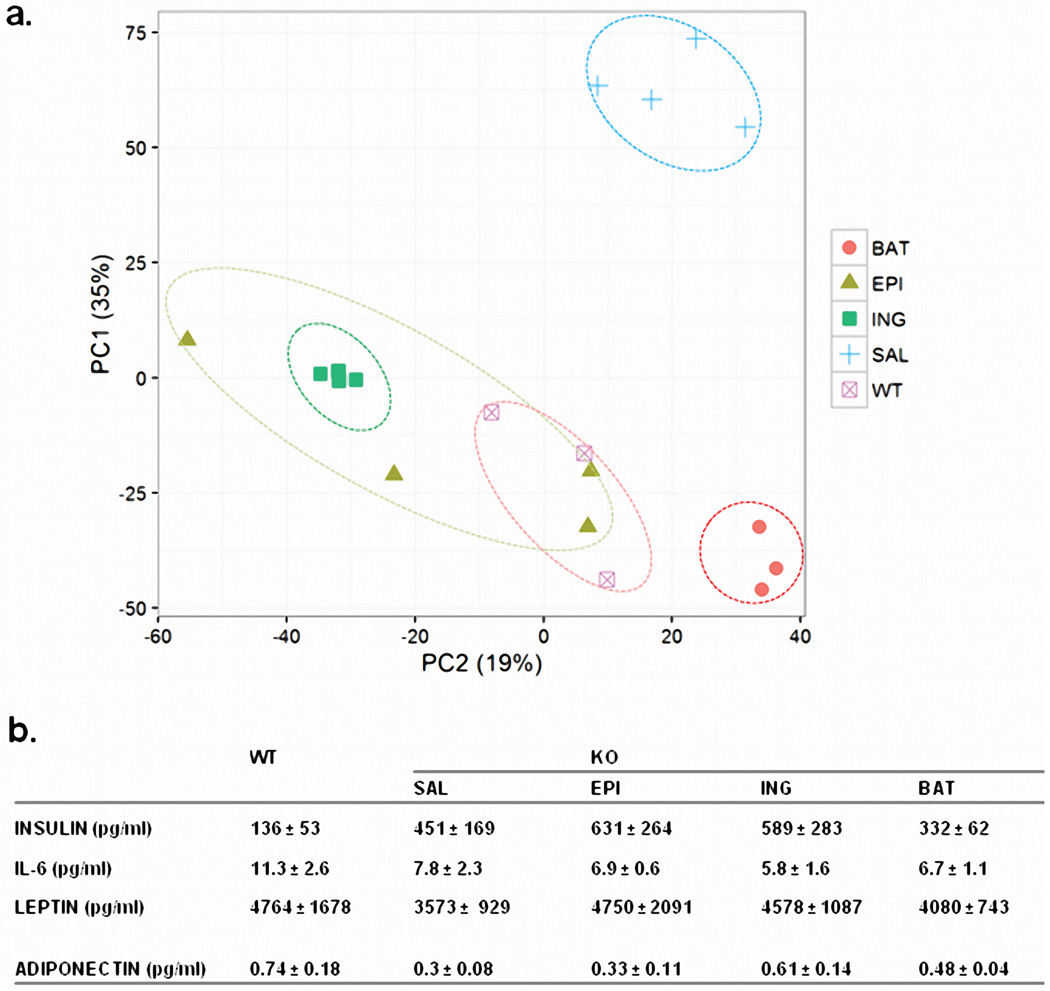
Physiologically, ADicerKO mice had markedly impaired glucose tolerance tests (GTTs) compared to controls with an ~50% increase in area under the curve (Figures 2d and 2e). This showed only small changes after transplantation of Ing-WAT or Epi-WAT, however, GTT was significantly improved in the ADicerKO mice receiving BAT transplantation (Figure 2e). ADicerKO mice also exhibit marked insulin resistance, as indicated by increased circulating insulin levels; this was also reduced in the group receiving BAT transplants, but did not quite reach statistical significance (Extended Data Figure 5b). Serum IL-6, leptin and adiponectin levels were all lower in ADicerKO and were not restored by transplantation (Extended Data Figure 5b).
FGF-21 as a Potential Target of Regulation by Circulating Exosomal miRNAs
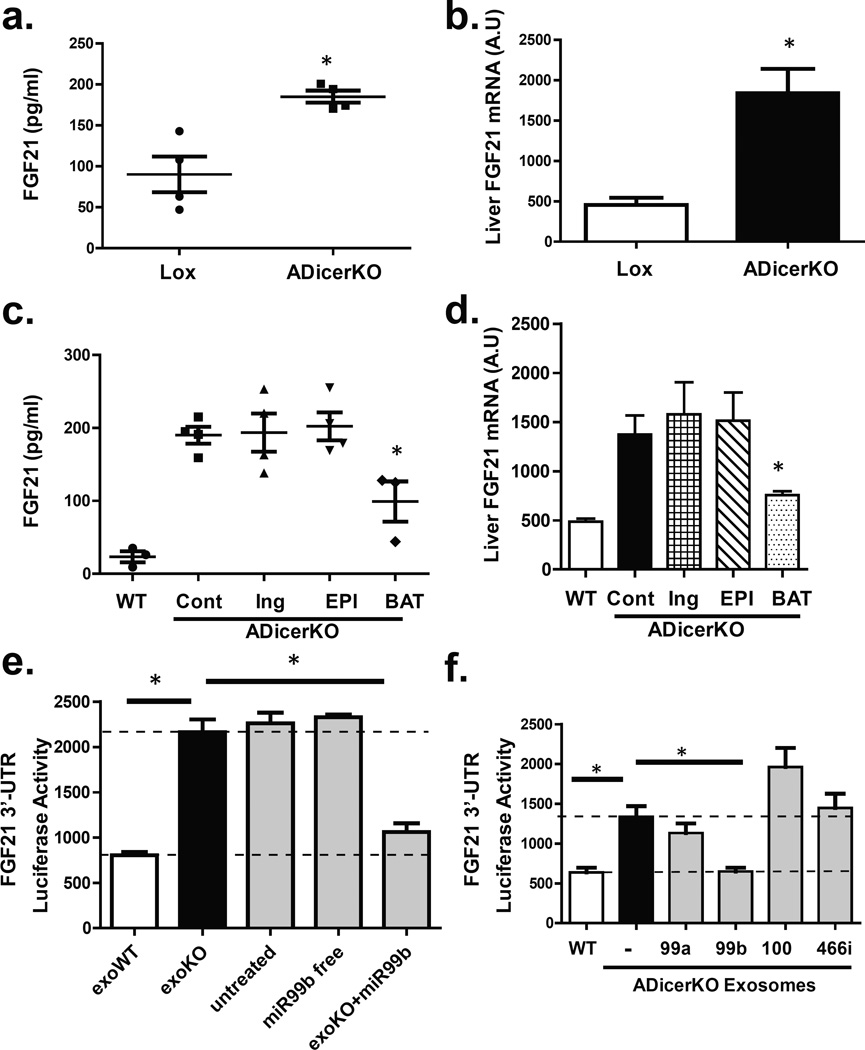
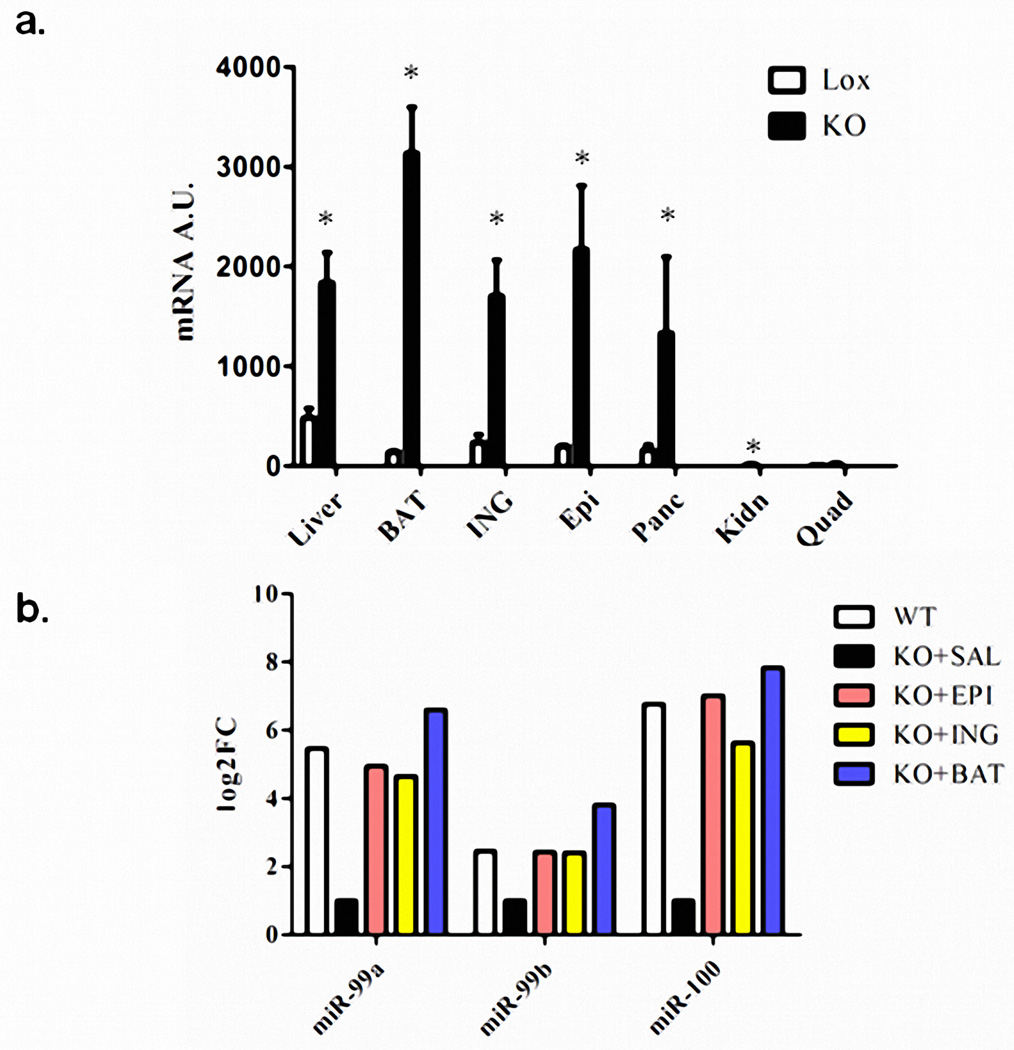
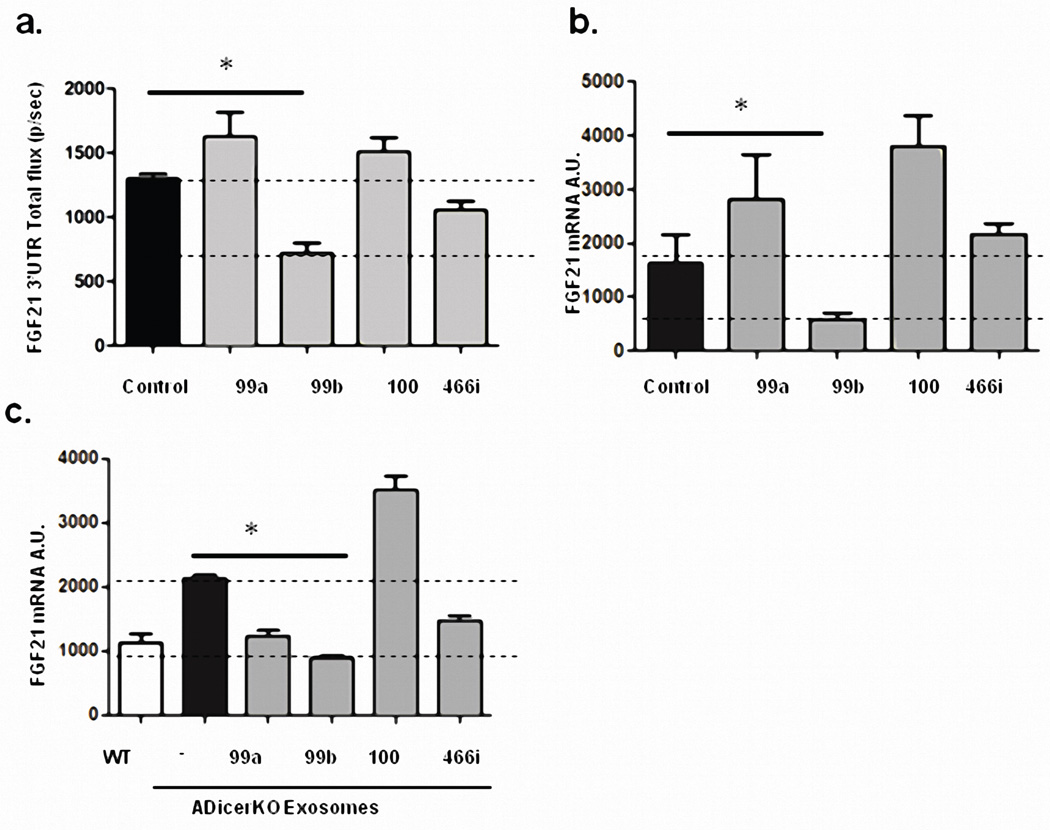
FGF21 (fibroblast growth factor-21) is produced in liver and other tissues, released into the circulation and exerts effects on multiple tissues in control of metabolism23. ADicerKO mice had a ~3-fold increase in circulating FGF21, associated with increased levels of FGF21 mRNA in liver, muscle, fat and pancreas (Figures 3a and 3b, Extended Data Figure 6a). After transplantation of WAT, serum FGF21 and liver FGF21 mRNA remained unchanged in the ADicerKO mice (Figures 3c and 3d). However, ADicerKO mice that received BAT transplants showed an ~50% reduction in the FGF21 mRNA in liver (Figure 3d). This was paralleled by a reduction of circulating FGF21 levels (Figure 3c), indicating that BAT transplantation provided some factor(s) that directly or indirectly regulated FGF21 expression in liver. Considering that one factor could be circulating miRNAs, we performed miRDB analysis to identify miRNAs that might target the 3’-UTR of murine FGF21 mRNA24. Four candidates were identified (miR-99a, miR-99b, miR-100, and miR-466i), and three of these (miR-99a, −99b, and −100) were significantly decreased in the serum of ADicerKO mice compared to controls. While these three miRNAs were restored to near WT levels in all ADicerKO transplant groups, only ADicerKO mice receiving BAT transplant exhibited expression levels higher than WT, tracking with reductions in circulating FGF21 levels in ADicerKO mice transplanted with BAT (Extended Data Figure 6b). To determine which of these miRNAs might regulate FGF21, we transfected AML-12 liver cells with an adenoviral pacAd5-FGF21 3’-UTR luciferase reporter and after 2 days transfected the cells with 10 nM of a candidate or control miRNA mimetic. Of these, only miR-99b resulted in a robust reduction of FGF21 luciferase activity (Extended Data Figure 7a), and this correlated with a reduction in FGF21 mRNA level by 65% (Extended Data Figure 7b).
Figure 3. Fat-derived exosomal miRNAs regulate hepatic FGF21 and transcription.
(a) Enzyme-linked immunoassay (ELISA) of FGF21 in serum of ADicerKO and control littermates (n=4/group, p=0.028, two-tailed Mann-Whitney U-test). (b) qPCR of hepatic FGF21 mRNA in Lox and ADicerKO mice (n=4/group, p=0.028, two-tailed Mann-Whitney U-test). (c) Serum FGF21 of ADicerKO (+sham surgery), WT mice (+sham surgery) and ADicerKO transplanted groups (n=3/group, p=0.019, WT vs KO+BAT, two-tailed t-test). (d) qPCR of hepatic FGF21 mRNA of mice in Panel c (n=3/group, p=0.046, Cont vs KO+BAT, two-tailed t-test). (e) FGF21-3’UTR luciferase activity after incubation of AML-12 cells with exosomes from Lox (exoWT), ADicerKO (exoKO), 10 nM free miR-99b or exosomes derived from ADicerKO mice electroporated with miR-99b (exoKO+miR-99b) (n=3/group, p=0.008, WT vs KO, p=0.008, KO vs. KO+99b, two-tailed t-test) (f) FGF21-3’UTR activity after incubation of AML-12 cells with exosomes from ADicerKO, Lox littermates, or ADicerKO mice and electroporated to introduce miR-99a, miR-99b, miR-100 or miR-466i. (n=3/group, p=0.0007, exoWT vs. exoKO, p=0.002, exoKO vs. exoKO+99b, two-tailed t-test).
To test if these miRNAs could regulate FGF21 when presented in exosomes, we exposed AML-12 cells expressing the FGF21-3’UTR luciferase reporter to exosomes from control or ADicerKO mice or ADicerKO exosomes which had been electroporated with either miR-99a, miR-99b, miR-100, miR-466i or a control mimic. We found that in vitro the isolated exosomes from control mice were able to suppress FGF21-3’UTR luciferase activity by 60%, whereas exosomes from ADicerKO serum had no effect (Figure 3e). Furthermore, while ADicerKO exosomes reconstituted with miR-99a, miR-100 or miR-466i had minimal effects, ADicerKO exosomes bearing miR-99b resulted in a ~55% suppression of the luciferase activity (Figure 3f), and this was paralleled by an equal reduction in FGF21 mRNA levels, mimicking the effect of wild-type exosomes (Extended Data Figure 7c). This regulation of FGF21 was dependent on exosomal delivery and was not recapitulated when naked miR-99b was incubated with these cells (Figure 3e, right two bars)
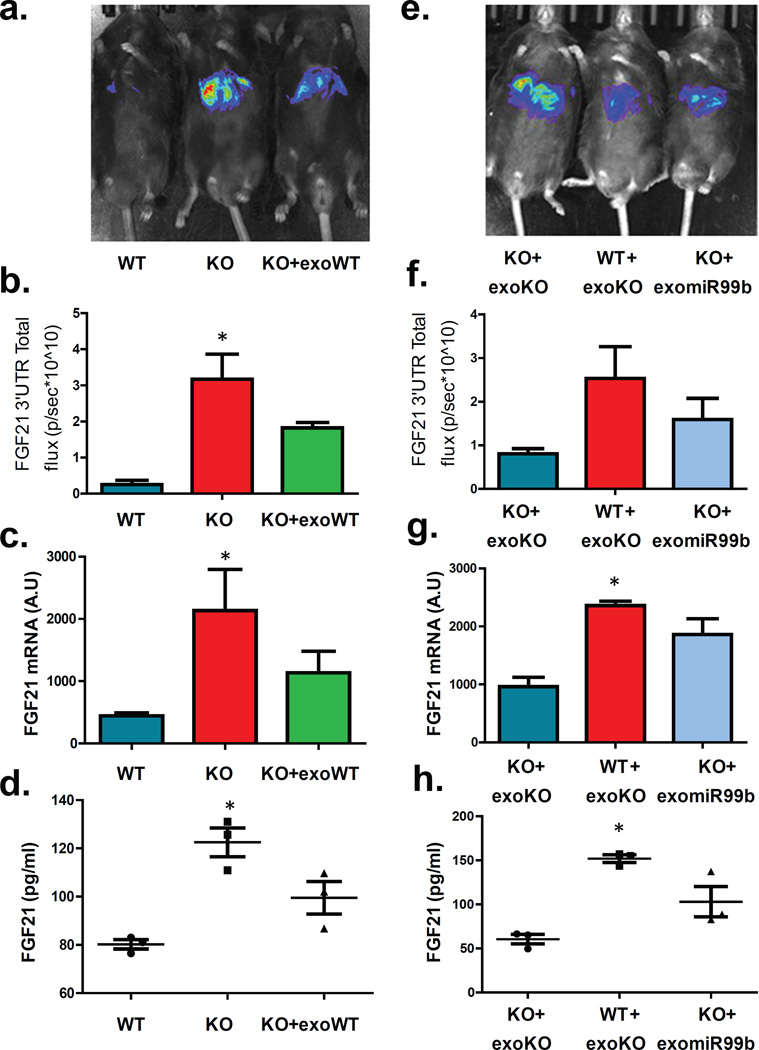
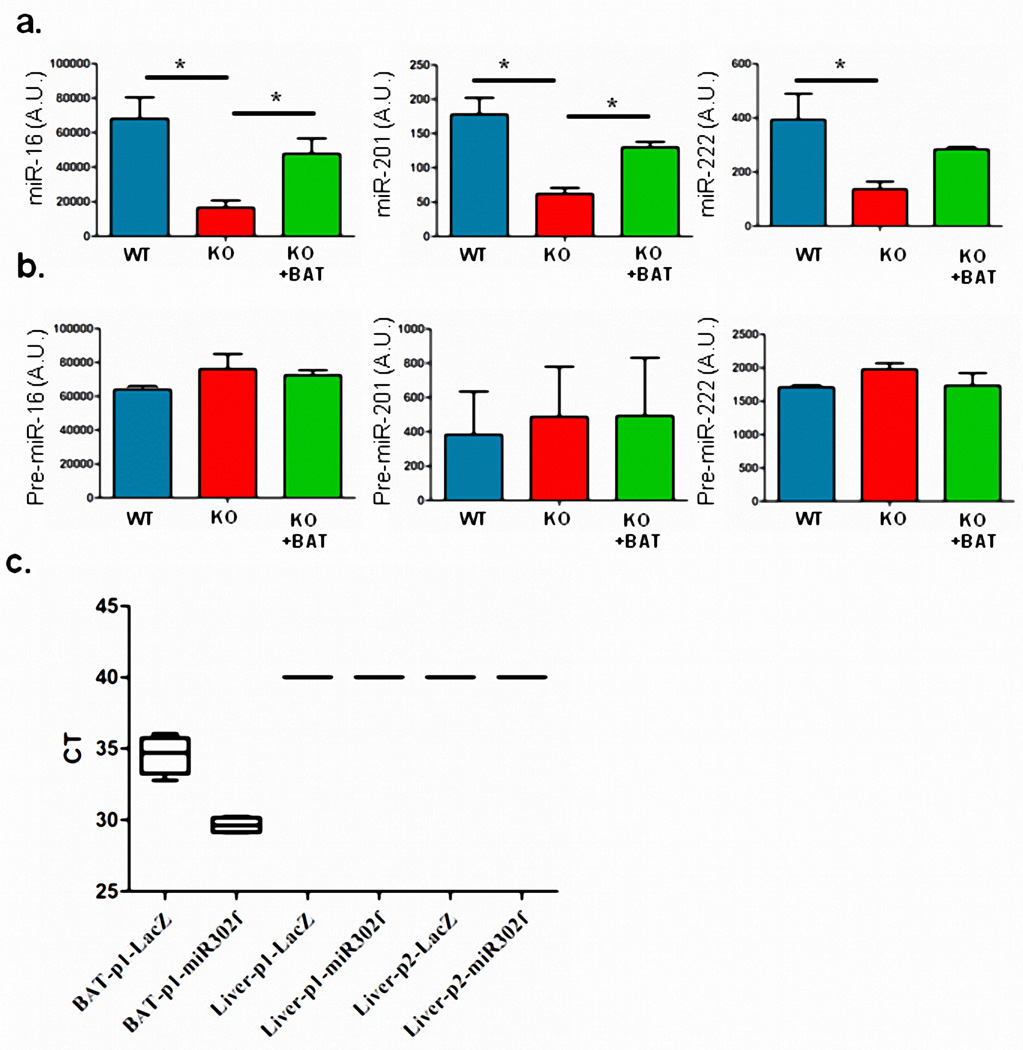
To address regulation of FGF21 by exosomal miRNAs in vivo, we transduced ADicerKO and WT mice with a pacAd5-FGF21 3’-UTR luciferase reporter and measured hepatic FGF21 suppression using the IVIS imaging system. Consistent with the in vitro study, FGF21 3’-UTR activity in vivo was 5-fold higher in ADicerKO mice than WT mice, reflecting the absence of repressive circulating miRNAs in the ADicerKO mice (Figures 4a and 4b). Injection of WT-exosomes into AdicerKO mice induced suppression of the elevated FGF21 reporter activity by ~60%. This was confirmed by qPCR which showed a reduction in elevated hepatic FGF21 mRNA and a parallel decrease in circulating FGF21 compared to KO mice (Figures 4c and 4d). Consistent with BAT-secreted exosome delivery of miRNAs to liver, miRNAs miR-16, miR-201 and miR-222, which are relatively fat-specific, were significantly decreased in livers of ADicerKO mice and restored toward normal by BAT transplantation (Extended Data Figure 8a). This occurred with no change in the corresponding pre-miRNA species in the liver (Extended Data Figure 8b).
Figure 4. In vivo regulation of FGF21 via exosomal miR-99b.
(a) Lox (WT), ADicerKO (KO), and ADicerKO mice injected i.v. with wild-type exosomes (KO+exoWT) transduced with pacAd5-Luc-FGF21-3’UTR luciferase reporter and subjected to IVIS analysis. (b) Total flux luminescence by IVIS of above mice (n=3/group, p=0.039, Kruskal-Wallis ANOVA , WT vs KO, Dunn’s post-hoc test). (c) qPCR of hepatic FGF21 mRNA in above mice (n=3/group, p=0.039, Kruskal-Wallis ANOVA with Dunn’s post-hoc test). (d) ELISA of serum FGF21 of above mice (n=3/group, p=0.027, Kruskal-Wallis ANOVA with Dunn’s post-hoc test) (e) Lox mice injected i.v. with ADicerKO exosomes (WT+exoKO) and ADicerKO mice injected with either ADicerKO exosomes (KO+exoKO) or ADicerKO exosomes electroporated with miR-99b (KO+exomiR99b) subjected to IVIS analysis. (f) Total flux luminescence in IVIS from mice in Panel e. (n=3/group, p=0.079, Kruskal-Wallis ANOVA, Dunn’s post-hoc test). (g) qPCR of hepatic FGF21 mRNA of mice in Panel e (n=3 per group, p=0.039, Kruskal-Wallis ANOVA, significant comparison WT+exoKO vs KO+exoKO, Dunn’s post-hoc test). (h) ELISA of serum FGF21 of mice in Panel e. (n=3/group, p=0.027, Kruskal-Wallis ANOVA, significant comparison WT+exoKO vs KO+exoKO, Dunn’s post-hoc test). Error bars represent SEM.
In separate experiments, we injected WT and KO mice with KO exosomes with or without reconstitution of miR-99b (Figure 4e). Again, KO mice showed 2.5-fold higher luciferase activity than WT mice, when both were given KO exosomes. Administration of KO exosomes reconstituted with miR-99b in the AdicerKO re-induced suppression of the FGF21-3’-UTR reporter 45% of the way toward normal (Figure 4f). This was accompanied by a parallel reduction in hepatic FGF21 message (Figure 4g) and reduced circulating FGF21 (Figures 4h).
Regulation of Liver Gene Expression by Adipose-Produced Circulating Exosomal miRNAs
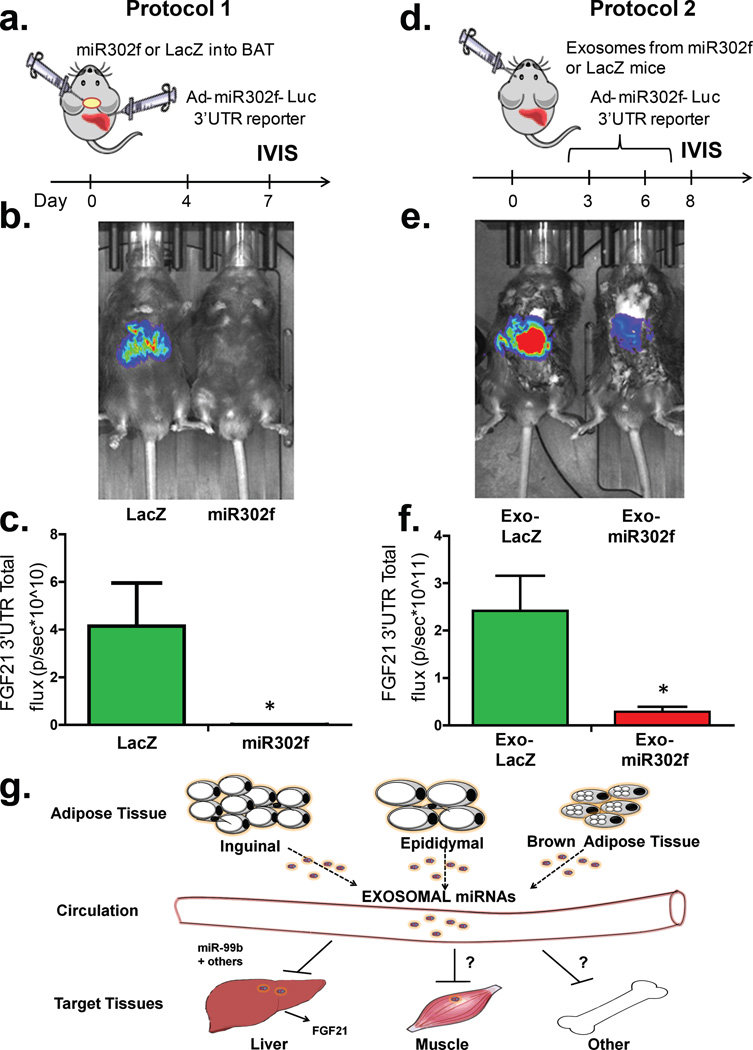
Regulation of FGF21 is a complex process, which involves multiple factors. To define the potential of adipose-derived circulating miRNAs in vivo, we developed a more specific reporter system taking advantage of the human-specific miRNA hsa_miR-302f and its 3’UTR reporter25, since this miRNA does not have a mouse homolog. We then performed two types of experiments. In the first protocol (Figure 5a) we injected adenovirus bearing pre-hsa_miR-302f or its control directly into BAT to get BAT-specific expression of the transduced gene26. Three days later, we injected the same mice intravenously (i.v.) with the adenovirus 3’-UTR luciferase reporter for hsa_miR-302f to get its expression in liver. Only if there was communication between the miRNA expressed in BAT and the reporter expressed in liver would we observe suppression of the reporter. Indeed, IVIS analysis 5 days after transduction revealed that in mice with Ad-hsa_miR-302f transduced in BAT there was a >95% reduction of luciferase activity in liver when compared to mice with LacZ-control transduced into BAT (Figures 5b and 5c).
Figure 5. BAT-derived exosomes expressing human miRNA miR-302f target their reporter in liver in vivo.
(a) Protocol 1. Schematic of in vivo targeting protocol using adenovirus bearing pre-miR-302f or LacZ directly into BAT. (b) C57Bl/6 mice injected i.v. with pacAd5-hsa_miR-302f 3’-UTR reporter after BAT injection of Ad-pre-hsa-miR-302f or Ad-LacZ subjected to IVIS (n=4 per group). (c) Total flux luminescence obtained via IVIS analysis from mice in Panel B. (n=4/group, p=0.028, Mann-Whitney U-test). (d) Protocol 2. Schematic of in vivo targeting protocol injecting exosomes from C57Bl/6 mice transduced with pre-miR-302f or adenovirus bearing LacZ directly into BAT. (e) C57Bl/6 mice transduced with pacAd5-hsa_miR-302f 3’-UTR reporter after i.v. injections of serum exosomes from Ad-pre-hsa_miR-302f or Ad-LacZ BAT injected mice and subjected to IVIS analysis (n=4 per group). (f) Total flux luminescence obtained from using protocol in panel e (n=4/group, p=0.028, two-tailed Mann-Whitney U-test). Bars represent SEM. (g) Model of mechanisms by which fat-derived circulating exosomal miRNAs might regulate target mRNAs in other tissues.
In protocol 2 (Figure 5d), to definitively address whether hsa_miR-302f suppression of its reporter in liver was contingent on exosomal delivery, we used two separate cohorts of C57Bl/6 mice. One cohort was transduced with adenovirus bearing pre-hsa_miR-302f or control-LacZ adenovirus directly into BAT. A second, separate cohort of mice was transduced in liver by i.v. injection of adenovirus bearing the 3’-UTR hsa_miR-302f reporter. We then obtained serum from the donor cohorts over the following 8 days, isolated exosomes, injected the purified exosomes intravenously into the acceptor mice, and we performed IVIS analysis of the hsa_miR-302f reporter in the acceptor mice. Compared to the mice receiving exosomes from the Ad-LacZ BAT transduced mice, acceptor mice injected with exosomes from Ad-hsa_miR-302f BAT transduced mice showed a 95% reduction of luciferase activity in the liver (Figures 5e and 5f), demonstrating direct regulation of this adipose-produced circulating miRNA on activity of its reporter in liver of recipient mice. This was not due to liver uptake of miR-302f adenovirus that might have leaked from BAT, since no viral DNA expressing miR-302f (or LacZ in controls) was detected in livers of the animals used in protocols 1 or 2 when subjected to qPCR for these sequences (Extended Data Figure 8c, CT values >40).
A New Role for Fat and Its Potential Implications
Taken together, our data show that adipose tissue is a major source of circulating exosomal miRNAs in both mice and humans. Our data also demonstrate that the circulating exosomal miRNAs derived from fat may act as regulators of whole-body metabolism and mRNA translation in other tissues. Thus, adipose tissue transplantation, especially BAT transplantation, improves glucose tolerance and lowers circulating insulin and FGF21 levels, as well as hepatic FGF21 mRNA in recipient mouse. The latter appears to be due, at least in part, to a direct effect of the circulating miRNAs on FGF21 translation in liver, as incubation of exosomes from control mice with liver cells in vitro can lower FGF21 mRNA levels and repress activity of a FGF21 3’-UTR reporter. This does not occur with exosomes isolated from ADicerKO mice, but can be reconstituted by introduction of miR-99b, a predicted regulator of murine FGF21. miR-99b is also one of the miRNAs that is highly reduced in circulating exosomes of ADicerKO mice, and one whose level is largely restored by BAT transplantation. Transplantation with WAT also significantly restored the level of miR-99b in circulating exosomes, but only BAT transplantation reduced hepatic FGF21 mRNA, suggesting that BAT-derived exosomes may more efficiently target the liver compared to WAT-derived exosomes. Such tissue targeting has been suggested by in vitro studies18,27, implying inter-organ exosomal delivery has tissue specificity28. The generalizability of this type of cross-talk between adipose tissue and liver mRNA regulation is made ever clearer by use of a miRNA reporter which is human specific. Hence, when mouse BAT is transduced with an adenovirus producing human-specific miRNA hsa_miR-302f, exosomes present in the circulation of that mouse can target an hsa_miR-302f 3’-UTR reporter in the liver of the same mouse or even a different mouse given isolated exosomes from this donor.
Since adipose tissue is a major source of circulating miRNAs, the loss of adipose-derived miRNAs in lipodystrophy and their restoration by fat transplantation may involve many targets and tissues in addition to hepatic FGF21. miRNAs that are restored with BAT transplantation include miR-325 and miR-743b (predicted to target UCP-1) and miR-98 (predicted to target PGC1α), suggesting that adipose tissue secreted miRNAs may have both paracrine and endocrine actions. This could contribute to other aspects of the phenotype of the ADicerKO mouse, including features of metabolic syndrome and “whitening” of interscapular BAT14. Regulation of metabolism and mRNA expression in lipodystrophy could also involve other exosomal factors contributed to the circulation by fat, as well as a range of non-exosomal mechanisms, including conventional adipokines and cytokines, as well as other hormones and metabolic intermediates29. What is clear from this study is that in addition to serving as markers of disease, exosomal miRNAs have potential for transfer to other tissues and serve a regulatory role30,31. In vitro, endothelial exosomes have been shown to target vascular cells inducing protection from apoptosis 32. Likewise, exosomes from mast cells in vitro can trigger other mast cells28, and exosomes secreted by macrophages and/or platelets can be taken up by monocytes31. Exosomal miRNA transfer has been also reported in glioblastoma 15,33 and between embryonic stem cells and embryonic fibroblasts34. While the majority of miRNAs in serum are in exosomes35, adipose tissue could also contribute to circulating miRNAs in microvesicles or associated with Argonaute36 or HDL37. To what extent these forms of circulating miRNAs can regulate gene expression in distant tissues remains to be determined.
In summary, our data show that a major source of circulating exosomal miRNAs is adipose tissue and that different adipose depots contribute different exosomal miRNAs to the circulation. Our data also show that these adipose-derived circulating miRNAs can have far-reaching systemic effects, including regulation of mRNA expression and translation. As a product of different adipose depots, these exosomal miRNAs could also change in level in diseases with altered fat mass, such as lipodystrophy and obesity, or altered adipose distribution and function, such as diabetes and aging. Thus, adipose-derived exosomal miRNAs constitute a novel class of adipokines that can be secreted by fat and act as regulators of metabolism in distant tissues providing a new mechanism of cell-cell crosstalk.
Materials and Methods
Exosome isolation, loading and immunoelectron microscopy
Murine and human sera were centrifuged at 1000 × g for 5 min and then at 10,000 × g for 10 min to remove whole cells, cell debris and aggregates. The serum was subjected to 0.1 µm filtration and ultracentrifuged at 100,000 × g for 1 h. Pelleted vesicles were suspended in 1xPBS, ultracentrifuged again at 100,000 × g for washing, resuspended in 1xPBS and prepared for electron microscopy and immunoelectron microscopy or miRNA extraction.
All in vitro experiments were carried out by using exosome-free FBS. AML-12 cells were acquired from ATCC (Manassas, VA) (cat # CRL-2254). For exosome loading, exosome preparations were isolated and diluted with PBS to final volume of 100 µl. Exosome electroporation was carried out by using a variation of a previously described technique38. Exosome preparations were mixed with 200 µl phosphate-buffered sucrose: 272 mM sucrose/7 mM K2HPO4 along with 10 nM of a miRNA mimic, and the mixture was pulsed at 500 mV and 250 µF resistance using a Bio-Rad Gene Pulser (Bio-Rad, Hercules, CA). Electroporated exosomes were resuspended in a total volume of 500ul PBS and added to the target cells.
Isolated exosomes were subjected to immunoelectron microscopy using standard techniques5. Briefly, exosome suspensions were fixed with 2% glutaraldehyde/0.15 M sodium cacodylate and post-fixed with 1% OsO4, dehydrated with ethanol, and embedded in Epon 812. Samples were sectioned, post-stained with uranyl acetate and lead citrate, and examined with an electron microscope. For immunoelectron microscopy, cells were fixed with 4% paraformaldehyde/2% glutaraldehyde/0.15 M sodium cacodylate and processed as above. Sections were probed with anti-CD63 (cat. nr. sc15363, Santa Cruz Biotechnology, Santa Cruz, CA), anti-CD9 (cat. nr. ab92726, Abcam, Cambridge, MA) antibodies or control rabbit IgG and visualized with immunogold-labeled secondary antibody. Immuno-EM analysis revealed that the isolated exosomes were 50–200 nM in diameter and stained positively for the tetraspanin exosome markers CD63 and CD939.
Exosome number estimation assay
Exosomal concentration was assessed using the EXOCET assay (System Biosciences, Mountain View, CA), which measured the esterase activity of cholesteryl ester transfer protein (CETP) activity. CETP is known to be enriched in exosomal membranes. The assay was calibrated using a known isolated exosome preparation (System Biosciences, Mountain View, CA). Additionally, exosome preparations were subjected to the qNano system employing the TRPS (Tunable Resistive Pulse Sensing) technology for measurement of number and size distribution of exosomes (IZON technologies, Cambridge, MA).
Serum miRNA isolation
For total serum miRNA isolation, 100 µl of serum was obtained from ADicerKO or Lox littermates and miRNAs were isolated using an Exiqon miRCURY Biofluid RNA isolation kit following the manufacturer’s protocol.
RNA isolation and real time PCR analysis
RNA was isolated from exosomal preparations using TRIzol, following the manufacturer’s protocol (Life Sciences, Grand Island, NY). Subsequently, 50 ng exosomal RNA were subjected to reverse transcription into cDNA by using a mouse miRNome profiler kit (System Biosciences, Mountain View, CA). qPCR was performed in 6 µl reaction volumes containing cDNA along with universal primers for each miRNA and SYBR Green PCR master mix (Bio-Rad, Hercules, CA).
Bioinformatics qPCR data analysis
In line with previous research, for all serum and exosomal miRNA quantitative PCR reactions the CT values were normalized using U6 as an internal control. For estimation of miRNA abundance in fat tissue, data were normalized using the global average of expressed CT values per sample40 since U6 itself was differentially expressed between depots. For all quantitative PCR reaction involving gene expression calculations of FGF21, normalization was carried out by using TBP as an internal control. Differential expression analysis of the high-throughput -ΔCT values was done with the Bioconductor limma package41 in the R software. Fold differences in comparisons were expressed as 2^-ΔΔCT. Principal Component Analysis (PCA) plots were created using the R software (www.r-project.org) with the ggplot2 package.
Heatmaps of miRNA expression
A detection threshold was set to CT of 34 for all mouse miRNA PCR reactions, whereas for the PCR of human miRNAs no threshold was used, as per manufacturer’s recommendation (System Biosciences, Mountain View, CA). A miRNA was plotted only if its raw CT value was ≤ 34 in at least three samples, except for the brown preadipocyte and 4-week-old mouse experiments where its raw CT only had to be ≤ 34 twice. miRNA -ΔCT values were z-scored and heatmap creation was then carried out by Cluster 3.0 and TreeView programs as previously described42.
Fat tissue transplantation
Fat tissue transplantation was carried out as previously described43. Briefly, 10-week-old male Lox donor mice were (C57BL/6 males) sacrificed, and their inguinal, epididymal, and BAT fat depots were isolated, cut into several small pieces of 20mg, and transplanted into 10-week-old male ADicerKO mice (5 mice per group; males). Each recipient ADicerKO mice received the equivalent transplanted fat mass of two donor Lox-control mice. Transplanted mice received analgesic intraperitoneal injections (buprenorphine, 50 mg/kg) post-surgically for 7 days. At day 12, glucose tolerance test was performed after 16 hours fasting by intraperitoneal injection of 2 g/kg glucose. All mice were sacrificed after 14 days. All procedures were conducted in accordance with the IACUC regulations.
Luciferase vectors and in vitro assays
An adenoviral FGF21 3’-UTR reporter was created by cloning the 3’-UTR of FGF21 into the pMir-Report vector. Subsequently, the luciferase-3’UTR fragment was cloned into the adenoviral vector pacAd5-CMV-IRES-GFP creating an adenovirus bearing the FGF21-3’UTR reporter. Hsa-miR-302f-3’-UTR was created by cloning the synthesized Luc-miR-302f-3’-UTR fragment (Genescript, Piscataway, NJ) in the Viral Power Adenoviral Expression System (Invitrogen, Carlsbad, CA). In vitro bioluminescence was measured via a dual luciferase kit (Promega, Sunnyvale, CA).
In vivo regulation of FGF21 experiments
8-week-old male ADicerKO or WT mice were injected i.v. with an adenovirus bearing the 3’-UTR of the FGF21 fused to the luciferase gene to create two groups of a liver reporter mice, one in the ADicerKO mice and one in the WT background. One day later, a third group of ADicerKO mice which had also been injected i.v. with an adenovirus bearing the 3’-UTR of the FGF21 fused to the luciferase gene, received an i.v. injection of exosomes isolated from the serum of WT mice. 24 hours later, in vivo luminescence of the FGF21 3’-UTR was measured using an IVIS imaging system (Perkin Elmer, Waltham, MA) by administering D-Luciferin (20 mg/kg) following the manufacturer’s protocol (Perkin Elmer, Waltham, MA).
For the second group, 8-week-old male ADicerKO or WT mice were also transduced by i.v. injection of an adenovirus bearing the 3’-UTR of the FGF21 fused to the luciferase gene. After 1 day, mice received an i.v. injection of exosomes isolated from the serum of either ADicerKO mice or ADicerKO mice reconstituted in vitro by electroporation with 10 nM miR-99b. 24 hours later, in vivo luminescence was measured using an IVIS imaging system by administering D-Luciferin (20 mg/kg) following the manufacturer’s protocol (Perkin Elmer, Waltham, MA).
BAT-derived exosomes expressing human miRNA targeting the liver
Protocol 1
On day 0, 8-week-old male C57Bl/6 mice were injected directly into BAT with an adenovirus bearing pre-hsa_miR-302f or an adenovirus bearing LacZ mRNA as control. Hsa_miR-302f is human specific and does not have a mouse homolog. This procedure was conducted under ketamine anesthesia. Four days later, the same mice were injected i.v. with an adenovirus bearing the 3’-UTR for this miR-302f in-frame with the Luciferase gene, thereby putting this human miRNA reporter in the liver of the mouse. Only if there was communication between the BAT produced miRNA and the liver would there be suppression of the miR-302f reporter. In vivo luminescence was measured on day 6 using an IVIS imaging system as described above.
Protocol 2
To assess specifically the role exosomal miR-302f in the regulation of its reporter in the liver, two separate cohorts of 8-week-old, male C57Bl/6 mice were generated: one cohort had the adenovirus bearing pre-miR-302f or LacZ injected directly into BAT (donor cohort) and a second cohort was transduced in the liver with an adenovirus bearing the reporter 3’-UTR of this miR-302f described above (acceptor cohort). Serum was obtained at days 3 and 6 from the donor cohorts, exosomes were isolated and injected i.v. into the acceptor mice on days 4 and 7 respectively. On day 8, in vivo luminescence was measured in the acceptor mice using an IVIS imaging system as described above.
Adenoviral DNA isolation
To test for adenoviral presence in livers and BAT of C57BL/6 mice, 100 mg of tissue was homogenized in 1ml of sterile 1xPBS. The homogenate was spun down, and 150 µl of cleared supernatant were used to isolate Adenoviral DNA using a Nucleospin RNA and DNA Virus kit following the manufacturer’s protocol (Takara, Mountain View, CA). PCR was performed on 2 µl of the isolated adenoviral DNA using SYBR green chemistry detecting LacZ or miR-302f amplicons.
qPCR fat tissue transplantation analysis
For all output for the fat tissue transplantation experiment, a miRNA was only considered present if its mean CT in the WT group was less than 34. We then identified those miRNAs that were significantly decreased in ADicerKO serum. For a miRNA to be considered restored after transplantation by a particular depot it had to be: 1) significantly increased from ADicerKO serum; 2) have a mean CT less than 34; and 3) its CT had to be more than half of the way from ADicerKO to WT on the CT scale.
Statistical analysis
Analysis of variance tests were followed by two-tailed Dunn’s post-hoc analysis or Tukey’s multiple comparisons test to identify statistically significant comparisons. All t-tests carried out were two-tailed. All Mann Whitney U-tests were two-tailed. P-values less than 0.05 were considered significant. All analysis of variance, t-tests, and area under the curve calculations were carried out by GraphPad Prism 5.0.
miRDB Analysis
For miRDB analysis (www.mirdb.org), a search by target gene was performed against the mouse database. A target score of 85 was set to exclude potential false positive interacting miRNAs.
Data and code availability
All high-throughput qPCR data (raw CT values), the code used to analyze it (in the free statistical software R), and its output (including supplemental tables, tables used to generate heatmaps, and statements in the text) can be freely downloaded and reproduced from https://github.com/jdreyf/fat-exosome-microrna.
Extended Data
Extended Data Figure 1.
(a) Electron microscopy of exosomes isolated from ADicerKO serum by differential centrifugation. (b) EXOCET ELISA assay measuring CETP protein in exosome samples, corresponding to isolated exosome number from serum of ADicerKO (KO) or littermate mice (Lox). (c) qNano assay measuring exosome numbers and size based on Tunable Resistive Pulse Sensing technology (IZON) from exosome preparations from ADicerKO or Lox mice. (d) Principle Component Analysis of exosomal miRNA levels in ADicerKO (KO) and Lox (WT), n=4 per group. Error bars represent SEM.
Extended Data Figure 2.
(a) Heatmap showing Z-scores of miRNA expression measurements from whole serum ADicerKO (KO) or littermate wild type mice (WT) and exosomal miRNAs from ADicerKO (KO) or littermate wild type mice (WT) (n=4 per group). (b) Heatmap showing Z-scores of miRNA expression measurements of exosomal miRNAs from culture supernatant of Dicerfl/fl preadipocytes transduced with Ad-GFP (GFP) or Ad-CRE(CRE) (n=3 per group). (c) Heatmap showing Z-scores of miRNA expression measurements of exosomal miRNAs from serum of 4-week old ADicerKO (ADicerKO) and Lox (Control) mice (n=3 per group).
Extended Data Figure 3.
(a) Demographic information of human patients with HIV lipodystrophy (HIV), congenital generalized lipodystrophy (CGL) or normal subjects. (b) EXOCET ELISA assay measuring CETP protein as a measure of exosome number from isolated from human sera of individuals with HIV Lipodystrophy, congenital generalized lipodystrophy (CGL) and normal subjects (n=4 per group). (c) Principle Component Analysis of exosomal miRNA expression in HIV Lipodystrophy, CGL, and control subjects, n=4 per group. Error bars represent SEM.
Extended Data Figure 4.
(a) Principle Component Analysis of miRNA expression in mouse fat depots: epididymal (Epi), inguinal (Ing), and brown adipose tissue (BAT), n=4 per group. (b) Weights of the transplanted epididymal (Epi), inguinal (Ing), and brown adipose tissue (BAT) at time of transplantation into ADicerKO mice (white bars) and at time of sacrifice (black bars), n=3 (c) Weights of ADicerKO mice undergoing sham surgery (SAL) or with transplanted epididymal (Epi), inguinal (Ing), or brown adipose tissue (BAT) and Lox (WT) mice. Error bars represent SEM.
Extended Data Figure 5.
(a) Principle Component Analysis of serum exosomal miRNA levels in ADicerKO after sham surgery (Sham) or transplantation with inguinal fat (ING), with epididymal fat (EPI) or BAT, and Lox controls (WT), n=4 per group. (b) Circulating insulin and adipokine levels in WT, ADicerKO, or transplanted ADicerKO mice (n=3 per group, two-tailed t-test, p<0.05).
Extended Data Figure 6.
(a) FGF21 mRNA levels as assessed by qPCR in liver (LIV), BAT, inguinal (Ing), epididymal (Epi), pancreas (Panc), kidney (Kidn), and quadriceps muscle (Quad) of ADicerKO (black bars) or Lox (white bars) (n=4 per group, p=0.0286, two-tailed Mann Whitney U test). (b) Relative abundance (log2FC) as assessed by qPCR of miR-99a, miR-99b, and miR-100 in exosomes from ADicerKO undergoing fat transplantation surgery compared to sham, n=4 per group.
Extended Data Figure 7.
(a) FGF21 3’UTR luciferase activity in murine liver cells (AML-12) following introduction of miR-99a, miR-99b, miR-100 or miR-466i (10 nM of miRNA mimic) by direct electroporation (n=3 per group, p=0.003, two-tailed t-test). (b) FGF21 mRNA abundance in murine liver cells (AML-12) following transduction with miRNA mimics of miR-99a, miR-99b, miR-100 or miR-466i (10 nM) (n=3 per group, p=0.037, two tailed t-test). (c) Hepatic FGF21 mRNA levels by qPCR followed by 48 hrs incubation of AML-12 hepatic cells with exosomes derived from ADicerKO or Lox littermates (WT) mice or with ADicerKO-isolated exosomes electroporated with 10nM of miR-99a, miR-99b, miR-100 or miR-466i (n=3 per group, p=0.0001, two-tailed t-test). Error bars represent SEM.
Extended Data Figure 8.
(a) qPCR of mature miR-16, miR-201, and miR-222 in liver of Lox mice (WT), ADicerKO mice (KO), and ADicerKO transplanted with BAT (KO+BAT) (n=3 per group, p=0.02 for miR-16, p=0.002 for miR-201, and p=0.028 for miR-222; one-way Analysis of variance. Significant comparisons were identified by Tukey’s multiple comparisons test). (b) qPCR of pre-miR-16, pre-miR-201, and pre-miR-222 abundance in liver of Lox mice (WT), ADicerKO mice (KO), and ADicerKO transplanted with BAT (KO+BAT) (n=3 per group, p<0.05, one-way analysis of variance). (c) CT values of qPCR of Adenoviral DNA isolated from BAT-p1 and liver-p1 (experimental protocol 1) and liver-p2 (experimental protocol 2) detecting Adenoviral LacZ or pre-miR-302f (n=4 per group). Error bars represent SEM.
Supplementary Material
Acknowledgments
We thank M. Torriani and K.V. Fitch for assistance with HIV lipodystrophy samples, M. Lynnes, S. Kasif, and A. M. Cypess for help with reagents and helpful discussions. We thank the Joslin Histology, Media and Physiology Core Facilities for help with experiments. This study was supported by grants from the NIH R01 DK082659 and R01 DK033201, the Mary K. Iacocca Professorship, and the Joslin Diabetes Center DRC Grant P30DK036836. MAM was funded by grants from FAPESP (2010/52557-0 and 2015/01316-7).
Footnotes
The authors declare no competing financial interest.
Author Contributions
MAM assisted with experimental design, generated the ADicerKO mice and designed the Ad-Luc-FGF213’UTR constructs, JMD carried out bioinformatics analysis, MK performed Adenoviral injections in BAT, MS assisted with retro-orbital injections, CW created Ad-LacZ, Ad-pre-hsa-miR302f and Ad-Luc-miR302f-3’UTR Adenoviruses, TNT assisted with retroorbital and tail vain injections, JNW assisted with fat depot miRNA PCR, RG-M assisted with IVIS experiments and in vitro luminescence assays, SKG provided human HIV lipodystrophy sera samples, PG provided human CGL sera samples, TT and CRK designed the study, collected and analyzed data, and wrote the manuscript.
References
- 1.Krol J, Loedige I, Filipowicz W. Nat Rev Genet. 11(9):597. doi: 10.1038/nrg2843. [DOI] [PubMed] [Google Scholar]
- 2.Sun L, et al. Nat Cell Biol. 13(8):958. doi: 10.1038/ncb2286. [DOI] [PMC free article] [PubMed] [Google Scholar]; Bartel DP. Cell. 2009;136(2):215. doi: 10.1016/j.cell.2009.01.002. [DOI] [PMC free article] [PubMed] [Google Scholar]; Ameres SL, Zamore PD. Nat Rev Mol Cell Biol. 14(8):475. doi: 10.1038/nrm3611. [DOI] [PubMed] [Google Scholar]
- 3.Trajkovski M, et al. Nature. 474(7353):649. doi: 10.1038/nature10112. [DOI] [PubMed] [Google Scholar]
- 4.Arroyo JD, et al. Proc Natl Acad Sci U S A. 108(12):5003. doi: 10.1073/pnas.1019055108. [DOI] [PMC free article] [PubMed] [Google Scholar]
- 5.Thery C, Amigorena S, Raposo G, Clayton A. Curr Protoc Cell Biol. 2006 doi: 10.1002/0471143030.cb0322s30. Chapter 3, Unit 3 22. [DOI] [PubMed] [Google Scholar]
- 6.Gyorgy B, et al. Cell Mol Life Sci. 68(16):2667. doi: 10.1007/s00018-011-0689-3. [DOI] [PMC free article] [PubMed] [Google Scholar]
- 7.Hata A, Lieberman J. Sci Signal. 8(368):re3. doi: 10.1126/scisignal.2005825. [DOI] [PubMed] [Google Scholar]
- 8.Dumortier O, Hinault C, Van Obberghen E. Cell Metab. 18(3):312. doi: 10.1016/j.cmet.2013.06.004. [DOI] [PubMed] [Google Scholar]
- 9.Arner E, et al. Diabetes. 61(8):1986. doi: 10.2337/db11-1508. [DOI] [PMC free article] [PubMed] [Google Scholar]
- 10.Capobianco V, et al. J Proteome Res. 11(6):3358. doi: 10.1021/pr300152z. [DOI] [PubMed] [Google Scholar]
- 11.Caroli A, Cardillo MT, Galea R, Biasucci LM. J Cardiol. 61(5):315. doi: 10.1016/j.jjcc.2013.01.012. [DOI] [PubMed] [Google Scholar]
- 12.Guay C, et al. Transl Res. 157(4):253. doi: 10.1016/j.trsl.2011.01.009. [DOI] [PubMed] [Google Scholar]
- 13.Mori MA, et al. Cell Metab. 16(3):336. doi: 10.1016/j.cmet.2012.07.017. [DOI] [PMC free article] [PubMed] [Google Scholar]
- 14.Mori MA, et al. J Clin Invest. 124(8):3339. doi: 10.1172/JCI73468. [DOI] [PMC free article] [PubMed] [Google Scholar]
- 15.Skog J, et al. Nat Cell Biol. 2008;10(12):1470. doi: 10.1038/ncb1800. [DOI] [PMC free article] [PubMed] [Google Scholar]
- 16.Taylor DD, Zacharias W, Gercel-Taylor C. Methods Mol Biol. 728:235. doi: 10.1007/978-1-61779-068-3_15. [DOI] [PubMed] [Google Scholar]
- 17.Escola JM, et al. J Biol Chem. 1998;273(32):20121. doi: 10.1074/jbc.273.32.20121. [DOI] [PubMed] [Google Scholar]
- 18.Fevrier B, Raposo G. Curr Opin Cell Biol. 2004;16(4):415. doi: 10.1016/j.ceb.2004.06.003. [DOI] [PubMed] [Google Scholar]
- 19.Ortega FJ, et al. PLoS One. 5(2):e9022. doi: 10.1371/journal.pone.0009022. [DOI] [PMC free article] [PubMed] [Google Scholar]; Oger F, et al. J Clin Endocrinol Metab. 99(8):2821. doi: 10.1210/jc.2013-4259. [DOI] [PubMed] [Google Scholar]
- 20.Chou WW, et al. Cell Physiol Biochem. 32(1):127. doi: 10.1159/000350131. [DOI] [PubMed] [Google Scholar]
- 21.Keller P, et al. BMC Endocr Disord. 11:7. doi: 10.1186/1472-6823-11-7. [DOI] [PMC free article] [PubMed] [Google Scholar]
- 22.McGregor RA, Choi MS. Curr Mol Med. 11(4):304. doi: 10.2174/156652411795677990. [DOI] [PMC free article] [PubMed] [Google Scholar]
- 23.Potthoff MJ, Kliewer SA, Mangelsdorf DJ. Genes Dev. 26(4):312. doi: 10.1101/gad.184788.111. [DOI] [PMC free article] [PubMed] [Google Scholar]; Badman MK, et al. Cell Metab. 2007;5(6):426. doi: 10.1016/j.cmet.2007.05.002. [DOI] [PubMed] [Google Scholar]
- 24.Wong N, Wang X. Nucleic Acids Res. 43(Database issue):D146. doi: 10.1093/nar/gku1104. [DOI] [PMC free article] [PubMed] [Google Scholar]
- 25.Yao Y, et al. Mol Med Rep. 2009;2(6):963. doi: 10.3892/mmr_00000199. [DOI] [PubMed] [Google Scholar]
- 26.Uhrig-Schmidt S, et al. PLoS One. 9(12):e116288. doi: 10.1371/journal.pone.0116288. [DOI] [PMC free article] [PubMed] [Google Scholar]
- 27.Atai NA, et al. J Neurooncol. 115(3):343. [Google Scholar]
- 28.Zech D, Rana S, Buchler MW, Zoller M. Cell Commun Signal. 10(1):37. doi: 10.1186/1478-811X-10-37. [DOI] [PMC free article] [PubMed] [Google Scholar]
- 29.Valadi H, et al. Nat Cell Biol. 2007;9(6):654. doi: 10.1038/ncb1596. [DOI] [PubMed] [Google Scholar]
- 30.Bluher M. Mol Metab. 3(3):230. doi: 10.1016/j.molmet.2014.01.005. [DOI] [PMC free article] [PubMed] [Google Scholar]
- 31.Thery C, Ostrowski M, Segura E. Nat Rev Immunol. 2009;9(8):581. doi: 10.1038/nri2567. [DOI] [PubMed] [Google Scholar]; Bang C, et al. J Clin Invest. 124(5):2136. doi: 10.1172/JCI70577. [DOI] [PMC free article] [PubMed] [Google Scholar]; Hergenreider E, et al. Nat Cell Biol. 14(3):249. doi: 10.1038/ncb2441. [DOI] [PubMed] [Google Scholar]; Mittelbrunn M, et al. Nat Commun. 2:282. doi: 10.1038/ncomms1285. [DOI] [PMC free article] [PubMed] [Google Scholar]
- 32.Ismail N, et al. Blood. 121(6):984. doi: 10.1182/blood-2011-08-374793. [DOI] [PMC free article] [PubMed] [Google Scholar]
- 33.Zernecke A, et al. Sci Signal. 2009;2(100):ra81. doi: 10.1126/scisignal.2000610. [DOI] [PubMed] [Google Scholar]
- 34.van der Vos KE, et al. Neuro Oncol. 18(1):58. doi: 10.1093/neuonc/nov244. [DOI] [PMC free article] [PubMed] [Google Scholar]
- 35.Yuan A, et al. PLoS One. 2009;4(3):e4722. doi: 10.1371/journal.pone.0004722. [DOI] [PMC free article] [PubMed] [Google Scholar]
- 36.Gallo A, Tandon M, Alevizos I, Illei GG. PLoS One. 7(3):e30679. doi: 10.1371/journal.pone.0030679. [DOI] [PMC free article] [PubMed] [Google Scholar]
- 37.Turchinovich A, Weiz L, Langheinz A, Burwinkel B. Nucleic Acids Res. 39(16):7223. doi: 10.1093/nar/gkr254. [DOI] [PMC free article] [PubMed] [Google Scholar]
- 38.Vickers KC, et al. Nat Cell Biol. 13(4):423. doi: 10.1038/ncb2210. [DOI] [PMC free article] [PubMed] [Google Scholar]
Additional References
- 38.Tian Y, et al. Biomaterials. 35(7):2383. doi: 10.1016/j.biomaterials.2013.11.083. [DOI] [PubMed] [Google Scholar]
- 39.Mathivanan S, Fahner CJ, Reid GE, Simpson RJ. Nucleic Acids Res. 40(Database issue):D1241. doi: 10.1093/nar/gkr828. [DOI] [PMC free article] [PubMed] [Google Scholar]
- 40.Mestdagh P, et al. Genome Biol. 2009;10(6):R64. doi: 10.1186/gb-2009-10-6-r64. [DOI] [PMC free article] [PubMed] [Google Scholar]
- 41.Smyth GK. Stat Appl Genet Mol Biol. 2004;3 doi: 10.2202/1544-6115.1027. Article3. [DOI] [PubMed] [Google Scholar]
- 42.Eisen MB, Spellman PT, Brown PO, Botstein D. Proc Natl Acad Sci U S A. 1998;95(25):14863. doi: 10.1073/pnas.95.25.14863. [DOI] [PMC free article] [PubMed] [Google Scholar]
- 43.Tran TT, Yamamoto Y, Gesta S, Kahn CR. Cell Metab. 2008;7(5):410. doi: 10.1016/j.cmet.2008.04.004. [DOI] [PMC free article] [PubMed] [Google Scholar]
Associated Data
This section collects any data citations, data availability statements, or supplementary materials included in this article.
Supplementary Materials
Data Availability Statement
All high-throughput qPCR data (raw CT values), the code used to analyze it (in the free statistical software R), and its output (including supplemental tables, tables used to generate heatmaps, and statements in the text) can be freely downloaded and reproduced from https://github.com/jdreyf/fat-exosome-microrna.


