

Abstract
This paper presents a design study of a single photon emission microscope (SPEM) system for small animal imaging using I-125 labelled radiotracers. This system is based on the use of a very-high resolution gamma camera coupled to a converging non-multiplexing multiple pinhole collimator. This enables one to “zoom” into a small local region inside the object to extract imaging information with a very high spatial resolution and a reasonable sensitivity for gamma rays emitted from this local region. The SPEM system also includes a pinhole (or multiple pinhole) gamma camera that has a full angular coverage of the entire object. The designed imaging spatial resolution for the SPEM system is between 250 μm to 500 μm FWHM.
Index Terms: Converging non-multiplexing multiple pinhole aperture, microscope, very-high spatial resolution gamma camera
I. Introduction
Pinhole and multiple pinhole gamma cameras are widely used for imaging the distribution of radio-labeled molecules in small lab animals [1]–[5]. One of the advantages of SPECT imaging is that it is possible to achieve a spatial resolution superior to that achievable with Positron Emission Tomography (PET). However, high resolution SPECT imaging has long been questioned for its lack of raw sensitivity, which limits its use for quantitative studies. Detectors with 1–2 mm intrinsic resolution has been used to achieve a sub-millimeter resolution in reconstructed SPECT volume-images [6]–[10]. These systems, in general, require the use of apertures having a relatively small number of micro pinholes. In recent years, advances in detector technology have pushed the intrinsic spatial resolution of gamma ray detectors down to a few hundred microns or even lower. Several groups have developed or proposed imaging systems based on these newly developed sensors [11]–[13]. The improved intrinsic spatial resolution allows one to pack more pinholes in the aperture and projection overlapping can be minimized by placing the aperture closer to detector. For example, Beekmen et al. proposed an ultra-high resolution system that consists of a large number of high resolution detectors and a multiple pinhole collimator for small animal study [14].
In this paper, we present the design of a single photon emission microscope (SPEM) system for imaging I-125 labeled radiotracers in small animals. It is essentially a dual-head SPECT system that consists of two cameras with different intrinsic spatial resolutions and fields-of-view (FOV). The very high resolution gamma camera is based on the use of an electron multiplying charge-coupled device (EMCCD) and a converging non-multiplexing multiple pinhole collimator to focus onto a small sub-region inside the object. It provides not only a very high spatial resolution but also a reasonable detection efficiency for gamma rays emitted from this sub-volume. This approach is similar, in nature, to the stationary version of U-SPECT-III system [14]. The SPEM system also includes another camera head that has a slightly lower resolution but a much higher sensitivity and a full angular coverage of the entire object. It helps to overcome the problem of limited field-of-view (FOV) associated with the very high resolution camera head. Another common way for solving the problem of limited angular coverage in SPECT systems with focusing geometry is to translate the object in respect to the camera system. Beekman et al., in their U-SPECT-I design, proposed to use such movements to achieve a larger FOV [13]. Lackas et al. proposed the so-called T-SPECT approach. The object is again translated linearly during data acquisition to provide multiple projection data sets, taken with different object-to-pinhole distances and different focusing geometries. This approach allows one to reconstruct tomographic images without rotating the object or the camera system [15].
The goal of this paper is to present (a) the design of a very high resolution gamma ray detector for I-125 imaging, (b) some design considerations and preliminary experimental results and (c) the design of the SPEM system along with Monte Carlo and analytical studies for evaluating its imaging performance.
II. Materials and Methods
A. Very-High Resolution Gamma Camera
The key to the SPEM system is a very-high resolution gamma camera currently under development in our lab. It uses the newly developed electron multiplying charge-coupled device (EMCCD) sensors. These sensors are similar, in structure, to conventional CCDs except that a series of multiplying registers are added before the readout amplifier. These multiplying registers amplify the charge signal by a factor of up to several tens of thousand through “impact ionization” [16], [17]. This effectively eliminates the readout electronic noise associated with conventional CCDs (especially with fast-scan CCDs). EMCCDs can offer a readout rate of up to 20 MHz, whilst having an effective readout noise of <1 electrons RMS per pixel. As a comparison, standard CCDs at similar readout rates would have a readout noise around 30 electrons or more.
The combination of the high spatial resolution, high frame rate and low effective readout noise has made the EMCCD a promising device for gamma ray imaging applications. Several groups have proposed or experimentally tested imaging systems based on this device. Unfortunately, currently available sensors are relatively small (typically 8 × 8 mm2 in size). To construct a detector with a reasonable active area, Nagarkar et al. have developed [18] a detector system that used an optical lens to couple a scintillation array to an EMCCD device. The major limitation of this design is the low coupling efficiency between the scintillator and the EMCCD sensor, which was measured to be 0.7–0.07%. For our applications (of imaging at ~30 keV), each gamma ray stopped in the phosphor produces only a few hundred photons. After coupling to the EMCCD sensor, the remaining photons may also be shared between several CCD pixels, which further reduces the signal-to-noise ratio per pixel. The coupling efficiency can be improved by using fiber tapers [11], [12]. For example, a 4:1 taper coupled to the sensor would bring the active area up to 32 × 32 mm2 and provide an effective light transmission of <5%. However, this coupling efficiency is still too low for reliably detecting single X/gamma ray interactions with an energy deposition of ~30 keV. Furthermore, using tapers with aspect ratios greater than 3:1 would also introduce considerable optical distortions.
In our detector design, we used an electrostatic de-magnifier (DM) tube, instead of fiber tapers or relay lenses, for coupling scintillation light onto the EMCCD sensor. The DM tube is essentially a first generation image intensifier [19], which has a quantum efficiency (QE) of ~10% at around 550 nm wavelength. A schematic of the gamma camera is shown in Fig. 1. In our prototype device, a Gadox phosphor is used for converting the 27–35 keV X/Gamma rays into visible photons. The EMCCD sensor used is the E2V 97 series L3 Vision Electron Multiplication CCD [20], incorporated in a special camera housing fabricated by Andor Technologies [21]. It uses water cooling to maintain an operating temperature of −40°C. This sensor is a back-illuminated frame transfer device. It has 512 × 512 pixels and each pixel is 16 × 16 μm2. It operates at up to 10 MHz so that an effective frame rate of 32 fps can be achieved at full resolution. Several design considerations were given as the following.
Fig. 1.

Very high resolution gamma camera based on the EMCCD detector.
Active area. The effective active area is simply the active area of the EMCCD sensor multiplied by the magnification factor of the DM tube. In our prototype device, the effective active area on the phosphor is ~50 × 50 mm2. We can further extend the active area to cover up to 80 mm diameter, by using a larger DM ratio. This will leave a minimum dead area of ~1.5 cm wide around the detection area.
Signal-to-noise ratio. For each 27–35 keV photon energy deposited in the phosphor, ~10 photoelectrons are generated on the photocathode of the DM tube, which gives ~600 photons at its output. Given the signal multiplications in the EMCCD sensor, the readout electronic noise becomes negligible. The major noise contribution is the dark count thermally generated on the photocathode of the DM tube, at a rate of 30–40 counts/cm2·sec. Because of the high frame rate available, the dark counts are most likely to be single photoelectrons and they are spreading over the entire FOV. With a sufficiently high EM gain, one can easily set a threshold above a single photoelectron level to reject these dark counts without losing true events, which ensures a near perfect X/gamma ray photon-counting capability. An example of detected X/Gamma ray events is shown in Fig. 2. Some experimentally measured energy spectra are shown in Fig. 3. It is clear that a relatively high EM gain (~200) is needed for a high photon-counting efficiency [22].
Intrinsic spatial resolution. It is primarily limited by the light spreading in the phosphor and the spatial resolution of the DM tube. Due to the polycrystalline structure of the Gadox phosphor, a certain light spread (say ~100 μm FWHM) is expected. This results in a spreading of photoelectrons onto an area of 3 × 3 pixels or larger on the EMCCD sensor. To determine the locations of X/gamma ray interactions, we first identified peak positions in the image and then defined a 5 × 5 (or 3 × 3) pixel area around each peak position. The interaction locations are estimated by centroiding over these regions. The measured intrinsic spatial resolutions are shown in Table I [22]. Note that the intrinsic spatial resolution of this detector system can be further improved by the use of EMCCD sensors with a higher resolution, a DM tube with smaller demagnification ratios and scintillation screens that have better-controlled light spreading.
Event overlapping. In a single X/Gamma ray photon counting device, event overlapping within the same frame will result in loss of true events and errors in event positioning. This effect needs to be minimized. Fortunately, high resolution SPECT imaging normally requires the use of tiny pinholes, which dramatically cuts down the number of photons reaching the detector. For the SPEM system, we assumed that the maximum event rate would be a few thousand counts per second over the entire detector (5 × 5 cm2 in size). The high frame rate of the EMCCD sensor and the fact that each sub-region on the detector can only see through a single pinhole also help to minimize the probability of event overlapping. To verify this, we used a Monte Carlo program (described in Section II-C) to derive the projection data. We simulated a cylindrical phantom of 2 cm diameter and 2 cm long, uniformly filled with 10 mCi activity. The axis of the cylinder was 2 cm from the aperture. Note that for most applications that we are targeting at [23]–[25], the total activity injected in mouse seldom exceeds 500 μCi and the target-to-background ratio is typically well below 5:1. So this simulation represents a worst case scenario for testing the count rate capability of this system. The aperture used was identical to that described in Section II-C, which has sixteen 100 μm diameter pinholes. A mean projection from a single view angle after 1 second exposure is shown in Fig. 4. It contains ~1600 detected events. With a readout speed of 100 frame/sec, the mean number of counts per frame is ~16. Suppose that the signal generated by each interaction typically spreads over 5 × 5 pixels, the area occupied by all 16 events is only ~0.15% of the total active area of the detector. Note that with the use of the converging non-multiplexing aperture, the distribution of these counts is fairly uniform across the entire detector. In this case, the chance of event-overlapping should be negligible. For high count rate applications, one can use 4 × 4 or even 8 × 8 binning to improve the readout speed and further reduce the probability of event overlapping. From these, we conclude that the intensified EMCCD camera should provide an adequate count rate capability for applications outlined in [23]–[25].
Fig. 2.

Detected I-125 X/Gamma ray events using the EMCCD/DM camera with different EM gains. Note that with an gain of 200, readout electronic noise becomes negligible.
Fig. 3.

Measured spectra for noise events only and true interactions plus the noise.
TABLE I.
Measured Intrinsic Spatial Resolution
| EMCCD Binning | Readout Frame Rate (fps) | Optical Pixel Size (μm) | FWHM (μm) | FWTM (μm) |
|---|---|---|---|---|
| 512×512 | 32 | 96 | 60 | 123 |
| 256×256 | 54 | 192 | 92 | 190 |
| 128×128 | 95 | 384 | 109 | 227 |
Fig. 4.

Mean projection of a cylindrical phantom uniformly filled with 10 mCi activity.
B. Single Photon Emission Microscope System
The SPEM system consists of an EMCCD based camera and a gamma camera built around position sensitive photomultiplier tubes (PSPMT). The EMCCD camera has an active area of 5 × 5 cm2 as we described in previous sections. It uses a converging multiple pinhole aperture, which is focused to a sub-volume inside the object. In order to eliminate the overlapping of projections through these openings, we inserted thin Molybdenum thin sheets of ~0.5 mm between the multiple pinhole aperture and the detector. These inserts effectively divide the detector’s active area into multiple rectangular regions, each of them is allowed to “see” photons coming through a single pinhole in the aperture. In our prototype detector, we used an aperture with a 4 × 4 array of pinholes focused to the center region of the object. The molybdenum inserts introduced a dead area of ~6% on the detector head. Some actual geometrical parameters are also shown in Fig. 5. The PSPMT based camera has an active area of ~12.5 × 12.5 cm2 coupled to an array of NaI(Tl) crystals. Each individual element in the array is ~2 × 2 × 6 mm3 with a ~0.2 mm spacing between pixels. The reasons for choosing such a configuration are the following. Although EMCCD is a promising device for high resolution gamma ray imaging, its application is currently limited by the availability of larger format sensors. Constructing a complete SPECT system based solely on the EMCCD detectors is impractical at the present time. Our approach is to develop an EMCCD based high resolution camera heads as an add-on unit to existing gamma cameras. It could provide very high resolution imaging information on a small pre-defined sub-volume. The restricted FOV allowed us to pack a large number of pinholes for achieving a reasonable detection efficiency without multiplexing. The PSPMT based camera is used to provide a substantially higher sensitivity and a full angular coverage for the entire object. This helps in image reconstruction by allowing a relatively accurate estimation of the amount of activity in the surrounding region that could contribute to the projection data collected by the high resolution detector. One possible application for the SPEM system is to use it for detailed studies post high throughput screening using commercial scanners (such as the X-SPECT [26]). For this case, the full angular coverage of the lower resolution camera is necessary for referencing the SPEM images to pre-acquired X-SPECT images.
Fig. 5.

Proposed gamma ray microscope along with a conventional single/multiple pinhole camera.
C. Monte Carlo Study
In order to evaluate the performance of this detector, we simulated an imaging system with geometry specified in Fig. 5. In this simulation, two detectors were modeled. Detector 1 is the EMCCD based camera. It uses a thin film made of dense scintillator of ~150 μm thick. The scintillator simulated was equivalent to LSO in terms of density and chemical composition which provides stopping power of 64% and 87% for the 35 keV and 27 keV gamma rays respectively. Note that we did not simulate the self-radioactivity from lutetium as in true LSO scintillator. In the simulation, we used a spatial resolution ranging from 25 μm to 100 μm FWHM (introduced as Gaussian blurring). Depth-of-interaction (DOI) effect was not modeled. Detector 2 simulated is similar to the system described by McElroy et al. [2]. In the following study, we used a fixed pinhole size of 0.5 mm diameter for the lower resolution camera. For I-125 X/gamma rays, the detector has a detection probability of 90% (the ~ 10% loss is mainly due to inter-crystal fillings). In NaI(Tl) crystal, >95% of the 27 keV photons will be stopped in the first mm and the stopping power for the 35keV photons is ~3 times higher. We therefore ignored the DOI effect in this detector in the simulation.
Both simulated apertures were made of tungsten sheet of 1 mm thick. The pinholes are made with a sharp knife edge and a 45 degree acceptance angle. Attenuation of photons by the collimator was modeled, which includes the effect of the varying thickness on the knife edge. This is done with a numerical ray tracing code that we developed in our previous studies [27]. It was carefully checked with Monte Carlo simulation. Because of the low photon energies, we also ignored all Compton scattering in collimators. The object simulated was cylindrical and filled with water equivalent media and radioactivity according to certain distributions. The object was rotated for 360 degrees (with 32 angular steps) during data acquisition. Images were reconstructed by post filtering OSEM solutions. This helped to achieve a relatively uniform spatial resolution across the FOV. The filter used was 3-D Gaussian functions of various widths.
D. Analytical Study of Image Quality
A major drawback of the Monte Carlo approach is that we need a large number of data realizations and reconstructions to evaluate the noise in reconstructed images. For comparing many possible system configurations, this would require a very large amount of computation. To overcome this difficulty, we employed an analytical method for quantitative analysis of the detector performances. It uses the Uniform Cramer-Rao Bound (UCRB) for studying the estimator resolution/variance tradeoffs, which was developed with several variants over the past several years [28], [29]. For comparing different imaging systems, we restrict the point spread function (PSF) in the reconstructed images to be very similar to 3-D Gaussian functions, so that similar FWHM values would truly give similar spatial resolution properties in reconstructed images. Different imaging systems were compared based on the minimum achievable noise level at several given spatial resolutions. Here we provide a brief description of this approach, whilst a detailed derivation can be found in [30].
Let x = [x1, x2, …, xN]T ∈ RN denote the set of unknown parameters, e.g., object intensities underlying the projection data y. The transformation from x to observation y is described by a conditional probability density function p(y; x). Let x̂j be an estimator for a pixel of interest xj, mean of the estimator is
| (1) |
We define a gradient vector of the mean estimator of the jth parameter, respect to the underlying model parameters as
| (2) |
Note that although gj is not exactly the point-spread function, it describes how the perturbations on all image pixels are coupled to the target pixel through the reconstruction process, which is similar in nature to the true point-spread function. In order to compare different systems, we first defined a spatial resolution constraint that enforce the mean gradient function gj to be “similar” to a pre-defined target spatial resolution function f. This constraint is applied by defining a similarity measure and letting the resulted similarity satisfies the following constraint:
| (3) |
where δ is the threshold that defines the degree of similarity between f and g.||.|| is the Euclidean norm of a vector so that
| (4) |
where C is a symmetric positively definite matrix. In this study, we chose to make the target mean gradient function f a Gaussian function. By specifying a very small δ, all estimators satisfy such constraint produce nearly identical point spread functions, regardless the reconstruction method and actual imaging system used. Given a fixed system configuration, the minimum achievable variance for estimating xj is given by the Uniform Cramer–Rao bound (UCRB)
| (5) |
and the optimum estimator achieving this bound will have a mean gradient function
| (6) |
where J is the Fisher Information Matrix (FIM) [16]. Similarly, we can derive the optimum local impulse function (LIR) for the jth pixel is
| (7) |
These results allow one to rank different imaging systems by comparing the minimum achievable variance at given spatial resolutions.
Note that deriving quantities at the left hand side of (5) and (7) requires the inversion of J. For systems that we are studying, this matrix inversion is a very computationally expensive task due to the large number of detector and source pixels. To overcome this problem, we used the locally shift-invariant approximation proposed by Fessler et al. [31], [32]. It assumed that as far as local imaging property is concerned, the FIM can be treated as shift-invariant. We can therefore approximate J as a block-circulant matrix and use discrete Fourier transform (DFT) for its inversion. This approach was used extensively in the context of emission tomography [33], [34], which leads to a dramatic decrease in the amount of computation required.
III. Results
A. Monte Carlo Study
In this study, we compared the imaging performance of the proposed SPEM system with a single pinhole camera similar to the A-SPECT [2]. The two systems are mounted around the object with geometry identical to Fig. 5. A cylindrical object of 1.2 cm diameter and 1.2 cm long was simulated with a pixels size of 125 × 125 × 125 μm3. Hot rods were inserted with their axis parallel to the axis of the object cylinder. The diameters of these hot rods were 0.25 mm, 0.35 mm, 0.5 mm, 0.75 mm, 1 mm and 1.2 mm respectively for the six groups and their relative positions are shown in Fig. 6. The hot rods were filled with an activity concentration 10 times higher than the background level. The total radioactivity simulated is ~1.5 mCi/cc and the total imaging time was 64 minutes (2 minutes at each view angle). The source object was first reconstructed with the standard OSEM algorithm [35], [36] using 32 subsets. Each subset contains the projection data acquired at one of the 32 view angles. OSEM solutions were then filtered with 3-D Gaussian filters of various sizes, ranging from 0 to 625 μm FWHM. In Fig. 7, we compared central trans-axial slices of the reconstructed object using data acquired with both systems. For the two systems compared, the SPEM system offered superior image quality in the sense that all 0.25 mm diameter hot rods were resolved.
Fig. 6.
Trans-axial cross section of the simulated hot-rod phantom. The central gray area was filled with an activity concentration that is 10% of the hot rods.
Fig. 7.

Trans-axial cross section of the reconstructed image. For both systems, the numbers of interactions used were arbitrarily selected. The slice shown is 12 μm thick. The reconstruction was made with OSEM algorithms using 32 subsets and 1–10 iterations, followed by post-filtering using 3-D Gaussian kernel of various sizes (shown below images).
In order to derive the spatial resolution and variance tradeoff curves for the simulated A-SPECT system, 100 independent projection datasets were generated and reconstructed. We first performed reconstructions with standard OSEM algorithm and different number of iterations ranging from 1 to 50. Then we filter these reconstructed images with Gaussian filters of 125 μm, 250 μm, 375 μm, 500 μm and 625 μm FWHM. The empirical (co)variances in the images were derived from the 100 random realizations. In Fig. 8, we showed standard deviation versus FWHM of corresponding point spread function for the simulated A-SPECT system. Varying the number of OSEM iterations and filter size resulted in different tradeoffs between the spatial resolution and variance in reconstructed images. Note that the same resolution/variance tradeoff may be obtained with several different combinations of iteration number and filter size.
Fig. 8.

Standard deviation on a central pixel in the reconstructed images as a function of spatial resolution (FWHM of the point spread function) for the simulated A-SPECT imager. Each individual curve in the cluster represents the tradeoffs achievable with a given number of OSEM iterations and post-filtered with 3-D Gaussian filters of 125, 250, 375, 500 μm and 625 μm FWHM.
For comparison, we also derived similar curves for the SPEM system, for which we used 1–5 iterations in OSEM reconstructions. These results are compared with those for the A-SPECT system in Fig. 9. Clearly, if the required spatial resolution is ranging from 250 to 500 μm FWHM, the SPEM system produced images with much lower noise. It is worth noting that this may not be a fair comparison for the simulated A-SPECT system because it is not designed and optimized for imaging at such high spatial resolutions. For reconstructed images with a spatial resolution above 500 μm, the simulated A-SPECT system (with 500 μm pinholes) outperformed the SPEM system (with 125 μm pinholes) by producing lower variance at the same spatial resolution.
Fig. 9.

Comparing the resolution/noise tradeoff curves for the simulated SPEM and A-SPECT systems.
These MC studies also allowed us to verify the accuracy of the UCRB approach (outlined in Section II-A) for evaluating detector performance. It has been shown that the lower bound on variance (UCRB) can be achieved asymptotically with postfiltering the Maximum Likelihood (ML) solutions. Although OSEM reconstructions are not guaranteed to converge to ML solutions, we expect that OSEM solutions are close the ML solutions in terms of their noise properties. So the predicted variance with UCRB should be close to the ones achieved with Monte Carlo simulations. This similarity is evident in Fig. 10, in which we compared the UCRB with the empirical variance derived from 100 independent realizations. Note that when a relatively narrow filter (FWHM < 200 μm) is used, the UCRB is pessimistic because it does not take into account the non-negativity constraint inherent to the OSEM algorithm. Similar results have been demonstrated by other authors [29].
Fig. 10.

Comparing the predicted minimum achievable variance (solid curve) with the empirical variance in reconstructed images. The data points (shown as black dots) are identical to those shown in Fig. 7 for the simulated SPEM system.
B. Effect of Pinhole Size
It has been shown that the pinhole size should be matched to the desired imaging resolution to achieve an optimum imaging performance [37], [38]. Given that the designed imaging resolution for the SPEM system is between 250 μm and 500 μm, the UCRB approach was used to compare different pinhole sizes. In this study, we kept most of the system configurations unchanged from what shown in Fig. 5, except the pinhole size and detector intrinsic spatial resolution. The active area of the gamma camera was fixed to 5 × 5 cm2 and projection multiplexing was always minimized by Molybdenum inserts as shown in Fig. 5. We compared similar apertures with pinhole sizes of 75 μm, 125 μm and 250 μm. For this study, we used a phantom similar to that used in the Monte Carlo simulation (outlined in Section II-A), except that the cylindrical volume was filled with a uniform radioactivity. For detector with an intrinsic spatial resolution of 100 μm FWHM, the resolution/variance tradeoff curve for a central source pixel is shown in Fig. 11. The aperture with 75 μm pinholes produced the lowest variance when the spatial resolution is below ~ 250 μm FWHM. For spatial resolution above this value, the 125 μm pinhole offers the best tradeoff between resolution and imaging variance. Note that the curves are crossing each other. This indicated that there is no single pinhole size optimized for all desired spatial resolutions. In order to estimate how much these differences are related to the particular detector intrinsic resolution used (100 μm FWHM), we also compared the same set of apertures when used with a detector that has an intrinsic spatial resolution of 25 μm. These results are shown in Fig. 12, which led to similar conclusions. For this particular system configuration, pinhole sizes around 125 μm seem to be appropriate for variance minimizing purpose.
Fig. 11.

Standard deviation versus resolution for the SPEM system with different pinhole sizes. The detector used has an intrinsic spatial resolution of 100 μm FWHM. The smaller panel is a “zoomed in” view which highlighted the comparison between the results using the 75 μm pinholes and 125 μm pinholes.
Fig. 12.

Standard deviation versus resolution for the SPEM system with different pinhole sizes. The detector used has an intrinsic spatial resolution of 25 μm FWHM.
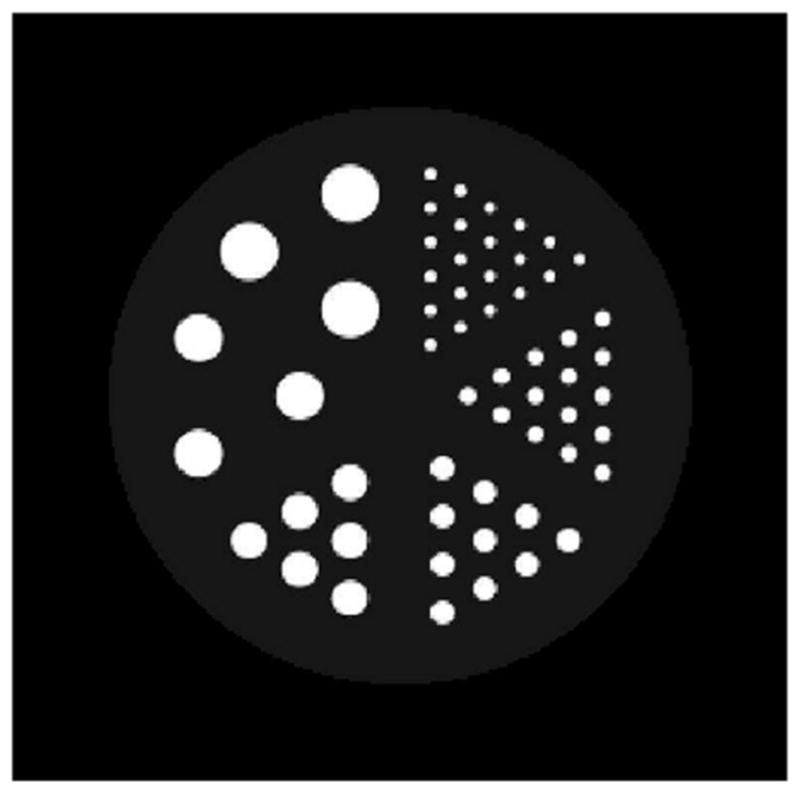
C. Comparing Different Aperture Designs
By varying the design of the non-multiplexing converging multiple pinhole aperture, one can control the tradeoff between detection sensitivity and imaging field of view. Such tradeoffs will substantially affect the imaging performance of the SPEM system. In this study, we compared three aperture configurations having 16, 36 and 64 pinholes respectively. Schematics of these apertures along with the detector and a cylindrical phantom are shown in Fig. 13. All pinholes are equally sized with a 125 μm diameter opening and a 45 degree acceptance angle. For these calculations, the detector dead area introduced by the metal inserts was modeled. The object is a cylinder of ~ 32 mm diameter and 32 mm high. It was divided into cubic pixels of 125 × 125 × 125 μm3 in size. In Fig. 14, we showed absolute sensitivities for source pixels on a diameter along the axis of the object. The sensitivity value shown is the average over all detection probabilities viewed at all 32 view angles. For comparison, we also derived the sensitivity of using the same detector and a single pinhole aperture with a 0.5 mm diameter pinhole. Some characteristics of these apertures are shown in Table II.
Fig. 13.

System configurations with 16, 36 and 64 pinhole apertures.
Fig. 14.

Raw sensitivity as a function of radial distance from the center of the object.
TABLE II.
Characteristics of the Apertures Compared
| Apertures | Pinhole Size | Effective FOV | Detector Dead Area | Sensitivity at the center |
|---|---|---|---|---|
| 1 pinhole | 0.5 mm | N/A | 0% | 3.8×10⁻⁵ |
| 16 pinhole | 0.125 mm | ~ Ø 12 mm | ~6% | 2.9×10⁻⁵ |
| 36 pinhole | 0.125 mm | ~ Ø 8 mm | ~10% | 6.4×10⁻⁵ |
| 64 pinhole | 0.125 mm | ~ Ø 6 mm | ~14% | 1.14×10⁻⁴ |
Compared with single pinhole apertures, the converging collimator resulted in a very different sensitivity profile. For example, for a source location within the focal region, the use of the 64 pinhole aperture offered a raw sensitivity that is around two times higher than that of the single pinhole aperture with a 500 μm diameter pinhole. The sensitivity for the rest of the object volume drops down dramatically outside this region. To quantify the performances of these apertures, we again derived the corresponding spatial resolution/variance tradeoff curves as shown in Fig. 15. The imaging performance improved substantially with the number of pinholes in the aperture. Within the desired range of imaging spatial resolution, the 64 pinhole aperture resulted in a factor of >3 reduction in standard deviation compared with a similar system using the 16 pinhole aperture. It may be possible to achieve a better performance by packing even more pinhole openings in the apertures, until the dead area introduced by the inserts and practical issues in fabricating the aperture become significant.
Fig. 15.

Comparing apertures with different number of pinholes.
IV. Conclusions and Discussions
We presented a design study for a Single Photon Emission Microscope (SPEM) system based on a newly developed gamma camera for very high resolution small animal imaging using I-125 radio tracers. This gamma camera is built around an EMCCD sensor coupled to a de-magnifier tube. It is capable of providing an intrinsic spatial resolution of ~100 μm FWHM or better for I-125 gamma rays. To produce a high imaging spatial resolution whilst maintaining a reasonable detection sensitivity, we used a converging non-multiplexing multiple pinhole collimator for this very high resolution camera head.
For system evaluation, we used both Monte Carlo simulations and an analytical approach that quantifies the tradeoff between spatial resolution and variance in reconstructed images. It showed that when the desired spatial resolution is in the range of 250–500 μm, the SPEM system with an aperture using sixteen 125 μm pinholes significantly improved the imaging performance compared to A-SPECT system with a 0.5 mm pinhole. It was also shown that the point-wise spatial resolution and variance tradeoffs can be further improved by using 64 or even more pinholes in the aperture.
In this work, we only explored a few possible system configurations. There may exist better optimized collimator designs for some given imaging tasks. Although the UCRB approach is relatively efficient in the sense that the large scale matrix inversion is performed with FFT, the computation load required is still limiting us to comparing only a small number of system designs rather than a full systematic optimization. The latter would require much more efficient approaches to be developed.
Contributor Information
L. J. Meng, Department of Nuclear Engineering and Radiological Sciences, University of Michigan, Ann Arbor, MI 48109 USA.
N. H. Clinthorne, Department of Radiology, University of Michigan, Ann Arbor, MI 48109 USA.
S. Skinner, VA Medical Center, Ann Arbor, MI 48109 USA
R. V. Hay, Van Vandel Research Institute, Grand Rapids, MI 49503 USA
M. Gross, VA Medical Center, Ann Arbor, MI 48109 USA
References
- 1.Wu MC, Hasegawa BH, Dae MW. Performance evaluation of a pinhole SPECT system for myocardial perfusion imaging of mice. Med Phys. 2002;29:2830–2839. doi: 10.1118/1.1521939. [DOI] [PubMed] [Google Scholar]
- 2.McElroy DP, MacDonald LR, Beekman FJ, Wang YC, Patt BE, Iwanczyk JS, Tsui BMW, Hoffman EJ. Performance evaluation of A-SPECT: A high resolution desktop pinhole SPECT system for imaging small animals. IEEE Trans Nucl Sci. 2002 Oct;49(5):2139–2147. [Google Scholar]
- 3.Weisenberger AG, Kross B, Majewski S, Wojick R, Bradley EL, Saha MS. Design features and performance of a CsI(Na) array based gamma camera for small animal gene research. IEEE Trans Nucl Sci. 1998 Dec;45(6):3053–3058. [Google Scholar]
- 4.Weisenberger AG, Wojcik R, Bradley EL, Brewer P, Majewski S, Qian J, Ranck A, Saha MS, Smith K, Smith MF, Welsh RE. SPECT-CT system for small animal imaging. IEEE Trans Nucl Sci. 2003 Feb;50(1):74–79. [Google Scholar]
- 5.Beekman FJ, McElroy DP, Berger F, Gambhir SS, Hoffman EJ, Cherry SR. Towards In Vivo nuclear microscopy: Iodine-125 imaging in mice using micro pinholes. Eur J Nucl Med. 2002 Jul;29(7):933–8. doi: 10.1007/s00259-002-0805-6. [DOI] [PubMed] [Google Scholar]
- 6.Beekman FJ, Vastenhouw B, Van der Have F. Towards 3D nuclear microscopy using locally focusing many-pinhole SPECT. Proc. Meeting Fully 3D Image reconstruction in Radiology and Nuclear Medicine; 2003; [Online]. Available: http://www.fully3d.org. [Google Scholar]
- 7.Dilmanian FA, Weber DA, Coderre JA, Joel DD, Shi KC, Meinken GE, Som P, Tang YN, Volkow ND, Yee C, Brill AB, Watanabe M, Inuzuka E, Oba K, Gerson R, Iida H, Hiruma A. A high-resolution spect system based on a microchannel-plate imager. IEEE Trans Nucl Sci. 1990 Apr;37(2):687–695. [Google Scholar]
- 8.Karellas A, Hong L, Reinhardt C, Harris LJ, Brill AB. Imaging of Radionuclide Emissions with a Low-Noise Charge-Coupled-Device. IEEE Trans Nucl Sci. 1993 Aug;40(8):979–982. [Google Scholar]
- 9.Beekman FJ, Colijn AP, Vastenhouw B, Wiegant VM, Gerrits MAFM. High-resolution emission tomography of small laboratory animals: Physics and gamma-astronomy meet molecular biology. Nucl Instrum Meth A. 2003;509(1–3):229–234. [Google Scholar]
- 10.Peterson TE, Wilson DW, Barrett HH. Application of silicon strip detectors to small-animal imaging. Nucl Instrum Meth A. 2003;505(1–2):608–611. [Google Scholar]
- 11.Beekman FJ, de Vree GA. Photon-counting versus an integrating CCD-based gamma camera: Important consequences for spatial resolution. Phys Med Biol. 2005;50:N109–N119. doi: 10.1088/0031-9155/50/12/N01. [DOI] [PubMed] [Google Scholar]
- 12.de Vree GA, Westra AH, Moody I, van der Have F, Ligtvoet KM, Beekman FJ. Photon-counting gamma camera based on an electron-multiplying CCD. IEEE Trans Nucl Sci. 2005 Jun;52(3):580–588. [Google Scholar]
- 13.Beekman FJ, van der Have F, Vastenhouw B, van der Linden AJA, van Rijk PP, Burbach JPH, Smidt MP. U-SPECT-I: A novel system for submillimeter-resolution tomography with radiolabeled molecules in mice. J Nucl Med. 2005;46:1194–1200. [PubMed] [Google Scholar]
- 14.Beekman FJ, Vastenhouw B. Design and simulation of a high-resolution stationary SPECT system for small animals. Phys Med Biol. 2004;49(19):4579–4592. doi: 10.1088/0031-9155/49/19/009. [DOI] [PubMed] [Google Scholar]
- 15.Lackas C, Schramm NU, Hoppin JW, Engeland U, Wirrwar A, Halling H. T-SPECT: A novel imaging technique for small animal research. IEEE Trans Nucl Sci. 2005 Feb;52(1):181–187. [Google Scholar]
- 16.Coates C, Denvir D, Haron I, Hollywood M, Thornbury K, McHale N. EMCCD—The definitive ultra low-light solution? Bio-phys J. 2004;86(1):151a–151a. [Google Scholar]
- 17.Robbins MS, Hadwen BJ. The noise performance of electron multiplying charge-coupled devices. IEEE Trans Electron Devices. 2003 May;50(5):1227–1232. [Google Scholar]
- 18.Nagarkar V, Shestakova I, Gaysinskiy V, Tipnis SV, Singh B, Barber WC, Hasegawa BH, Entine G. CCD-based detector for SPECT. IEEE NSS-MIC Conf. Record; Rome, Italy. 2004. [Google Scholar]
- 19.Technical Datasheet. [Online]. Available: http://www.photek.com.
- 20.CCD97 Back Illuminated Datasheet. [Online]. Available: http://e2vtechnologies.com/product\_guides/l3vision\_sensors.htm.
- 21.Andor Technologies. [Online]. Available: http://www.andor.com/products.
- 22.Meng LJ, Clinthorne N, Skinner S, Gross M, Hay RH. A single photon emission microscope system for I-125 imaging in small animals. IEEE NSS/MIC Conf. Record; 2005; [DOI] [PMC free article] [PubMed] [Google Scholar]
- 23.Hay RV, Cao B, Skinner RS, Su YL, Zhao P, Gustafson MF, Qian CN, Teh BT, Knudsen BS, Resau JH, Shen SR, Waters DJ, Gross MD, Vande Woude GF. Nuclear imaging of met-expressing human and canine cancer xenografts with radiolabeled monoclonal antibodies (MetSeek (TM)) Clin Cancer Res. 2005;11:7064s–7069s. doi: 10.1158/1078-0432.CCR-1004-0014. [DOI] [PubMed] [Google Scholar]
- 24.Hay RV, Cao B, Skinner RS, Wang LM, Su YL, Resau JH, Knudsen BS, Gustafson MF, Koo HM, Vande Woude GF, Gross MD. Radioimmunoscintigraphy of human met-expressing tumor xenografts using Met3, a new monoclonal antibody. Clin Cancer Res. 2003;9:3839s–3844s. [PubMed] [Google Scholar]
- 25.Hay RV, Skinner RS, Newman OC, Kunkel SL, Lyle LR, Shapiro B, Gross MD. Scintigraphy of acute inflammatory lesions in rats with radiolabelled recombinant human neutrophil-activating peptide-2. Nucl Med Commun. 2002;23:367–372. doi: 10.1097/00006231-200204000-00010. [DOI] [PubMed] [Google Scholar]
- 26.[Online]. Available: http://www.gammamedica.com/products/products.html
- 27.Meng LJ, Wehe DK. Feasibility study of using hybrid collimation for nuclear environmental imaging. IEEE Trans Nucl Sci. 2003 Aug;50(4):1103–1110. doi: 10.1109/TNS.2003.815135. [DOI] [PMC free article] [PubMed] [Google Scholar]
- 28.Van Trees HL. Detection, Estimation and Modulation Theory. New York: Wiley; 1968. [Google Scholar]
- 29.Hero AO, Fessler JA, Usman M. Exploring estimator bias-variance tradeoffs using the uniform CR bound. IEEE Trans Signal Process. 1996 Aug;44(8):2026–2041. [Google Scholar]
- 30.Meng LJ, Clinthorne NH. A modified uniform Cramer-Rao bound for multiple pinhole aperture design. IEEE Trans Med Imag. 2004 Jul;23(7):896–902. doi: 10.1109/TMI.2004.828356. [DOI] [PMC free article] [PubMed] [Google Scholar]
- 31.Fessler JA. Mean and variance of implicitly defined biased estimators (such as penalized maximum likelihood): Applications to tomography. IEEE Trans Image Process. 1996 Mar;5(3):493–506. doi: 10.1109/83.491322. [DOI] [PubMed] [Google Scholar]
- 32.Fessler JA, Booth SD. Conjugate-gradient preconditioning methods for shift-variant PET image reconstruction. IEEE Trans Image Processing. 1999;8(5):688–699. doi: 10.1109/83.760336. [DOI] [PubMed] [Google Scholar]
- 33.Meng LJ, Rogers WL, Clinthorne N. Feasibility study of compton scattering enhanced multiple pinhole imager for nuclear medicine. IEEE Trans Nucl Sci. 2003 Oct;50(5) doi: 10.1109/NSSMIC.2002.1239548. [DOI] [PMC free article] [PubMed] [Google Scholar]
- 34.Qi JY, Leahy RM. A theoretical study of the contrast recovery and variance of MAP reconstructions from PET data. IEEE Trans Med Imag. 1999 Apr;18(4):293–305. doi: 10.1109/42.768839. [DOI] [PubMed] [Google Scholar]
- 35.Manglos SH, Gagne GM, Krol A, Thomas FD, Narayanaswamy R. Transmission maximum-likelihood reconstruction with ordered subsets for cone-beam CT. Phys Med Biol. 1995;40(7):1225–1241. doi: 10.1088/0031-9155/40/7/006. [DOI] [PubMed] [Google Scholar]
- 36.Comtat C, Kinahan PE, Defrise M, Michel C, Townsend DW. Fast reconstruction of 3D PET data with accurate statistical modeling. Trans Nucl Sci. 1998;45(3):1083–1089. [Google Scholar]
- 37.Myers KJ, Rolland JP, Barrett HH, Wagner RF. Aperture optimization for emission imaging—effect of a spatially varying background. J Opt Soc Amer A. 1990;7:1279–1293. doi: 10.1364/josaa.7.001279. [DOI] [PubMed] [Google Scholar]
- 38.Fessler JA. Spatial resolution and noise tradeoffs in pinhole imaging system design: A density estimation approach. Opt Expr. 1998;2:237–253. doi: 10.1364/oe.2.000237. [DOI] [PubMed] [Google Scholar]